

Abstract
It is important to accurately estimate terrestrial ecosystem carbon (C) storage. However, the spatial patterns of C storage and the driving factors remain unclear, owing to lack of data. Here, we collected data from literature published between 2004 and 2014 on C storage in China’s terrestrial ecosystems, to explore variation in C storage across different ecosystems and evaluate factors that influence them. We estimated that total C storage was 99.15 ± 8.71 PgC, with 14.60 ± 3.24 PgC in vegetation C (Veg-C) and 84.55 ± 8.09 PgC in soil organic C (SOC) storage. Furthermore, C storage in forest, grassland, wetland, shrub, and cropland ecosystems (excluding vegetation) was 34.08 ± 5.43, 25.69 ± 4.71, 3.62 ± 0.80, 7.42 ± 1.92, and 15.17 ± 2.20 PgC, respectively. In addition to soil nutrients and texture, climate was the main factor regulating the spatial patterns of C storage. Climate influenced the spatial patterns of Veg-C and SOC density via different approaches, Veg-C was mainly positively influenced by mean annual precipitation (MAP), whereas SOC was negatively dependent on mean annual temperature (MAT). This systematic estimate of C storage in China provides new insights about how climate constrains C sequestration, demonstrating the contrasting effects of MAP and MAT on Veg-C and SOC; thus, these parameters should be incorporated into future land management and C sequestration strategies.
Introduction
Terrestrial ecosystems are the main component of carbon (C) pools in the Earth’s system, and contribute considerably to the global C balance1–3. Furthermore, terrestrial ecosystems are a major C sink, sequestering approximately 28% of CO2 emissions originating from anthropogenic activity4,5. Enhancing C storage in terrestrial ecosystems is widely considered as an effective and environmentally friendly measure to sequester anthropogenic CO2 emissions6,7. Therefore, it is important for policy makers to obtain accurate estimates of C storage and to understand what factors influence its spatial distribution across ecosystems.
China covers 6.4% of the global terrestrial area, and is crucial in determining the global C balance in terms of both C emissions and C uptake3,8,9. Some studies have estimated the C storage capacity of China’s terrestrial ecosystem by using inventory data or remote sensing data10–12. However, most of these studies focused on assessing vegetation C (Veg-C) or soil organic C (SOC) separately, or only focused on one specific type of ecosystem (e.g., forest, grassland)13–17.
Some studies have also explored C storage in China’s terrestrial ecosystems using alternative approaches, such as modeling or statistical methods6,11–43 (Table 1). Yet, uncertainty remains high among the various studies, especially with respect to estimating SOC storage in China’s terrestrial ecosystems, with values ranging from 50.0 to 185.7 Pg C (Table 1). This large uncertainty is mainly attributed to variation in the collection periods, data validity, and estimation methods19. Thus, it is essential to obtain robust estimates of C storage at large scales using comprehensive data and optimized methods. In fact, field investigations represent a source of credible and reliable data, and might reliably reflect the status of Veg-C and SOC, with the required monitoring instruments and operating methods of field investigations being simple3,13,35,44–46. However, few studies have used field investigation data to estimate C storage in China’s terrestrial ecosystems, because a synthetic field investigation of C storage in vegetation and soil at a national scale is time-consuming, laborious, and difficult to implement, especially in remote areas44.
Table 1.
Carbon density and storage reported from different ecosystems in China and China’s terrestrial ecosystems.
| Ecosystems | Period | Approach | Data source | Area | Vegetation | C storage (Pg C) | Soil† | C storage (Pg C) | Ecosystem | References |
|---|---|---|---|---|---|---|---|---|---|---|
| (×104 km2) | C density (kg C m−2) | C density (kg C m−2) | C storage (Pg C) | |||||||
| Forest | 1999–2003 | Statistics | National forest inventory data | 142.80 | 4.10 | 5.85 | 6 | |||
| 1994–1998 | Statistics | National forest inventory data | 105.82 | 4.49 | 4.75 | 13 | ||||
| 2004–2008 | Statistics | National forest inventory data | 182.48 | 4.28 | 7.81 | 16 | ||||
| 1989–1993 | Statistics | National forest inventory data and investigation data | 127.06 | 7.17 | 9.11 | 18 | ||||
| 1989–1993 | Statistics | National forest inventory data | 108.64 | 3.87 | 4.20 | 20 | ||||
| 1989–1993 | Statistics | Published data and national forest investigation data | 108.62 | 5.71 | 6.20 | 19.36 | 21.02 | 27.22 | 21 | |
| 1989–1993 | Statistics | National forest inventory data | 108.60 | 4.00 | 4.34 | 22 | ||||
| 1979–1985 | Statistics | China’s second national soil survey | 150.00 | 11.59 | 17.39 | 23 | ||||
| 1989–1993 | Statistics | National forest inventory data | 91.43 | 4.13 | 3.78 | 24 | ||||
| 1982–1999 | Modeling | National forest inventory data and NDVI data | 127.89 | 4.53 | 5.79 | 25 | ||||
| 1979–1985 | Statistics | China’s second national soil survey | 249.32 | 13.73 | 34.23 | 26 | ||||
| 1999–2003 | Statistics | National forest inventory data | 142.79 | 3.86 | 5.51 | 27 | ||||
| 1979–2004 | Statistics | China’s second national soil survey and investigation data | 197.13 | 10.50 | 20.7 | 28 | ||||
| 1999–2003 | Statistics | National forest inventory data | 5.16 | 29 | ||||||
| 2004–2008 | Statistics | National forest inventory data | 186.21 | 4.08 | 7.59 | 30 | ||||
| 2004–2008 | Modeling (HASM) | National forest inventory data | 195.45 | 4.73 | 9.24 | 31 | ||||
| 1979–1985 | Statistics | China’s second national soil survey | 179.48 | 10.63 | 19.08 | 32 | ||||
| 2004–2014 | Statistics | Published literature and investigation data | 195.89 | 5.86 ± 1.62 | 11.49 ± 3.18 | 11.53 ± 2.24 | 22.59 ± 4.40 | 34.08 ± 5.43 | This study | |
| Grassland | 1981–1998 | Modeling (CEVSA) | FAO database and NDVI data | 166.96 | 0.34 | 0.56 | 9.99 | 16.69 | 17.25 | 12 |
| 1981–1988 | Statistics | National grassland resource survey data | 298.97 | 1.15 | 3.06 | 13.16 | 41.03 | 44.09 | 14 | |
| 1979–1985 | Statistics | China’s second national soil survey | 223.00 | 8.83 | 19.68 | 23 | ||||
| 1979–1985 | Statistics | China’s second national soil survey | 278.51 | 13.54 | 37.71 | 26 | ||||
| 1979–1985 | Statistics | China’s second national soil survey and investigation data | 268.35 | 9.17 | 24.60 | 28 | ||||
| 1979–1985 | Statistics | China’s second national soil survey | 296.70 | 9.29 | 27.58 | 32 | ||||
| 1982–1999 | Statistics | National grassland resource survey data and NDVI data | 331.41 | 0.31 | 1.04 | 33 | ||||
| 1981–1988 | Statistics | National grassland resource survey data and NDVI data | 334.10 | 0.32 | 1.05 | 34 | ||||
| 2003–2004 | Statistics | Investigation data | 331.00 | 1.00 | 3.32 | 35 | ||||
| 1981–1988 | Statistics | Published literature | 331.41 | 0.30 | 0.99 | 8.48 | 28.11 | 29.1 | 36 | |
| 2003–2014 | Statistics | Published literature | 355.05 | 0.50 | 1.61 | 7.96 | 29.37 | 30.98 | 37 | |
| 2004–2014 | Statistics | Published literature and investigation data | 280.44 | 0.69 ± 0.20 | 1.94 ± 0.55 | 8.47 ± 1.67 | 23.75 ± 4.68 | 25.69 ± 4.71 | This study | |
| Cropland | 1981–1998 | Modeling (CEVSA) | FAO database and NDVI data | 172.89 | 0.57 | 0.98 | 10.84 | 18.73 | 19.71 | 12 |
| 1979–1985 | Statistics | China’s second national soil survey | 182.00 | 8.07 | 14.67 | 23 | ||||
| 1979–1985 | Statistics | China’s second national soil survey and investigation data | 167.03 | 7.57 | 12.65 | 28 | ||||
| 1979–1985 | Statistics | China’s second national soil survey | 178.51 | 8.43 | 15.04 | 32 | ||||
| 2004–2014 | Statistics | Published literature | 171.53 | 8.85 ± 1.17 | 15.17 ± 2.00 | This study | ||||
| Wetland | Statistics | Published literature | 22.50 | 0.13–0.50 | 5.04–6.19 | 17 | ||||
| 1979–1985 | Statistics | China’s second national soil survey | 11.89 | 14.76 | 1.75 | 32 | ||||
| 2004–2014 | Statistics | Published literature | 14.46 | 1.40 ± 0.43 | 0.20 ± 0.06 | 23.60 ± 5.51 | 3.41 ± 0.80 | 3.62 ± 0.80 | This study | |
| Shrub | 1981–1998 | Modeling (CEVSA) | FAO database and NDVI data | 216.53 | 1.47 | 2.32 | 9.17 | 11.78 | 14.10 | 12 |
| Statistics | Published literature | 154.62 | 10.88 | 1.68 | 15 | |||||
| 1979–1985 | Statistics | China’s second national soil survey | 188.00 | 7.25 | 13.62 | 23 | ||||
| 2004–2014 | Statistics | Published soil organic carbon data | 77.69 | 0.56 ± 0.13 | 0.44 ± 0.10 | 8.98 ± 2.47 | 6.98 ± 1.92 | 7.42 ± 1.92 | This study | |
| Terrestrial | Modeling(OBM) | WOSCN database | 968 | 5.98 | 57.90 | 10.33 | 100.00 | 157.90 | 11 | |
| 1981–1998 | Modeling (CEVSA) | FAO database and NDVI data | 901.14 | 1.47 | 13.33 | 9.17 | 82.65 | 95.98 | 12 | |
| Modeling(BIOME3) | WOSCN database | 959.63 | 6.00 | 57.57 | 12.48 | 119.80 | 177.37 | 18 | ||
| Published literature | 35.23 | 119.76 | 154.99 | 19 | ||||||
| 1979–1985 | Statistics | China’s second national soil survey | 870.94 | 10.29 | 89.61 | 26 | ||||
| 1979–2004 | Statistics | China’s second national soil survey and investigation data | 880.37 | 7.80 | 69.10 | 28 | ||||
| 1979–1985 | Statistics | China’s second national soil survey | 938.79 | 9.31 | 87.36 | 32 | ||||
| 1958–1960 | Statistics | China’s first national soil survey and forest inventory data | 944.86 | 0.65 | 6.10 | 20.3 | 185.70 | 191.70 | 38 | |
| 1979–1985 | Statistics | China’s second national soil survey | 915 | 4.86 | 50.00 | 39 | ||||
| 1979–1985 | Statistics | China’s second national soil survey | 877.63 | 10.53 | 92.42 | 40 | ||||
| 1979–1985 | Statistics | China’s second national soil survey | 881.81 | 8.01 | 70.31 | 41 | ||||
| 1979–1985 | Statistics | China’s second national soil survey | 928.10 | 9.60 | 89.14 | 42 | ||||
| 1979–1985 | Statistics | China’s second national soil survey | 928.10 | 9.46 | 87.78 | 43 | ||||
| 2004–2014 | Statistics | Published soil organic carbon data | 925.64 | 1.58 ± 0.35 | 14.60 ± 3.24 | 9.13 ± 0.87 | 84.55 ± 8.09 | 99.15 ± 8.71 | This study |
†Soil depths at which soil organic carbon (SOC) density and storage were estimated was approximately 100 cm in this table.
Understanding the spatial patterns and key influencing factors of C storage at large scales could help us to adopt effective sequestration strategies. Theoretically, several factors, such as site conditions (climate), vegetation type, soil properties (clay content, soil moisture, pH, nutrient status), and land use, could influence the spatial patterns of C storage in vegetation and soil via different processes or mechanisms25,47–50. Among these factors, climate (principally mean annual temperature (MAT) and mean annual precipitation (MAP)) and vegetation type are generally assumed to be the major factors influencing the spatial distribution of Veg-C and SOC47,49,51,52. In natural ecosystems, vegetation C (Veg-C) storage is determined by the balance between C absorption during photosynthesis and the release of C by respiration and dead biomass, with MAT and MAP influencing the net primary productivity of vegetation by regulating the supply of energy and water, which, in turn, influence Veg-C53. Soil C storage is determined by the balance between C input by litterfall and rhizodeposition, in addition to the output of C during decomposition47,54,55; however, changing temperature might affect the decomposition of soil organic matter (SOM)56. Therefore, different factors (MAP vs. MAT) are expected to influence the patterns of Veg-C and SOC via different approaches at large scales.
In this study, we collected field-measured C storage data in China’s terrestrial ecosystems from literature published between 2004 and 2014. These data encompassed the main ecosystems in China (forest, grassland, cropland, wetland, and shrub ecosystems), and included different components (above-ground biomass, below-ground biomass, and soil C content at depths of 0–20 cm and 0–100 cm). We estimated the Veg-C and SOC density and storage of different ecosystems, and then summed them to evaluate the C storage in China, based on the statistical method of ecosystem type, which has been widely used to evaluate C storage at a regional and national scale3,12,50. To allow our results to be compared with most previous studies, we estimated SOC storage in the 0–20 cm and 0–100 cm soil layers. The main objectives of this study were to: (1) generate a comprehensive C density dataset from which to estimate C storage in China’s terrestrial ecosystems; (2) explore the spatial patterns of Veg-C and SOC density and the main factors influencing these patterns; and (3) test the assumption that climate influences the patterns of Veg-C and SOC density through different approaches (MAT vs. MAP).
Results
C storage in China’s terrestrial ecosystems
Veg-C and SOC (0–100 cm soil layer) storage were estimated as 14.60 ± 3.24 and 84.55 ± 8.09 Pg C, respectively, with a sum of 99.15 ± 8.71 Pg C storage in China’s terrestrial ecosystems (Fig. 1; Supplementary Table S1). The average density of Veg-C and SOC (0–100 cm) was approximately 1.58 ± 0.35 and 9.13 ± 0.87 kg C m−2, respectively. AGBC and BGBC storage was 10.01 ± 3.11 and 4.59 ± 0.90 Pg C, respectively. SOC storage in the topsoil (0–20 cm) was estimated as 34.32 ± 3.37 Pg C, and represented 40.59% of SOC storage in the 0–100 cm soil layer (Supplementary Table S1).
Figure 1.

Carbon density (kg C m−2) and storage (Pg C) in the different ecosystems of China. The total soil depth used to estimate soil organic carbon (SOC) density and storage was 100 cm in these figures.
C storage in forest, grassland, and shrub ecosystems was 34.08 ± 5.43, 25.69 ± 4.71, and 7.42 ± 1.92 Pg C, with an average density of 17.40 ± 2.77, 9.16 ± 1.68, and 9.55 ± 2.48 kg C m−2, respectively (Fig. 1; Supplementary Table S1). For croplands, SOC storage was 15.17 ± 2.00 Pg C. Despite wetlands having high C density (25.69 ± 4.71 kg C m−2), they had low C storage (3.62 ± 0.80 Pg C), due to their smaller area (14.46 × 10⁴ km2).
Spatial distribution of C density in China’s terrestrial ecosystems
The spatial distribution of Veg-C differed from that of SOC density. Specifically, Veg-C density declined with increasing latitude, and high Veg-C density and storage was detected in the southeastern regions of China. SOC density increased with increasing latitude, with high SOC density and storage being observed in the northeastern and southeastern regions of China (Supplementary Fig. S2; Table 2). Veg-C density ranged from 0.35 to 4.72 kg C m−2 among the 18 ecological regions (Table 2). Veg-C density was generally higher in cold humid regions (R1), temperate humid regions (R2), south subtropical humid regions (R17), and tropical humid regions (R18). Unlike other regions, temperate arid regions (R5) and warm temperate arid regions (R6), which were located in the northwestern region of China, had the lowest Veg-C density (Supplementary Fig. S2; Table 2; Supplementary Table S2). The distribution of SOC density was similar in the 0–20 cm and 0–100 cm soil layers. Cold humid regions (R1) had the highest SOC density, with average densities of 8.88 ± 2.50 and 17.76 ± 7.17 kg C m−2 in the 0–20 cm and 0–100 cm soil layer, respectively. In comparison, the lowest SOC density occurred in warm temperate arid regions (R6) (2.12 ± 1.10 kg C m−2) for the 0–20 cm layer, and in the Qinghai-Tibet Plateau semi-frigid semi-arid regions (R12) (5.06 ± 1.47 kg C m−2) for the 0–100 cm layer.
Table 2.
Estimates of carbon density (kg C m−2) and storage (Pg C) in different regions of China.
| Regions | Area | Vegetation | Soil | Vegetation + soil (0–100 cm) | |||||||||
|---|---|---|---|---|---|---|---|---|---|---|---|---|---|
| (×104 km2) | AGBC | BGBC | Total | 0–20 cm | 0–100 cm | ||||||||
| Density | Storage | Density | Storage | Density | Storage | Density | Storage | Density | Storage | Density | Storage | ||
| (kg C m−2) | (Pg C) | (kg C m−2) | (Pg C) | (kg C m−2) | (Pg C) | (kg C m−2) | (Pg C) | (kg C m−2) | (Pg C) | (kg C m−2) | (Pg C) | ||
| Cold humid regions (R1) | 14.53 | 3.69±2.78 | 0.54±0.40 | 1.03±0.54 | 0.15±0.08 | 4.72±2.83 | 0.69±0.41 | 8.88±2.50 | 1.29±0.36 | 17.76±7.17 | 2.58±1.04 | 22.48±7.71 | 3.27±1.12 |
| Temperate humid regions (R2) | 52.66 | 2.83±1.77 | 1.49±0.93 | 0.70±0.44 | 0.37±0.23 | 3.53±1.83 | 1.86±0.96 | 6.11±1.41 | 3.22±0.74 | 14.01±3.46 | 7.38±1.82 | 17.54±3.91 | 9.24±2.06 |
| Temperate semi-humid regions (R3) | 29.83 | 1.28±1.10 | 0.38±0.33 | 0.42±0.23 | 0.13±0.07 | 1.70±1.12 | 0.51±0.34 | 4.14±1.39 | 1.23±0.42 | 10.20±3.78 | 3.04±1.13 | 11.90±3.94 | 3.55±1.18 |
| Temperate semi-arid regions (R4) | 78.84 | 0.27±0.22 | 0.21±0.17 | 0.44±0.29 | 0.34±0.23 | 0.71±0.37 | 0.56±0.29 | 2.72±1.39 | 2.14±1.10 | 6.96±3.36 | 5.49±2.65 | 7.67±3.38 | 6.05±2.67 |
| Temperate arid regions (R5) | 91.78 | 0.12±0.08 | 0.11±0.07 | 0.23±0.20 | 0.21±0.18 | 0.35±0.21 | 0.32±0.20 | 2.31±1.23 | 2.12±1.13 | 6.66±3.12 | 6.12±2.86 | 7.01±3.12 | 6.43±2.87 |
| Warm temperate arid regions (R6) | 86.02 | 0.14±0.11 | 0.12±0.10 | 0.22±0.12 | 0.19±0.10 | 0.35±0.17 | 0.30±0.14 | 2.12±1.10 | 1.83±0.94 | 8.36±3.83 | 7.19±3.30 | 8.72±3.83 | 7.50±3.30 |
| Qinghai-Tibet plateau frigid arid regions (R7) | 41.34 | 0.09±0.06 | 0.04±0.03 | 0.47±0.31 | 0.20±0.13 | 0.56±0.32 | 0.23±0.13 | 2.36±1.63 | 0.98±0.67 | 7.36±3.98 | 3.04±1.65 | 7.92±3.99 | 3.27±1.65 |
| Warm temperate semi-humid regions (R8) | 70.67 | 0.57±0.37 | 0.40±0.26 | 0.21±0.10 | 0.15±0.07 | 0.78±0.38 | 0.55±0.27 | 2.83±0.57 | 2.00±0.40 | 7.34±1.38 | 5.19±0.98 | 8.12±1.43 | 5.74±1.01 |
| Warm temperate humid regions (R9) | 3.49 | 0.75±0.53 | 0.03±0.02 | 0.22±0.13 | 0.01±0.00 | 0.97±0.55 | 0.03±0.02 | 2.80±0.66 | 0.10±0.02 | 7.39±1.63 | 0.26±0.06 | 8.36±1.71 | 0.29±0.06 |
| Qinghai-Tibet plateau temperate arid regions (R10) | 37.08 | 0.07±0.08 | 0.03±0.03 | 0.41±0.51 | 0.15±0.19 | 0.48±0.52 | 0.18±0.19 | 2.25±1.38 | 0.84±0.51 | 7.28±3.80 | 2.70±1.41 | 7.76±3.83 | 2.88±1.42 |
| Qinghai-Tibet plateau temperate semi-arid regions (R11) | 41.86 | 0.16±0.09 | 0.07±0.04 | 0.75±0.56 | 0.31±0.24 | 0.91±0.57 | 0.38±0.24 | 5.03±2.29 | 2.11±0.96 | 11.90±4.63 | 4.98±1.94 | 12.81±4.67 | 5.36±1.95 |
| Qinghai-Tibet plateau subfrigid semi-arid regions (R12) | 62.80 | 0.05±0.05 | 0.03±0.03 | 0.35±0.42 | 0.22±0.26 | 0.40±0.42 | 0.25±0.26 | 2.14±1.14 | 1.34±0.72 | 5.06±1.47 | 3.18±0.92 | 5.46±1.53 | 3.43±0.96 |
| Qinghai-Tibet plateau subfrigid semi-humid regions (R13) | 28.51 | 0.12±0.05 | 0.03±0.02 | 0.76±0.55 | 0.22±0.16 | 0.88±0.55 | 0.25±0.16 | 6.20±2.24 | 1.77±0.64 | 12.70±4.90 | 3.62±1.40 | 13.58±4.93 | 3.87±1.41 |
| North subtropical humid regions (R14) | 42.43 | 1.34±0.81 | 0.57±0.34 | 0.43±0.21 | 0.18±0.09 | 1.76±0.84 | 0.75±0.36 | 4.03±0.99 | 1.71±0.42 | 9.78±2.34 | 4.15±0.99 | 11.54±2.48 | 4.90±1.05 |
| Qinghai-Tibet plateau temperate humid and semi-humid regions (R15) | 37.71 | 1.28±0.78 | 0.48±0.29 | 0.83±0.36 | 0.31±0.14 | 2.11±0.86 | 0.79±0.32 | 6.36±1.47 | 2.40±0.56 | 11.58±3.51 | 4.37±1.33 | 13.68±3.61 | 5.16±1.36 |
| Mid-subtropical humid regions (R16) | 142.72 | 2.44±1.85 | 3.49±2.64 | 0.63±0.41 | 0.91±0.58 | 3.08±1.90 | 4.40±2.71 | 4.63±1.32 | 6.61±1.89 | 10.27±2.79 | 14.67±3.98 | 13.35±3.37 | 19.07±4.81 |
| South subtropical humid regions (R17) | 45.01 | 3.01±2.06 | 1.36±0.93 | 0.82±0.51 | 0.37±0.23 | 3.83±2.12 | 1.73±0.96 | 4.25±1.21 | 1.92±0.54 | 10.31±3.39 | 4.65±1.53 | 14.13±4.00 | 6.37±1.80 |
| Tropical humid regions (R18) | 18.17 | 3.53±3.29 | 0.64±0.60 | 1.01±0.74 | 0.18±0.14 | 4.53±3.37 | 0.83±0.61 | 3.99±1.46 | 0.73±0.27 | 10.73±4.05 | 1.95±0.74 | 15.27±5.27 | 2.78±0.96 |
| Total | 925.64 | 1.08±0.34 | 10.01±3.11 | 0.50±0.10 | 4.59±0.90 | 1.58±0.35 | 14.60±3.24 | 3.71±0.36 | 34.32±3.37 | 9.13±0.87 | 84.55±8.09 | 10.71±0.94 | 99.15±8.71 |
Factors influencing the spatial distribution of C density
Climate, soil nutrients, and soil texture jointly explained 68.16% of total variance in spatial Veg-C density in the GLM analysis (Table 3). Climate (MAP and MAT) was the most important factor influencing this variation, explaining 50.49% of total variance (of which MAP explained 45.21% and MAT explained 5.28%). Climate, vegetation, soil nutrients, and soil texture jointly explained 95.31% and 90.01% of total variance in the spatial patterns of SOC density for the 0–20 cm and 0–100 cm soil layers, respectively (Table 4). Among these factors, vegetation and climate (especially MAT) were the most important factors explaining the spatial patterns of SOC density. Climate (especially MAT) significantly influenced the spatial patterns of SOC density in the topsoil (0–20 cm), but only minimally influenced it in the 0–100 cm soil layer. Climate was the most important factor influencing the spatial pattern of C density across ecosystems (Veg-C + SOC), explaining 34.72% of the total variance.
Table 3.
The contribution of climate, soil texture, and soil nutrients to the spatial patterns of vegetation carbon (Veg-C) density in China’s terrestrial ecosystems. †AGBC, above-ground biomass carbon; BGBC, below-ground biomass carbon; Veg-C, AGBC + BGBC; ‡***p <0.001, **p <0.01, *p <0.05, d.f., degree of freedom, m.s., mean square, % s.s., proportion of variance explained by a given variable.
| AGBC† | d.f. | m.s. | % s.s. | BGBC | d.f. | m.s. | % s.s. | Veg-C | d.f. | m.s. | % s.s. | |
|---|---|---|---|---|---|---|---|---|---|---|---|---|
| Climate | Mean annul precipitation (MAP) | 1 | 13.488**‡ | 46.56 | MAP | 1 | 0.270* | 21.51 | MAP | 1 | 17.572** | 45.21 |
| Mean annual temperature (MAT) | 1 | 0.675 | 2.33 | MAT | 1 | 0.373** | 29.72 | MAT | 1 | 2.051 | 5.28 | |
| Soil texture | Clay | 1 | 0.420 | 1.45 | Clay | 1 | 0.005 | 0.40 | Clay | 1 | 0.514 | 1.32 |
| Silt | 1 | 0.026 | 0.09 | Silt | 1 | 0.023 | 1.83 | Silt | 1 | 0.001 | <0.01 | |
| Sand | 1 | 0.512 | 1.77 | Sand | 1 | 0.110 | 8.76 | Sand | 1 | 1.098 | 2.83 | |
| Soil nutrient | Soil nitrogen content (Soil N) | 1 | 0.816 | 2.82 | Soil N | 1 | 0.003 | 0.24 | Soil N | 1 | 0.725 | 1.87 |
| Soil phosphorus content (Soil P) | 1 | 0.181 | 0.62 | Soil P | 1 | 0.108 | 8.61 | Soil P | 1 | 0.571 | 1.47 | |
| Soil potassium content (Soil K) | 1 | 3.091 | 10.67 | Soil K | 1 | 0.054 | 4.30 | Soil K | 1 | 3.959 | 10.18 | |
| Residuals | 9 | 1.085 | 33.69 | Residuals | 9 | 0.034 | 24.62 | Residuals | 9 | 1.375 | 31.84 |
Table 4.
Contribution of vegetation, climate, soil texture, and soil nutrients to the spatial patterns of soil organic carbon (SOC) density and ecosystem carbon density (Veg-C and SOC (0–100 cm)) in China’s terrestrial ecosystems.
| SOC (0–20 cm) | d.f. | m.s. | % s.s. | SOC (0–100 cm) | d.f. | m.s. | % s.s. | Veg-C + SOC (0–100 cm) | d.f. | m.s. | % s.s. | |
|---|---|---|---|---|---|---|---|---|---|---|---|---|
| Vegetation | Vegetation C density (Veg-C) | 1 | 27.515***† | 45.73 | Veg-C | 1 | 86.276*** | 52.26 | ||||
| Climate | Mean annul precipitation (MAP) | 1 | 3.321* | 5.52 | MAP | 1 | 15.544* | 9.42 | MAP | 1 | 56.538 | 17.68 |
| Mean annual temperature (MAT) | 1 | 9.956*** | 16.55 | MAT | 1 | 9.910 | 6.00 | MAT | 1 | 54.483 | 17.04 | |
| Soil texture | Clay | 1 | 0.001 | <0.01 | Clay | 1 | 0.846 | 0.51 | Clay | 1 | 8.673 | 2.71 |
| Silt | 1 | 1.371 | 2.28 | Silt | 1 | 3.529 | 2.14 | Silt | 1 | 3.445 | 1.08 | |
| Sand | 1 | 2.698* | 4.48 | Sand | 1 | 3.706 | 2.24 | Sand | 1 | 23.139 | 7.24 | |
| Soil nutrient | Soil nitrogen content (Soil N) | 1 | 6.030** | 10.02 | Soil N | 1 | 17.756* | 10.76 | Soil N | 1 | 3.347 | 1.05 |
| Soil phosphorus content (Soil P) | 1 | 5.160** | 8.58 | Soil P | 1 | 11.005* | 6.67 | Soil P | 1 | 1.138 | 0.36 | |
| Soil potassium content (Soil K) | 1 | 1.292 | 2.15 | Soil K | 1 | 0.021 | 0.01 | Soil K | 1 | 35.429 | 11.08 | |
| Residuals | 8 | 0.353 | 4.69 | Residuals | 8 | 2.062 | 9.99 | Residuals | 9 | 14.842 | 41.77 |
Climate, soil nutrients, and soil texture also explained 64% of variation in Veg-C density (Fig. 2A) when using path analysis, with MAP having the highest direct path coefficient (0.65). For the topsoil (0–20 cm), climate, vegetation, soil nutrients and soil texture explained 70% of variation in the spatial pattern of SOC density (Fig. 2B). The direct path coefficients were −0.65 and 0.27 for MAT and MAP, respectively, whereas the coefficient was 0.71 for Veg-C.
Figure 2.
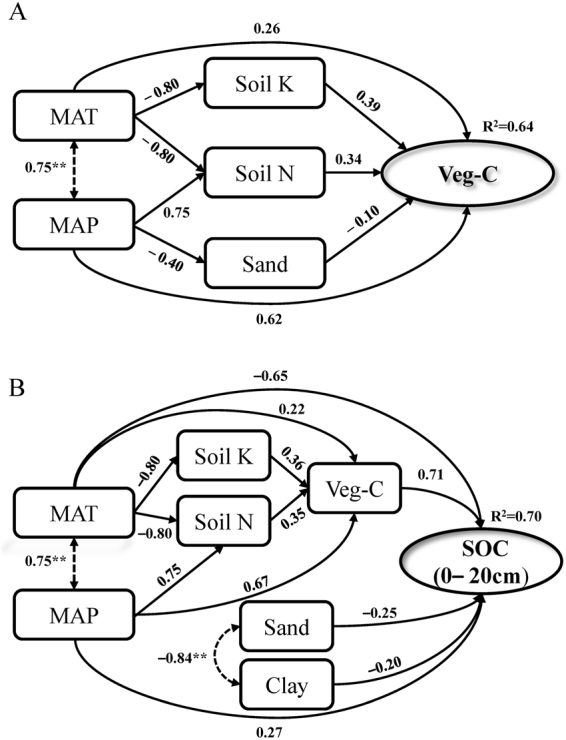
Mechanisms influencing the spatial patterns of vegetation carbon density (Veg-C) (A) and soil organic carbon density (SOC) in the topsoil (0–20 cm) (B) in China’s terrestrial ecosystems. Minus (−) values represent a negative impact in structural equation modeling (SEM). Dotted lines represent correlation coefficients and solid lines represent direct path coefficients. MAT, mean annual temperature (°C); MAP, mean annual precipitation (mm). Clay, sand, soil K and soil N represent soil clay content (%), soil sand content (%), soil potassium content (%), and soil nitrogen content (%), respectively. (**P < 0.01).
Discussion
The present study estimated C storage in China’s terrestrial ecosystems as 99.15 ± 8.71 Pg C (Fig. 1; Fig. 2). Our estimate is similar to that obtained by Li et al. (2004), but lower than that obtained by Fang et al.57, Peng and Apps11, and Ni18,19 (Table 1). Differences in vegetation and soil datasets appear to be the main factors explaining variation in the C density of China’s terrestrial ecosystems (10.64–20.95 kg C m−2; Table 1). Most previous studies at a national scale used national inventory (forest and grassland) data and remote sensing data to estimate Veg-C storage12,21,27,34, and used Second National Soil Survey (1979–1985) data to calculate SOC storage26,32,40,41. In contrast, we collected a large amount of field-measured data for Veg-C and SOC (2004–2014). Compared with previous studies, our datasets contain the most recent and comprehensive information, facilitating more accurate estimates.
Differences in the methods used to estimate C storage values might partly contribute to the large uncertainty that exists at large scales28,58. Most previous studies calculated Veg-C storage and SOC storage based on ecosystem type, vegetation type, or soil type, separately6,25,26,41. In particular, the current study incorporated information on climate, vegetation, and land use. Thus, our results provide the first estimate of Veg-C and SOC storage in each region for each ecosystem type, which was then summed up to the national scale to generate more accurate estimates. Furthermore, different key parameters selected for evaluation (e.g., plant C content, soil bulk density, soil depth, and areas) might also cause large uncertainties in C storage estimates47,49,50,58. Our estimates of SOC storage were lower than those obtained by Fang et al.38 and higher than those obtained by Pan39, but were similar to those obtained by other studies12,26,32,40,42,45. Of note, vegetation in cropland and litter was excluded from this analysis, but was previously reported as 2.00 Pg C43 and 0.52 Pg C59, respectively, for China. To some extent, the different sampling time might lead to uncertainties in estimation accuracy. In future, we need to take the sampling time into consideration, in parallel to improving the precision of C estimation by developing observation techniques and increasing observation frequency and parameters (e.g., soil bulk density, soil gravel content). Therefore, field investigations in the northwest regions need to be strengthened, because fewer samples have been collected in these regions.
For forest ecosystems, Veg-C storage (11.49 ± 3.18 Pg C) estimates were higher in this study compared to those obtained by Zhou et al.21 (6.20 Pg C), Xu et al.27 (5.51 Pg C), and Li et al.16 (7.81 Pg C), which were calculated based on previous national forest inventory data. Our estimates of SOC storage (22.59 ± 4.40 Pg C) were also higher than those obtained in most previous studies. The higher estimates obtained here might be due to the implementation of key ecological restoration projects (e.g., Three-North Shelter Forest Program 4th Phase, Yangtze River Shelter Forest Project and Zhujiang River Shelter Forest Project 2nd Phase, Natural Forest Protection Project), which have contributed to C sequestration in the vegetation and soil in recent decades3,60,61. For grassland ecosystems, Veg-C and SOC storage were 1.94 ± 0.55 and 23.75 ± 4.68 Pg C, with an average density of 0.69 ± 0.20 and 8.47 ± 1.67 kg C m−2, respectively. Although our estimates of Veg-C density in grassland ecosystems were similar to those of previous studies, a large difference in C storage was detected, mainly due to the large difference in the surface area covered by this system14,35. For cropland ecosystems, SOC density in the 0–100 cm soil layer (8.85 ± 1.17 kg C m−2) was lower than average SOC density for China (9.13 ± 0.87 kg C m−2). This difference might be explained by the influence of intensive and long-term agricultural activity in China28,41. Of note, there are limited field data for shrub ecosystems; thus, the estimates of Veg-C and SOC storage in shrub ecosystems have high uncertainty.
Both GLM analysis and path analysis showed that climate, soil nutrients, and soil texture significantly influenced the spatial pattern of Veg-C and SOC density in China’s terrestrial ecosystems, with climate being the most important factor. Interestingly, we found that climate influenced the spatial pattern of Veg-C and SOC density through different processes and approaches. Specifically, MAP was the most important factor explaining the spatial pattern of Veg-C density, solely explaining 45.21% (GLM analysis) or 62% (path coefficient, path analysis) of variation. In contrast, MAT only explained 5.28% (GLM analysis) or 26% (path coefficient, path analysis) of variation for this parameter (Table 4 and Fig. 2). Some studies have reported that MAT and MAP affect net primary productivity and the spatial distribution of vegetation through direct and indirect impacts on water demand, water balance, and vegetation photosynthesis53,62–64. At regional and global scales, MAP has a more significant influence on the net primary productivity of vegetation than MAT64,65. The spatial patterns of Veg-C density in China are roughly consistent with China’s precipitation patterns. Higher precipitation leads to an increase in vegetation productivity and, thus, an increase in Veg-C density. This phenomenon might partially explain why Veg-C density is higher in cold humid regions (R1) and temperate humid regions (R2) than in some warmer regions of China, such as warm temperate arid regions (R6) and north subtropical humid regions (R14). Therefore, it is necessary for policy- makers in China to consider which climate factors influence Veg-C when they designate locations and select of tree or grass species for reforestation and returning croplands to forest and grassland in future ventures. Areas with high Veg-C should be protected and maintained (e.g., cold humid regions (R1), temperate humid regions (R2), south subtropical humid regions (R17), and tropical humid regions (R18)), whereas areas where Veg-C is likely to increase should be selected for reforestation or protection.
Besides vegetation, MAT was the most important factor influencing the spatial patterns of SOC density for the topsoil (0–20 cm), whereas the contribution of MAP was relatively small. Several studies have demonstrated that climate exerts significant impacts on the spatial patterns of SOC density, reflecting the balance between SOM inputs from plant production and outputs through decomposition in soil47,49,52,53,66–70. In general, new SOM input to the soil mainly originates from litterfall and rhizodeposition, which tend to be positively related to vegetation productivity (influenced by MAT and MAP, collectively), whereas SOM decomposition is mainly controlled by temperature and soil moisture52,53,68,69, with the influence of temperature on SOM decomposition being more obvious53,71. In brief, SOC density in the topsoil (0–20 cm) reflects the stronger effect of MAT on SOM decomposition, with SOC density increasing from tropical to cold temperate zones. However, for the 0–100 cm soil layer, MAT has a relatively small influence on the spatial pattern of SOC, because soil condition is relatively stable at this range (0–100 cm), and MAT impacts SOC decomposition less with increasing soil depth49. These findings indicate that areas with higher SOM input and relatively lower SOM decomposition accumulate more SOC. Such areas should be prioritized for protection. Meanwhile, we should keep eyes on the dynamics change of SOC storage, especially for the region with high SOC density but being under threats, such as land use change (a conversion from forest or grassland to cropland), deforestation, and overgrazing. Furthermore, many studies have also showed that soil in cold regions is more sensitive to temperature71; thus, policy- makers in China should strengthen land management (e.g., land use, fertilization) in areas with relatively low-temperature to mitigate the negative influence of climate change.
As expected, climate, soil nutrients, and texture significantly influenced the spatial distribution of ecosystem C density (Veg-C + SOC), with climate being the most important factor. However, climate (MAT + MAP) appeared to have a weaker capacity to explain the observed spatial distribution (Table 4). Thus, policy-makers should focus on understanding how climate factors influence ecosystem C density (Veg-C + Soil-C) to increase C storage in terrestrial ecosystems through rational ecological restoration projects (e.g., reforestation, returning croplands to forest and grassland) and land management policy. Areas with high ecosystem C density should be treated as key protection regions. In comparison, areas with relative low Veg-C density but high SOC density (e.g., Qinghai-Tibet plateau temperate semi-arid regions (R11) and Qinghai-Tibet plateau subfrigid semi-humid regions (R13)), require reasonable land use management and vegetation protection measures to maintain the current status and to increase Veg-C and SOC storage.
Our findings provide a more robust estimate of ecosystem C storage, and reveal the causes underlying the spatial patterns of Veg-C and SOC density in terrestrial ecosystems. We explored how climate influences Veg-C density and SOC density at a national scale; however, the specific processes and mechanisms involved remain unclear at the large scale. To improve terrestrial C sequestration, future studies should focus on how climate (MAT vs. MAP) differentially affects Veg-C density and SOC density. In practice, policy- makers in China should implement ecological restoration projects and more rational land management in relation to the climate to maximize the potential capacity of China’s terrestrial ecosystems to offset anthropogenic CO2 emissions in the future.
Materials and Methods
Data sources
Data collection and compilation
We collected information on vegetation and soil through two approaches: (1) field-measured results from papers publicly published from 2004 to 2014 in the China National Knowledge Infrastructure (CNKI) (http://www.cnki.net) and Institute for Scientific Information (ISI) (http://apps.webofknowledge.com) databases (Supplementary Appx. S1–S5), using “SOC”, “biomass”, “C density” or “C storage” as key words; and (2) unpublished field-measured data obtained by personal correspondence (Supplementary Appx. S6–S9). The collected papers were further screened based on the following criteria: (1) data on biomass/biomass C density and SOC content/concentration should be obtained through field investigations; (2) field investigations should have been performed after 2000; and (3) biomass and SOC determination methods should be comparable. A total of 1036 papers were selected. The collected data encompassed the main ecosystems in China, including forest, grassland, cropland, wetland, and shrub ecosystems (Supplementary Appx. S1–S5). Specifically, the collected data included records for 7927 vegetation samples (4485 samples for above-ground biomass (AGB) and 3442 samples for below-ground biomass (BGB)) and 7683 soil samples (4536 samples for the 0–20 cm soil layer, and 3147 samples for the 0–100 cm soil layer; Fig. 3). Vegetation C storage in croplands was not considered in this study owing to periodic harvests.
Figure 3.

Regional division of China’s terrestrial ecosystems (A) and the distribution of sampling plots for vegetation (B, C) and soil samples (D, E). R1, Cold humid regions; R2, Temperate humid regions; R3, Temperate semi-humid regions; R4, Temperate semi-arid regions; R5, Temperate arid regions; R6, Warm temperate arid regions; R7, Qinghai-Tibet plateau frigid arid regions; R8, Warm temperate semi-humid regions; R9, Warm temperate humid regions; R10, Qinghai-Tibet plateau temperate arid regions; R11, Qinghai-Tibet plateau temperate semi-arid regions; R12, Qinghai-Tibet plateau subfrigid semi-arid regions; R13, Qinghai-Tibet plateau subfrigid semi-humid regions; R14, North subtropical humid regions; R15, Qinghai-Tibet plateau temperate humid and semi-humid regions; R16, Mid-subtropical humid regions; R17, South subtropical humid regions; R18, Tropical humid regions. AGBC, Above-ground biomass carbon; BGBC, Below-ground biomass carbon; SOC, soil organic carbon. The figure was generated using ArcGIS software (version 10.0, ESRI, USA).
For vegetation and soil samples that had no detailed geographical information, we extracted their latitude and longitude with a digital map (http://map.tianditu.com), based on the description of the study site. Reported field measurements of above-ground biomass C (AGBC) and below-ground biomass C (BGBC) density were used directly. For samples that were reported only as vegetation biomass (AGB or BGB), a coefficient of 0.45 was used to convert vegetation biomass density to C density (kg C m−2)57. When SOC density (kg C m−2) was not reported in the original studies, it was calculated using Eq. 1:
| 1 |
where SOCi, BDi, Di, and δi represented SOC content (%), bulk density (g cm−3), soil depth (cm), and the volumetric percentage of the fraction >2 mm (%), respectively, in soil layer i; and n was the number of soil layers. SOM was converted to SOC using a constant of 0.5826. A classic pedotransfer function was used to estimate bulk density from SOC concentration, when records were not available28. To validate the prediction accuracy of the pedotransfer function, soil samples with the data of bulk density and SOC content were used to calculate the observed SOC density and the predicted SOC density. Then, these data were taken a logarithmic transformation to reduce the impact of a few high-value data, and compared by the 1:1 relationship, mean error (ME), and root mean square error (RMSE)72,73. The result showed that the pedotransfer function can well predict SOC density, with the ME and RMSE equal to −0.03 and 0.11 kg C m−2 for 0–20 cm soil layer (R2 = 0.92), and −0.03 and 0.09 kg C m−2 for 0–100 cm soil layer (R2 = 0.93), respectively (Fig. 4). In this study, the volumetric percentage of the fraction > 2 mm (δi,%) was 0 for soil for which bulk density records were available. For soil with no records of rock fragment and bulk density, the mean value of the rock fragment volume was used to substitute the same soil type.
Figure 4.

Comparison between observed and predicted soil organic carbon (SOC) density (kg C m−2) by pedotransfer function. These data of observed SOC density and predicted SOC density were taken a logarithmic transformation to reduce the impact of a few high-value data. SOCobs (kg C m−2) represented the observed SOC density, SOCpre (kg C m−2) represented the observed SOC density, ME represented mean error, and RMSE represented root mean square error.
Division of ecological regions
China spans a huge geographic and environmental range, extending from tropical to boreal zones, from rain forests to desert74. Considering China’s broad environmental gradients and highly heterogeneous topography, China’s terrestrial ecosystems were divided into 18 zones based on climate and topography75 to investigate differences in C storage among different regions. The zones were designated as follows: cold humid regions (R1), temperate humid regions (R2), temperate semi-humid regions(R3), temperate semi-arid regions (R4), temperate arid regions (R5), warm temperate arid regions (R6), Qinghai-Tibet plateau frigid arid regions (R7), warm temperate semi-humid regions (R8), warm temperate humid regions (R9), Qinghai-Tibet plateau temperate arid regions (R10), Qinghai-Tibet plateau temperate semi-arid regions (R11), Qinghai-Tibet plateau subfrigid semi-arid regions (R12), Qinghai-Tibet plateau subfrigid semi-humid regions (R13), north subtropical humid regions (R14), Qinghai-Tibet plateau temperate humid and semi-humid regions (R15), mid-subtropical humid regions (R16), south subtropical humid regions (R17), and tropical humid regions (R18) (Fig. 3).
Data on climate and soil properties
Based on long-term temperature and precipitation monitoring data (1961–2010) from 722 meteorological stations in China, we obtained the mean annual temperature (MAT, °C) and mean annual precipitation (MAP, mm) for each region76. The Second National Soil Survey in China was used to provide data on soil nitrogen (Soil N, %), phosphorus (Soil P, %), and potassium (Soil K, %) content, which represent soil nutrients, and the proportion of soil clay (%), silt (%), and sand (%), which represent soil texture. The spatial resolution of the Second National Soil Survey is 10 km × 10 km. Areas of different ecosystems (forest, grassland, cropland, shrub, wetland, and others) for each region were extracted from the Chinese land cover data (2010)77. The area of terrestrial ecosystems in China, except for Taiwan Province and inland waters, covered approximately 9.25 × 10⁶ km2.
Calculating vegetation and soil C storage at different scales
Two steps were used to estimate C storage in China’s terrestrial ecosystems (see Supplementary Fig. S1 for details). The first step was from point scale to regional scale, and the second was from regional scale to national scale. For the first step, we estimated the Veg-C (AGBC and BGBC) and SOC density and storage of different ecosystems in each ecological region. Then, we used the Veg-C and SOC storage of different ecosystems in an ecological region to estimate the C storage in each region. For ecological regions where the sample number of one ecosystem was less than 10, or the spatial distribution of samples was extremely uneven (i.e., samples were concentrated in a single area), we combined the samples of the same ecosystem in adjacent regions with similar climatic conditions to estimate C density.
For the second step, we used the Veg-C and SOC storage of different ecological regions to estimate C storage at the national scale. The C storage of vegetation, soil, and terrestrial ecosystems (vegetation + soil) in China was calculated as:
| 2 |
| 3 |
| 4 |
where m and n are the number of ecological regions and ecosystems. AGBCDij, BGBCDij, and SOCDij are AGBC density, BGBC density, and SOC density of ecosystem j in ecological region i, respectively. Sij is the surface area of ecosystem j in ecological region i. Veg-CSi and SOCSi are C storage in the vegetation and soil of region i, respectively. For the purposes of this study, we estimated SOC storage at two soil depths (0–20 cm and 0–100 cm). SOC storage at the 0–100 cm soil depth was used to calculate C storage in terrestrial ecosystems, whereas SOC storage at 0–20 cm was used to characterize C storage in the surface soil.
Statistical analysis
A general linear model (GLM) was used to assess variation in AGBC, BGBC, Veg-C (AGBC + BGBC), SOC (0–20 cm and 0–100 cm soil layers), and the ecosystem (Veg-C + SOC) explained by climate (MAT and MAP), soil nutrient (soil N, P, and K), and soil texture (clay, silt, and sand). Path analysis was used to investigate the main factors influencing the spatial patterns of Veg-C and SOC (0–20 cm soil layer) quantitatively. For Veg-C storage, the analyzed factors included climate (MAT and MAP), soil nutrient (soil N, P, and K), and soil texture (clay, silt, and sand); for SOC storage, the analyzed factors included SOM input (Veg-C), climate (MAT and MAP) and soil properties (clay, silt, and sand, soil N, P, and K). Because some predictors are correlated, we used path analysis to determine significant direct predictors for Veg-C and SOC, as well as indirect pathways. The initial models of path analysis for Veg-C and SOC density were fully identified, including all possible causal links between observed predictors (e.g., MAT and MAP) and response variables (e.g., soil N, K), and all correlations among predictors. These models provided estimates and significance tests for all potential paths among variables. We trimmed the initial models by retaining significant direct predictor variables. The fitted significance and goodness of the trimmed models were assessed with the following indices: χ2 test, Bentler’s comparative fit index (CFI) (>0.95), and the standardized root mean residual (<0.08)53,78,79. We built path diagrams using standardized path coefficients between the predictors and response variables, and correlation coefficients between predictors. The GLM analysis was conducted using the lm function in the R package (R project 3.1.2, R development team, 2014). Path analysis was performed by SPSS software (version 18.0, Chicago, IL, USA) (Supplementary Appx. S10). Significant differences were defined at the p = 0.05 level.
Electronic supplementary material
Acknowledgements
We appreciated the data share from National Data Sharing Infrastructure of Earth System Science (http://www.geodata.cn/) and (http://www.cnern.org/). This work was supported by the National K&R Program of China [2017YFA0604803], National Natural Science Foundation of China [31290221, 41571130043], the Chinese Academy of Sciences Strategic Priority Research Program [XDA05050702], and the Program of Youth Innovation Promotion Association Chinese Academy of Sciences. We thank some researchers to provide the unpublished data (Quansheng Chen, Nianpeng He, Mei Huang, Zhongmin Hu, Jie Li, Qiufeng Wang, Changhui Wang, and Jingyue Xue), and thank our colleagues and graduate students for the help of data collection. Supporting data are included in Supplementary Appx. S1~S9; more information should contact N. P. He (henp@igsnrr.ac.cn).
Author Contributions
L.X., G.R.Y. and N.P.H. analyzed data and wrote the manuscript text, D.W. created the Figures 3 and S2, Q.F.W. and Y.G. provided supported on statistic method, and S.G.L., S.L.N. and J.P.G. designed the study. All authors reviewed the manuscript.
Competing Interests
The authors declare no competing interests.
Footnotes
Electronic supplementary material
Supplementary information accompanies this paper at 10.1038/s41598-018-20764-9.
Publisher's note: Springer Nature remains neutral with regard to jurisdictional claims in published maps and institutional affiliations.
Contributor Information
Guirui Yu, Email: yugr@igsnrr.ac.cn.
Nianpeng He, Email: henp@igsnrr.ac.cn.
References
- 1.Houghton R, Davidson E, Woodwell G. Missing sinks, feedbacks, and understanding the role of terrestrial ecosystems in the global carbon balance. Global Biogeochem. Cycles. 1998;12:25–34. doi: 10.1029/97GB02729. [DOI] [Google Scholar]
- 2.Heimann M, Reichstein M. Terrestrial ecosystem carbon dynamics and climate feedbacks. Nature. 2008;451:289–292. doi: 10.1038/nature06591. [DOI] [PubMed] [Google Scholar]
- 3.Piao S, et al. The carbon balance of terrestrial ecosystems in China. Nature. 2009;458:1009–1013. doi: 10.1038/nature07944. [DOI] [PubMed] [Google Scholar]
- 4.Canadell, J. G. et al. Saturation of the terrestrial carbon sink. Springer Berlin Heidelberg, 59–78 (2007).
- 5.Le Quéré C, et al. Global carbon budget 2013, Earth Syst. Sci. Data. 2014;6:235–263. [Google Scholar]
- 6.Fang J, Guo Z, Piao S, Chen A. Terrestrial vegetation carbon sinks in China, 1981–2000. Sci. China D. 2007;50:1341–1350. doi: 10.1007/s11430-007-0049-1. [DOI] [Google Scholar]
- 7.Pan Y, et al. A Large and Persistent Carbon Sink in the World’s Forests. Science. 2011;333:988–993. doi: 10.1126/science.1201609. [DOI] [PubMed] [Google Scholar]
- 8.Levine MD, Aderi NT. Global carbon emissions in the coming decades: The case of China. Annu. Rev. Env. Resour. 2008;33:19–38. doi: 10.1146/annurev.environ.33.012507.172124. [DOI] [Google Scholar]
- 9.Tian H, et al. China’s terrestrial carbon balance: contributions from multiple global change factors. Global Biogeochem. Cycles. 2011;25:GB1007. doi: 10.1029/2010GB003838. [DOI] [Google Scholar]
- 10.Fang, J. Y., Liu, G. H. & Xu, S. L. Carbon reservoir of terrestrial ecosystem in China. China Environmental Sciences Publishing House, 109–128 (1996).
- 11.Peng C, Apps MJ. Contribution of China to the global carbon cycle since the last glacial maximum - reconstruction from palaeovegetation maps and an empirical biosphere model. Tellus B. 1997;49:393–408. doi: 10.3402/tellusb.v49i4.15977. [DOI] [Google Scholar]
- 12.Li K, Wang S, Cao M. Vegetation and soil carbon storage in China. Sci. China. 2004;47:49–57. [Google Scholar]
- 13.Fang J, Chen A, Peng C, Zhao S, Ci L. Changes in forest biomass carbon storage in China between 1949 and 1998. Science. 2001;292:2320–2322. doi: 10.1126/science.1058629. [DOI] [PubMed] [Google Scholar]
- 14.Ni J. Carbon storage in grasslands of China. J. Arid Environ. 2002;50:205–218. doi: 10.1006/jare.2001.0902. [DOI] [Google Scholar]
- 15.Hu HF, Wang ZH, Liu GH, Fu BJ. Vegetation carbon storage of major shrublands in China. Chin. J. Ecol. 2006;30:539–544. [Google Scholar]
- 16.Li HK, Lei YC, Zeng WS. Forest carbon storage in China estimated using forestry inventory data. Scientia Silvae Sinicae. 2011;47:7–12. [Google Scholar]
- 17.Zheng Y, Niu Z, Gong P, Dai Y, Shangguan W. Preliminary estimation of the organic carbon pool in China’s wetlands. Chin. Sci. Bull. 2013;58:662–670. doi: 10.1007/s11434-012-5529-9. [DOI] [Google Scholar]
- 18.Ni J. Carbon storage in terrestrial ecosystems of China: estimates at different spatial resolutions and their responses to climate change. Clim. Change. 2001;49:339–358. doi: 10.1023/A:1010728609701. [DOI] [Google Scholar]
- 19.Ni J. Carbon storage in Chinese terrestrial ecosystems: approaching a more accurate estimate. Clim. Change. 2013;119:905–917. doi: 10.1007/s10584-013-0767-7. [DOI] [Google Scholar]
- 20.Liu GH, Fu BJ, Fang JY. Carbon dynamics of Chinese forests and its contribution to global carbon balance. Acta Ecol. Sin. 2000;20:733–740. [Google Scholar]
- 21.Zhou YR, Yu ZL, Zhao SD. Carbon storage and budget of major Chinese forest types. Chin. J. Ecol. 2000;24:518–522. [Google Scholar]
- 22.Pan Y, Luo T, Birdsey R, Hom J, Melillo J. New estimates of carbon storage and sequestration in China’s forests: effects of age-class and method on inventory-based carbon estimation. Clim. Change. 2004;67:211–236. doi: 10.1007/s10584-004-2799-5. [DOI] [Google Scholar]
- 23.Xie XL, Sun B, Zhou HZ, Li ZP. Soil carbon stocks and their influencing factors under native vegetations in China. Acta Pedologica Sin. 2004;41:687–699. [Google Scholar]
- 24.Zhao M, Zhou G. Carbon storage of forest vegetation and its relationship with climatic factors. Scientia Geogr. Sin. 2004;24:50–54. [Google Scholar]
- 25.Piao S, et al. Changes in vegetation net primary productivity from 1982 to 1999 in China. Global Biogeochem. Cycles. 2005;19:GB2027. doi: 10.1029/2004GB002274. [DOI] [Google Scholar]
- 26.Xie ZB, et al. Soil organic carbon stocks in China and changes from 1980s to 2000s. Global Change Biol. 2007;13:1989–2007. doi: 10.1111/j.1365-2486.2007.01409.x. [DOI] [Google Scholar]
- 27.Xu XL, Cao MK, Li KR. Temporal-Spatial dynamics of carbon storage of forest vegetation in China. Progress Geogr. 2007;26:1–10. [Google Scholar]
- 28.Yang YH, Mohammat A, Feng JM, Zhou R, Fang JY. Storage, patterns and environmental controls of soil organic carbon in China. Biogeochemistry. 2007;84:131–141. doi: 10.1007/s10533-007-9109-z. [DOI] [Google Scholar]
- 29.Wu QB, et al. Carbon sequestration and its potential by forest ecosystems in China. Acta Ecol. Sin. 2008;28:517–524. [Google Scholar]
- 30.Zhang C, et al. China’s forest biomass carbon sink based on seven inventories from 1973 to 2008. Clim. Change. 2013;118:933–948. doi: 10.1007/s10584-012-0666-3. [DOI] [Google Scholar]
- 31.Zhao M, Yue T, Zhao N, Sun X, Zhang X. Combining LPJ-GUESS and HASM to simulate the spatial distribution of forest vegetation carbon stock in China. J. Geogr. Sci. 2014;24:249–268. doi: 10.1007/s11442-014-1086-2. [DOI] [Google Scholar]
- 32.Xu L, et al. Differences in pedotransfer functions of bulk density lead to high uncertainty in soil organic carbon estimation at regional scales: Evidence from Chinese terrestrial ecosystems. J Geophys. Res: Biogeosciences. 2015;120:1567–1575. doi: 10.1002/2015JG002929. [DOI] [Google Scholar]
- 33.Piao SL, Fang JY, He JS, Xiao Y. Spatial distribution of grassland biomass in China. Chin. J. Ecol. 2004;28(4):491–498. [Google Scholar]
- 34.Piao S, Fang J, Zhou L, Tan K, Tao S. Changes in biomass carbon stocks in China’s grasslands between 1982 and 1999. Global Biogeochem. Cycles. 2007;21:GB2002. [Google Scholar]
- 35.Fan JW, et al. Carbon storage in the grasslands of China based on field measurements of above- and below-ground biomass. Clim. Change. 2008;86:375–396. doi: 10.1007/s10584-007-9316-6. [DOI] [Google Scholar]
- 36.Fang J, Yang Y, Ma W, Mohammat A, Shen H. Ecosystem carbon stocks and their changes in China’s grasslands. Sci. China. 2010;53:757–765. doi: 10.1007/s11427-010-4029-x. [DOI] [PubMed] [Google Scholar]
- 37.Ma A, He N, Yu G, Wen D, Peng S. Carbon storage in Chinese grassland ecosystems: Influence of different integrative methods. Sci. Rep. 2016;6:srep21378. doi: 10.1038/srep21378. [DOI] [PMC free article] [PubMed] [Google Scholar]
- 38.Fang JY, Liu GH, Xu SL. Soil carbon pool in China and its global significance. J. Environ. Sci. 1996;8:249–254. [Google Scholar]
- 39.Pan GX. Study on carbon reservoir in soils of China. Bull. Sci. Technol. 1999;15:330–332. [Google Scholar]
- 40.Wang SQ, Zhou CH, Li KR, Zhu SL, Huang FH. Analysis on spatial distribution characteristics of soil organic carbon reservoir in China. Acta Geogr. Sin. 2000;55:533–544. [Google Scholar]
- 41.Wu H, Guo Z, Peng C. Distribution and storage of soil organic carbon in China. Global Biogeochem. Cycles. 2003;17:1048. [Google Scholar]
- 42.Yu D, et al. National scale analysis of soil organic carbon storage in china based on Chinese soil taxonomy. Pedosphere. 2007;17:11–18. doi: 10.1016/S1002-0160(07)60002-2. [DOI] [Google Scholar]
- 43.Yu GR, Li XR, Wang QF, Li SG. Carbon storage and its spatial pattern of terrestrial ecosystem in China. J. Res. Ecol. 2010;1:97–109. [Google Scholar]
- 44.Lu D. The potential and challenge of remote sensing-based biomass estimation. Int. J Remote Sens. 2006;27:1297–1328. doi: 10.1080/01431160500486732. [DOI] [Google Scholar]
- 45.Wang S, et al. Vertical distribution of soil organic carbon in China. Environ. Manage. 2004;33:S200–S209. doi: 10.1007/s00267-003-9130-5. [DOI] [Google Scholar]
- 46.Wang S, Zhou C, Luo C. Studying carbon storage spatial distribution of terrestrial natural vegetation in China. Progress Geogr. 1999;18:238–244. [Google Scholar]
- 47.Post WM, Emanuel WR, Zinke PJ, Stangenberger AG. Soil carbon pools and world life zones. Nature. 1982;298:156–159. doi: 10.1038/298156a0. [DOI] [Google Scholar]
- 48.Cao MK, Woodward FI. Net primary and ecosystem production and carbon stocks of terrestrial ecosystems and their responses to climate change. Global Change Biol. 1998;4:185–198. doi: 10.1046/j.1365-2486.1998.00125.x. [DOI] [Google Scholar]
- 49.Jobbágy EG, Jackson RB. The vertical distribution of soil organic carbon and its relation to climate and vegetation. Ecol. Appl. 2000;10:423–436. doi: 10.1890/1051-0761(2000)010[0423:TVDOSO]2.0.CO;2. [DOI] [Google Scholar]
- 50.Wiesmeier M, et al. Soil organic carbon stocks in southeast Germany (Bavaria) as affected by land use, soil type and sampling depth. Global Change Biol. 2012;18:2233–2245. doi: 10.1111/j.1365-2486.2012.02699.x. [DOI] [Google Scholar]
- 51.Jenny, H. Factors of soil formation: a system of quantitative pedology. Courier Corporation, 1–21 (1994).
- 52.Liu Y, Yu G, Wang Q, Zhang Y. How temperature, precipitation and stand age control the biomass carbon density of global mature forests. Global Ecol. Biogeogr. 2014;23:323–333. doi: 10.1111/geb.12113. [DOI] [Google Scholar]
- 53.Wen D, He N. Forest carbon storage along the north-south transect of eastern China: Spatial patterns, allocation, and influencing factors. Ecol. Indic. 2016;61:960–967. doi: 10.1016/j.ecolind.2015.10.054. [DOI] [Google Scholar]
- 54.van Groenigen KJ, Qi X, Osenberg W, Luo Y, Hungate BA. Faster decomposition under increased atmospheric CO2 limits soil carbon storage. Science. 2014;344:508–509. doi: 10.1126/science.1249534. [DOI] [PubMed] [Google Scholar]
- 55.Jandl R, et al. How strongly can forest management influence soil carbon sequestration? Geoderma. 2007;137:253–268. doi: 10.1016/j.geoderma.2006.09.003. [DOI] [Google Scholar]
- 56.Davidson EA, Janssens IA. Temperature sensitivity of soil carbon decomposition and feedbacks to climate change. Nature. 2006;440:165–173. doi: 10.1038/nature04514. [DOI] [PubMed] [Google Scholar]
- 57.Fang, J. Y., Liu, G. H. & Xu, S. L. Carbon storage in terrestrial ecosystem of China. China Science and Technology Press, 251–277 (1996).
- 58.Wang SQ, Liu JY, Yu GR. Error analysis of estimating terrestrial soil organic carbon storage in China. Chin. J Appl. Ecol. 2003;14:797–802. [PubMed] [Google Scholar]
- 59.Wen D, He NP. Spatial patterns of litter density and their controlling factors in forests and grasslands of China. Acta Ecol. Sin. 2016;36:1–9. doi: 10.1016/j.chnaes.2015.12.003. [DOI] [Google Scholar]
- 60.Lu Y, et al. A policy-driven large scale ecological restoration: quantifying ecosystem services changes in the Loess Plateau of China. Plos One. 2012;7:e31782. doi: 10.1371/journal.pone.0031782. [DOI] [PMC free article] [PubMed] [Google Scholar]
- 61.Feng X, Fu B, Lu N, Zeng Y, Wu B. How ecological restoration alters ecosystem services: an analysis of carbon sequestration in China’s Loess Plateau. Sci. Rep. 2013;3:srep02846. doi: 10.1038/srep02846. [DOI] [PMC free article] [PubMed] [Google Scholar]
- 62.Lal R. Forest soils and carbon sequestration. Forest Ecol. Manag. 2005;220:242–258. doi: 10.1016/j.foreco.2005.08.015. [DOI] [Google Scholar]
- 63.Reichstein M, et al. Reduction of ecosystem productivity and respiration during the European summer 2003 climate anomaly: a joint flux tower, remote sensing and modelling analysis. Global Change Biol. 2007;13:634–651. doi: 10.1111/j.1365-2486.2006.01224.x. [DOI] [Google Scholar]
- 64.Luyssaert S, et al. CO2 balance of boreal, temperate, and tropical forests derived from a global database. Global Change Biol. 2007;13:2509–2537. doi: 10.1111/j.1365-2486.2007.01439.x. [DOI] [Google Scholar]
- 65.Knapp AK, Smith MD. Variation among biomes in temporal dynamics of aboveground primary production. Science. 2001;291:481–484. doi: 10.1126/science.291.5503.481. [DOI] [PubMed] [Google Scholar]
- 66.Wynn JG, et al. Continental-scale measurement of the soil organic carbon pool with climatic, edaphic, and biotic controls. Global Biogeochem. Cycles. 2006;20:GB1007. doi: 10.1029/2005GB002576. [DOI] [Google Scholar]
- 67.Schmidt MWI, et al. Persistence of soil organic matter as an ecosystem property. Nature. 2011;478:49–56. doi: 10.1038/nature10386. [DOI] [PubMed] [Google Scholar]
- 68.Davidson EA, Trumbore SE, Amundson R. Biogeochemistry - soil warming and organic carbon content. Nature. 2000;408:789–790. doi: 10.1038/35048672. [DOI] [PubMed] [Google Scholar]
- 69.Falloon P, Jones CD, Ades M, Paul K. Direct soil moisture controls of future global soil carbon changes: An important source of uncertainty. Global Biogeochem. Cycl. 2011;25:GB3010. doi: 10.1029/2010GB003938. [DOI] [Google Scholar]
- 70.Kirschbaum MUF. The temperature-dependence of soil organic-matter decomposition, and the effect of global warming on soil organic-C storage. Soil Biol. Biochem. 1995;27:753–760. doi: 10.1016/0038-0717(94)00242-S. [DOI] [Google Scholar]
- 71.Kirschbaum MUF. The temperature dependence of soil organic matter decomposition, and the effect of global warming on soil organic C storage. Soil Biol. biochem. 1995;27:753–760. doi: 10.1016/0038-0717(94)00242-S. [DOI] [Google Scholar]
- 72.Xu L, He NP, Yu GR. Methods pf evaluating soil bulk density: Impact on estimating large scale soil organic carbon storage. Catena. 2016;144:94–101. doi: 10.1016/j.catena.2016.05.001. [DOI] [Google Scholar]
- 73.Yang YH, et al. Increased topsoil carbon stock across China’s forest. Global Change Biol. 2014;20:2687–2696. doi: 10.1111/gcb.12536. [DOI] [PubMed] [Google Scholar]
- 74.Fang J, et al. Forest community survey and the structural characteristics of forests in China. Ecography. 2012;35:1059–1071. doi: 10.1111/j.1600-0587.2013.00161.x. [DOI] [Google Scholar]
- 75.Fu BJ, Liu GH, Ma KM, Li JR. Scheme of ecological regionalization in China. Acta Ecol. Sin. 2001;21:1–6. [Google Scholar]
- 76.Gao Y, et al. Spatio-temporal variation characteristics of surface net radiation in China over the past 50 years. J. Geo-Inform. Sci. 2013;1:1–10. doi: 10.3724/SP.J.1047.2013.00001. [DOI] [Google Scholar]
- 77.Wu BF, et al. Land cover changes of China from 2000 to 2010. Quaternary. Sciences. 2014;34:723–731. [Google Scholar]
- 78.Petraities PS, Dunham AE, Niewiarowski PH. Inferring multiple causality: the limitations of path analysis. Funct. Ecol. 1996;10:421–431. doi: 10.2307/2389934. [DOI] [Google Scholar]
- 79.Sackett TE, Smith SM, Basiliko N. Indirect and direct effects of exotic earthworms on soil nutrient and carbon pools in North American temperate forests. Soil Biol. Biochem. 2013;57:459–467. doi: 10.1016/j.soilbio.2012.08.015. [DOI] [Google Scholar]
Associated Data
This section collects any data citations, data availability statements, or supplementary materials included in this article.