Fig. 7.
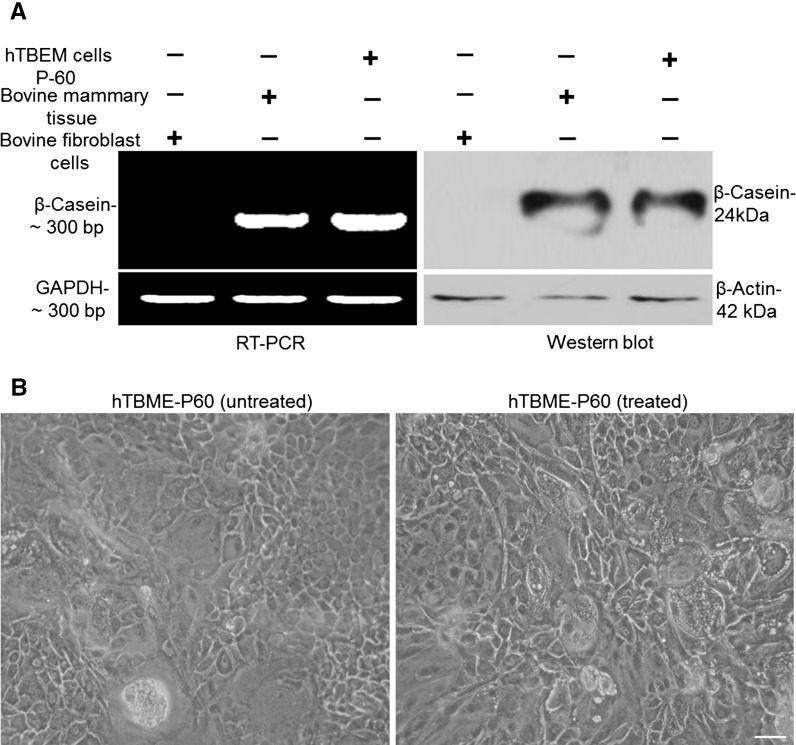
Analysis of β-Casein expression and dome formation in the established hTBME cell line. a RT-PCR and western blot were used to detect β-Casein expression. For RT-PCR (left) and western blot (right), hTBME at passage 60, bovine mammary tissues as a positive control and bovine fibroblast cells as a negative control were used. Loading control represents the GAPDH and β-actin in RT-PCR and western blot, respectively. Results are representative of three independent experiments. b Phase contrast image of dome structure in the hTBME cell line treated with hydrocortisone, 5 µg/mL insulin, and prolactin (right) and the non-treated hTBME cell line (left). Magnification: ×20, scale bar = 20 µm

