Abstract
In this study, the cellular viability and function of immortalized human cervical and dermal cells are monitored and compared in conventional 2D and two commercial 3D membranes, Collagen and Geltrex, of varying working concentration and volume. Viability was monitored with the aid of the Alamar Blue assay, cellular morphology was monitored with confocal microscopy, and cell cycle studies and cell death mechanism studies were performed with flow cytometry. The viability studies showed apparent differences between the 2D and 3D culture systems, the differences attributed in part to the physical transition from 2D to 3D environment causing alterations to effective resazurin concentration, uptake and conversion rates, which was dependent on exposure time, but also due to the effect of the membrane itself on cellular function. These effects were verified by flow cytometry, in which no significant differences in viable cell numbers between 2D and 3D systems were observed after 24 h culture. The results showed the observed effect was different after shorter exposure periods, was also dependent on working concentration of the 3D system and could be mediated by altering the culture vessel size. Cell cycle analysis revealed cellular function could be altered by growth on the 3D substrates and the alterations were noted to be dependent on 3D membrane concentration. The use of 3D culture matrices has been widely interpreted to result in “improved viability levels” or “reduced” toxicity or cellular “resistance” compared to cells cultured on traditional 2D systems. The results of this study show that cellular health and viability levels are not altered by culture in 3D environments, but their normal cycle can be altered as indicated in the cell cycle studies performed and such variations must be accounted for in studies employing 3D membranes for in vitro cellular screening.
Keywords: Collagen I, Geltrex®, 3D matrices, Confocal microscopy, In vitro screening
Introduction
Traditionally, 2D monolayer cultures have been favoured as in vitro models for cellular research, due to the ease and convenience of set up with little loss of cellular viability. Typically, 2D substrates used in vitro are made from polystyrene or glass, and support cell growth to form a flat, two-dimensional cellular layer (Freshney 2005). Although such 2D cultures have significantly contributed to the understanding of basic cellular biology, they have limitations (Lee et al. 2008). 2D based growth substrates lack the structural architecture and stroma (Drife 1986) present in vivo and not all types of epithelial cells can adhere and grow well on the artificial substrates (Kim 2005), limiting the uses of standard in vitro techniques. In vivo animal models are faced with a considerable higher level of ethical issues, stringent regulation control and these models are expensive and can result in lengthy experimental timeframes (Antoni et al. 2015). Critically, the use of in vitro alternatives to animal models is increasingly encouraged by both EU and US regulatory bodies (EU Directive-2010/63/EU and US Public Law 106-545, 2010, 106th Congress) (European Union 2010; United States, 2000). To bridge the gap between in vitro and in vivo models and to improve the relevance of in vitro models, 3D culture models are being increasingly developed. 3D cell culture has the architectural structure to mimic the in vivo extra cellular matrix (ECM) and aims to produce cultures which possess the phenotype and functional characteristics of their in vivo counterparts, resulting in a more realistic biological response in vitro (Padmalayam and Suto 2012). In cancer research, 3D cultures have found favour as they are thought to mimic events occurring in vivo during progression and formation of cancer (Kim 2005). Currently there is a large variety of 3D culture systems on the market (Rimann and Graf-Hausner 2012), ranging from scaffolds, including, animal-derived (Matrigel®, Collagen) or plant-derived (QGel® Matrix, 3-D Life Biomimetic, Puramatrix), scaffold-free, including low adhesion plates, micropatterened surfaces, hanging drop, suspension using methyl cellulose, rolling vessel or magnetic levitation (Riss 2014). Scaffold based systems are a 3D construct which provides an ECM that supports cell growth and differentiation (Hutmacher 2000). In scaffolds, cells can migrate between fibres and attach to them (Breslin and O’Driscoll 2013). Scaffolds are typically produced from natural materials such as Collagen, fibronectin, agarose, laminin and gelatin (Ravi et al. 2015) or synthetic polymers like poly (ethylene oxide) (PED) and poly (ethylene glycol) (PEG) (Place et al. 2009). Hydrogels are 3D matrices or porous scaffolds consisting of hydrophilic polymers (Annabi et al. 2014). Physically, the hydrogels are weak, but they provide a biomimetic environment to assist cell differentiation and proliferation (Peck and Wang 2013). Examples of hydrogels are Matrigel, Myogel and Collagen I matrices (Worthington et al. 2015). Decellularised tissue membranes are prepared by decellularising tissue by a combination of physical, chemical and enzymatic reactions, whereupon cells can be grown successfully for tissue engineering applications (Gilbert et al. 2006). Cell-derived matrices (CDM) are formed by cells cultured on a biomaterial surface at high density in vitro for sufficient time so that the cells produce their own ECM, whereupon the cells are removed, leaving only ECM that closely mimics native molecular content and stromal fibre (Kutys et al. 2013).
Basement membrane extract and Collagen are the most common types of ECM used (Antoni et al. 2015), and two commercial examples of this type of membrane are used in this study, namely Rat Tail derived Collagen I, and Geltrex. These two membranes have been employed as substrates for 3D cell culture and the cell viability and function have been monitored, and compared to conventional 2D cultures, to determine which basement supports growth with least impact on cell function. To further monitor the effect of these membranes and their potential for more relevant in vitro screening, a normal and cancer cell lines were chosen for growth on both basement membranes, and for consistency with previous studies (Bonnier et al. 2015; Casey et al. 2016).
Materials and methods
Materials
Cell culture media, all supplements, foetal bovine serum, l-glutamine, ampicillin, streptomycin, trypsin and Propidium Iodide (PI) were purchased from Sigma Aldrich Ltd (Arklow, Co. Wicklow, Ireland). Geltrex® hESC-qualified Ready-To-Use Reduced Growth Factor Basement Membrane Matrix. Catalogue Number A1569601 and LOT Number 1851583—Collagen I Rat-Tail (Gibco), YOPRO 1 stain (Gibco™) and Alamar Blue™ (AB) and the NucRed® Live 647 ReadyProbes® were purchased from Biosciences (Dublin, Ireland).
Cell culture
HeLa cells (human cervical cancer; ATCC CCL-2; purchased from ATCC (Manassas, VA, USA)) and HaCaT cells (human dermal keratinocyte; purchased from the Leibnitz Istitute DSMZ—German Collection of Microorganisms and Cell Cultures), were both adapted to culture in Dulbecco’s Modified Eagle Medium: Nutrient Mixture F-12 (DMEM/F12) medium supplemented with 10% foetal bovine serum, 1% l-glutamine and penicillin and streptomycin (Mukherjee et al. 2011; Casey et al. 2016; Cody et al. 2013; Herzog et al. 2007), under standard conditions of 5% CO2 at 37 °C and humidity of 95%. Cells were cultured until they reached approximately 80% confluence. Cells were harvested by trypsin detachment and seeded at a density of 1 × 10⁵ cells per well (1 ml) in 6 well plates and 2 × 10⁴ cells per well (1 ml) in 24 well plates. All experiments were performed in triplicate and incubated for 24, 48 and 72 h prior to measuring cell viability.
Collagen substrate preparation
Collagen I Rat Tail (Gibco) was used for a preparation of the Collagen gel; 3 mg/ml sterile solution was mixed with sterile 1 M sodium hydroxide (1 M NaOH), Phosphate Buffered Saline × 10 (PBS10×) and sterile distilled water. Three different Collagen based substrates were produced and tested by varying the concentration of the Collagen content in the gel to 2.5, 2 and 1.5 mg/ml, respectively. Each of these concentrations was used to produce Collagen substrates incubated for 45 min −1 h at 37 °C to allow the gel to form. All preparation steps were performed on ice to ensure premature gelation did not occur.
Geltrex® substrate preparation
Geltrex is similar to Matrigel, in that both are derived from the Engelbreth-Holm-Swarm tumour and as such are of very similar structures. Geltrex was chosen due to its consistent protein concentration from lot-to-lot, extensive supplier production functional testing on each lot and the system comes ready to use, which means no thawing, diluting, or premature gelling facilitating a higher through put of experiments. Geltrex is a ready to use substrate system, and, as such, minimal substrate preparation was needed. Briefly, the Geltrex stock was placed on ice to avoid premature gelation and used in different volumes; 250, 200, 150 and 100 µl per well in 24 well plates and 1.5, 1 and 0.5 ml per well in 6 well plates, to form substrates of differing thickness. The Geltrex coated plates were then incubated for 1 h until basement membranes were formed.
Confocal laser scanning microscopy
To assess whether any significant morphological differences were present in the tested lines when grown on the ECM, live cell microscopy was performed with a Zeiss LSM 510 Confocal Laser Scanning Microscope (CLSM). The nucleus, being the most dominant feature of a cell, was stained for image clarity but also to ensure that no alterations to the nuclear region occurred. HeLa and HaCaT cells were seeded in Matek 35 mm glass bottomed culture vessels at a density of 1 × 10⁵ in a volume of 200 µl of 10% FBS DMEM/F12. The cells were then incubated for 1 h to encourage the cells to attach to the glass bottom culture dishes, after which 2 ml 10% FBS DMEM/F12 was added. For the 3D culture, cells were seeded exactly in the same fashion, except that the glass bottom was pre-coated with the desired substrate. For Collagen, substrates were prepared as previously described, at Collagen concentrations of 2.5, 2 and 1.5 mg/ml (100 µl/dish), respectively, Geltrex, 150 µl/dish and 100 µl/dish and 2D substrate. After 24 h incubation with 5% CO2 at 37 °C, cells were removed and stained with NucRed® Live 647 ReadyProbes® Reagent, as per the manufacturer’s instructions. Briefly, after 24 h incubation, cells were washed with 2 ml PBS and two drops of the as purchased stain were added per 1 ml of medium. Cells were then incubated for 20 min and washed with PBS prior to imaging. Cells were then imaged live in PBS and the NucRed® Live 647 was excited with a 633 nm Helium Neon laser and the emission detected at 660–675 nm.
Cell viability measurement with Alamar Blue
The Alamar Blue (AB) assay quantitatively monitors the proliferation of human and animal cells, bacteria and fungi (Kuda and Yano 2003; O’Brien et al. 2000; Pettit et al. 2005; Al-Nasiry et al. 2007; Mosmann 1983). It has been widely used in studies of cell viability and cytotoxicity (Vega-Avila and Pugsley 2011; Rampersad 2012; White et al. 1996). For AB viability experiments, both HeLa and HaCaT cells were seeded at a density of 2 × 10⁴ cells per well (1 ml) in 24 well plates and 1 × 10⁵ cells per well (1 ml) in 6 well plates, respectively. Collagen substrates were used at constant volumes of 200 µl per well in 24 well plates and 500 µl per well in 6 well plates. All plates were divided into four parts of the differing concentrations of gel, 2.5, 2, 1.5 mg/ml and finally without Collagen (2D) as a control. Geltrex, plates were divided into parts according to their volume, with uncoated 2D controls, 250, 200, 150 and 100 µl in 24 well plates and 1.5, 1, 0.5 ml in 6 well plates (The experiments were performed in triplicates and each plate contained a 2D control). After 24, 48 and 72 h incubation, the medium was removed and cells were washed with pre-warmed PBS. An AB solution (5% [v/v]) was prepared in medium (without FBS or supplements) and was subsequently added to each well according to the manufacturer’s instructions, and incubated for 3 h. AB conversion was measured by a plate reading spectrometer (Spectra Max—M3) by monitoring fluorescence as a measure of AB dye conversion, using 540 nm excitation and 595 nm emission.
Flow cytometry
Cells were seeded in T-25 cm2 flasks at a density of 1.5 × 10⁶ (5 ml of medium) per flask. For Collagen, flasks were divided into four groups, two flasks with 2.5 mg/ml Collagen, two flasks with 2 mg/ml collagen, two flasks with 1.5 mg/ml collagen and two flasks without Collagen (2D). For Geltrex, flasks were divided into three groups, two flasks with 3.75 ml Geltrex, two flasks with 1.87 ml Geltrex and two flasks without Geltrex (2D). Flasks were incubated in a 5% CO2 at 37 °C for 24 h; all samples were analysed with the aid of a BD Accuri™ C6 Flow Cytometre.
Cell cycle analysis
Cells were grown in 3D and 2D at the same initial seeding concentration of 1.5 × 10⁶ cells per flask and again 5 ml medium volume in T-25 cm2 flasks. After 24 h incubation, cells were washed twice with pre-warmed PBS and were collected by trypsinization, after which the trypsin was removed by centrifugation (1200 RPM for eight min), after which cells were fixed in ice cold, 70% ethanol and prepared for analysis immediately or stored in the fridge for a maximum of 2 days. Briefly, for analysis, cells were washed twice with PBS, to remove any residue fixative and re-suspended in 2 ml PBS. 100 µg/ml Ribonuclease was added to ensure that only the DNA content was stained. After five min incubation with RNase at room temperature, DNA content was then stained with Propidium Iodide (PI) at a staining concentration of 50 µg/ml. The sample was again incubated at room temperature for 20 min, after which it was immediately analysed. A minimum of 10,000 single cell events per sample were analysed.
Apoptosis and necrosis analysis
Cells were seeded on both 2D and 3D substrates, as was done for the cell cycle analysis. Following incubation, the cells were washed twice with pre-warmed PBS and were collected by trypsinization, after which the trypsin was removed by centrifugation. The cells were then washed twice with pre-warmed PBS and stained with the YOPRO1/Propidium iodide (PI) dyes (Biosciences Ltd, Dublin, Ireland), whereby 1 μl of YOPRO1 dye (100 µM) and 1 µl of PI (1 mg/ml) were used to stain cells at per 1.5 × 10⁶ cell/ml. After staining of a cell population, apoptotic cells show a green fluorescence, whereas dead cells show green and red fluorescence. After incubation on ice for 30 min, the cells were analysed by flow cytometry within 30 min, using 488 nm excitation and reading the fluorescence at both 530 and >575 nm in order to visualize three groups: live cells, apoptotic cells and necrotic cells.
Statistical analysis
At least three independent experiments were conducted for each endpoint. Test results for each endpoint were expressed as percentage of the 2D control ± standard deviation (SD). Control values were set as 100%. Differences between samples and the control were evaluated using the statistical analysis package Prisim 7 (Graphpad). Statistically significant differences were set at P ≤ 0.05. Normality of data was confirmed with Q–Q percentile plots and Kolmogorov–Smirnov tests. Equality of variances was evaluated using Levene tests. One-way analysis of variances (ANOVA) followed by Dunnett’s multiple comparison tests were carried out for normally distributed samples with homogeneous variances. Non-parametric tests, namely Kruskal–Wallis followed by Mann–Whitney-U-tests were applied to samples without normal distribution and/or inhomogeneous variances.
Results
Confocal microscopic imagining
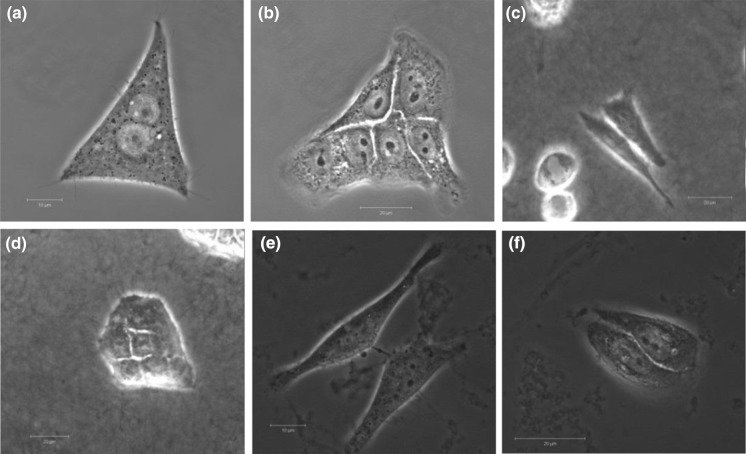
Images of live HeLa and HaCaT cells grown on both extracellular matrices (Collagen and Geltrex) and 2D cultures were recorded by CLSM. Nuclear staining was performed with NucRed® Live 647 ReadyProbes® reagent, as described in the Materials and Methods section. Due to the increased physical depth of the culture vessel caused by the presence of the ECM, two different objective lenses were used: cells grown on Collagen were imaged with a × 20 lens (Fig. 1c, d) whereas, for cells grown on 2D and the Geltrex ECM, a × 63 oil immersion lens (Fig. 1a, b, e, f) was employed. In all cases, minimal or no differences were observed in the cells examined, the nuclear membrane was unaltered and the 3D membrane was clearly visible in all images obtained.
Fig. 1.
a HeLa cells were seeded on 2D culture for 24 h, nuclei were stained with the nuclear stain NucRed. b HaCaT cells were seeded on 2D culture for 24 h, nuclei were stained with the nuclear stain NucRed. c HeLa cells were seeded on 3D culture (Collagen Rat tile) for 24 h and nuclei stained with NucRed. d HaCaT cells were seeded on 3D culture (Collagen Rat tile) for 24 h and nuclei stained with NucRed. e HeLa cells were seeded on 3D culture (Geltrex) for 24 h and nuclei stained with NucRed. f HaCaT cells were seeded on 3D culture (Geltrex) for 24 h and nuclei stained with NucRed (scale bar 20 µm)
Cell viability measurement with Alamar Blue
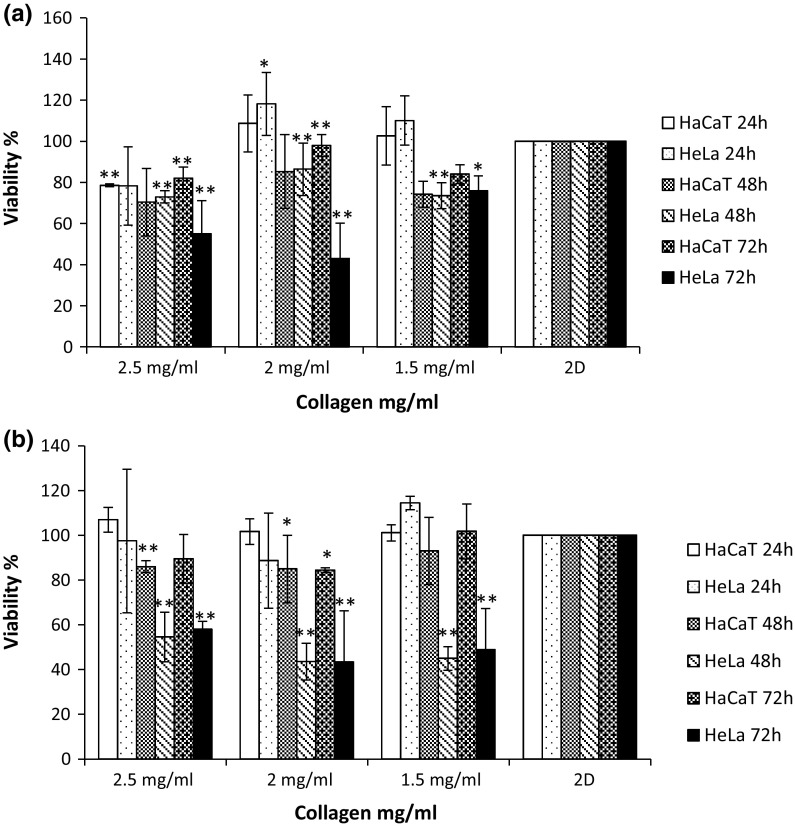
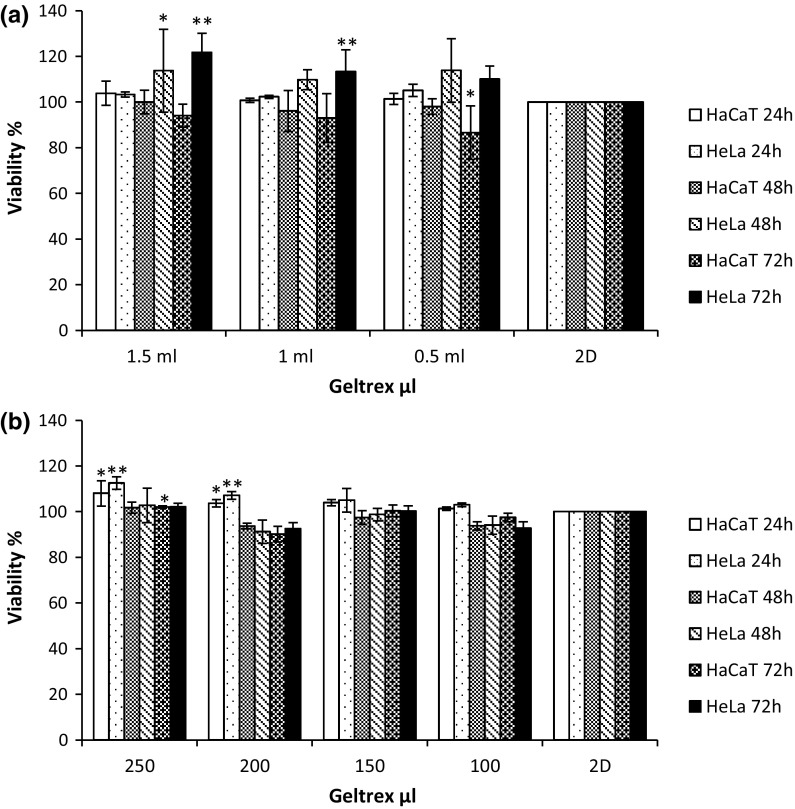
Cells were cultured, gels prepared and cells seeded as outlined in the Materials and Methods section. Following 24, 48 and 72 h incubation, cellular viability levels were monitored with the AB assay. The AB assay measures the innate metabolic activity of cells (Bonnier et al. 2015). The oxidised indigo blue, non-fluorescing form of this chromogenic indicator dye is reduced by cellular dehydrogenases to a pink fluorescent form, which can be easily monitored spectrophotometrically. The HeLa and HaCaT cells, when cultured on Collagen gel (Fig. 2a, b) in both the 6 well plate and 24 well plates and in the first 24 h exhibit higher fluorescence intensity than those cells grown in traditional 2D culture indicative of an increase in cellular viability on the 3D culture membrane. After 48 and 72 h exposure, fluorescence intensity was reduced compared to those cells growing in traditional 2D culture, as seen by a drop in calculated viability levels when compared to that of the 2D control. HeLa cells were noted to be significantly influenced; viability levels were approximately decreased by 50% compared to cells grown on 2D culture after 48 and 72 h incubation in 24 well plates. In contrast, for cells that were cultured on collagen membrane of 2.5 mg/ml concentration ECM (Fig. 2a), the average viability level had dropped by 20% when compared to the conventional 2D control in all incubation periods in 6 well plates. When cultured on Geltrex® (Fig. 3a, b), both HeLa and HaCaT cells showed an increased conversion of the AB dye after 24, 48 and 72 h incubation. This increased fluorescence has been typically interpreted as a higher level of cellular viability (Antoni et al. 2015; Cartmell et al. 2003).
Fig. 2.
Alamar Blue response following 24, 48 and 72 h growth on both 2D and 3D culture (Collagen) of HeLa and HaCaT cells on both a 6 well plate and b a 24 well plate. Data are expressed as a percentage of three independent experiments ± SD of three individual experiments and relative to a 2D culture control. Statistically significant differences between the 3D culture membrane viability responses and that of the 2D cultures are denoted by *P < 0.05 and **P < 0.01
Fig. 3.
Alamar Blue response following 24, 48 and 72 h growth on both 2D and 3D culture (Geltrex) of HeLa and HaCat cells on both a 6 well plate and b a 24 well plate. Data are expressed as a percentage of three independent experiments ± SD of three individual experiments and relative to a 2D culture control. Statistically significant differences between the 3D culture membrane viability responses and that of the 2D cultures are denoted by *P < 0.05 and **P < 0.01
Apoptosis and necrosis analysis
To verify whether the results of the AB assay were indeed due to increased cellular viability in the 3D matrices compared to 2D, live cell flow cytometry studies were performed. A live, apoptotic, necrotic cell triplex assay was performed by using YOPRO and PI in combination to quantify the amount of live/apoptotic and necrotic cells after 24 h incubation on both tested 3D ECMs. For flow analysis, they were then harvested by enzymatic removal and stained with both YOPRO and PI. Cell doublets were excluded from the analysis by agitating the samples immediately prior to the analysis and area scaling with the BD Accuri software. As can be seen (Fig. 4a, b), cells cultured on the collagen ECM displayed slight differences in the levels of live, apoptotic and necrotic cells when compared to 2D substrates. Specifically, the cells grown on all concentrations of collagen ECM displayed nominally lower viability levels than the 2D controls.
Fig. 4.
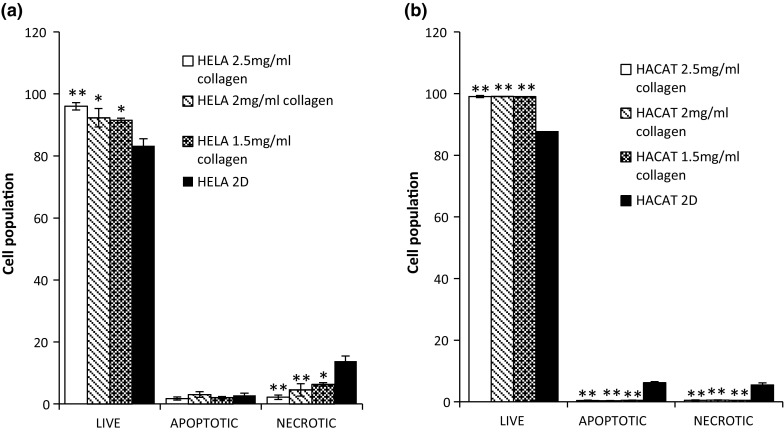
YOPRO and PI stained flow cytometry live, apoptotic and necrotic assay for HeLa (a) and HaCaT (b) cells grown on Collagen (3D) in different concentration and cells grown on plastic (2D) culture. Data are expressed as a percentage of three independent experiments ± SD of three individual experiments. Statistically significant differences between the 3D culture membrane live/dead cell analyses and that of the 2D cultures are denoted by *P < 0.05 and **P < 0.01
A very similar trend was also observed for the HaCaT cells cultured on Geltrex®. The viability values of 2D controls were 95%, and the viability values of 3D cultures were 92 and 95% (Fig. 5a, b). These results indicate that in both tested ECMs on both cell lines, the AB variations noted were not due to a difference in viability but a difference in dye uptake or conversion mechanisms, as previously stated.
Fig. 5.
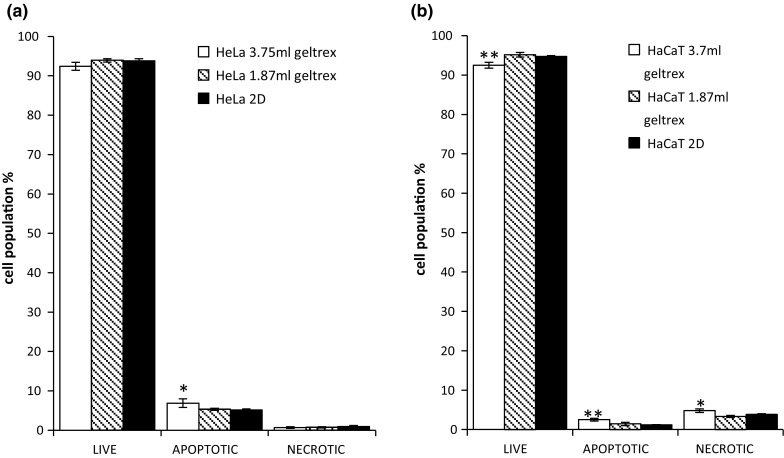
YOPRO and PI stained flow cytommetery live, apoptotic and necrotic assay for Hela (a) and HaCaT (b) cells grown on Geltrex® (3D) in different concentration and cells grown on plastic (2D) culture. Data are expressed as a percentage of three independent experiments ± SD of three individual experiments. Statistically significant differences between the 3D culture membrane live/dead cell analyses and those of the 2D cultures are denoted by *P < 0.05 and **P < 0.01
Cell cycle analysis
In order to determine whether there were any differences between the cyclic behaviour of the cells cultured on the 3D substrates, cell cycle studies were performed on both cell lines in 2D and 3D cultures. Cells were grown as previously on various different working concentration or volumes of the ECM under study and incubated for 24 h on the ECM prior to analysis. For analysis, cells were then harvested by enzymatic removal, fixed and stained as detailed earlier and DNA content in the cells was monitored by a BD Accuri™ C6 Flow Cytometre. As before, cell doublets were excluded from the analysis by agitating the samples immediately prior to the analysis and area scaling with the BD Accuri software. The cells grown in Collagen did show variations when compared to those grown in traditional 2D culture, after 24 h of incubation. In the HeLa cells, there were significant increases to the number of cells in the G0/G1 and S-phase, with a corresponding reduction of cells in the G2/M phase, indicating that the cells may have been arrested in the G0/G1 or S phase as a result of culture on the Collagen substrate. In contrast these differences were not observed in the HaCaT cells with only marginal differences in the cell cycle checkpoint populations indicating they were not arrested to the same degree as the HeLa cells (Fig. 6).
Fig. 6.
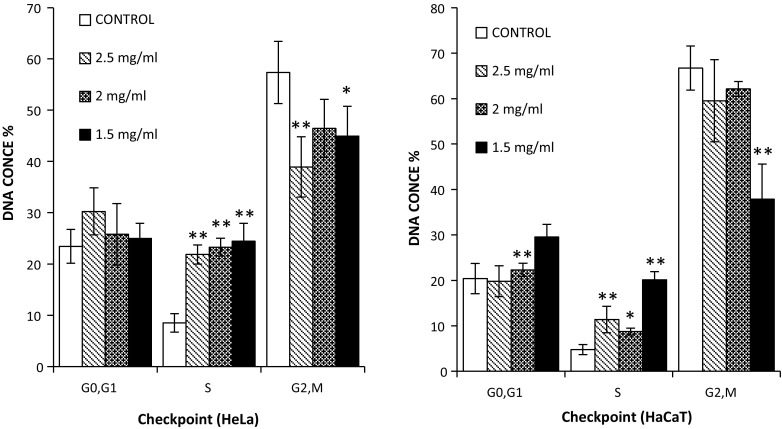
Cell cycle analysis of HeLa (left) and HaCaT (right) cells grown on three different concentrations of Collagen gel (3D) and cells grown on plastic (2D) culture, and percentage of cells at G0/G1, S, and G2/M phases of cell cycle. Data are expressed as a percentage of three independent experiments ± SD of three individual experiments. Statistically significant differences between the 3D culture membrane cell cycle analyses and that of the 2D cultures are denoted by *P < 0.05 and **P < 0.01
In contrast to the observations on the collagen substrate, Geltrex, which is used at a fixed working concentration and at different volumes, resulted in less alteration to the cell cycle than collagen. Only the HeLa (Fig. 7) cell line displayed variation in cell phases when compared with 2D culture, for which slight increases in the G2/M phase with a corresponding decrease in the G0/G1 were observed.
Fig. 7.
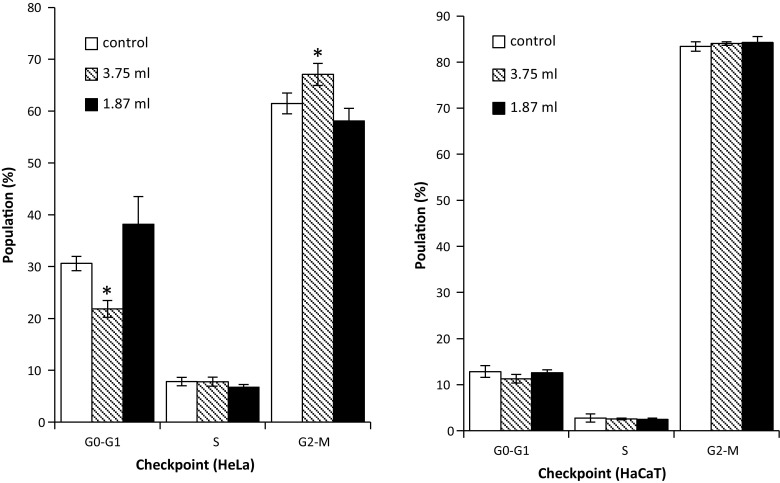
Cell cycle analysis of HeLa and HaCaT cell grown on two different concentration of Geltrex (3D) and cells grown on plastic (2D) culture, and percentage of cells at G0/G1, S and G2/M phases of cell cycle. Data are expressed as a percentage of three independent experiments ± SD of three individual experiments. Statistically significant differences between the 3D culture membrane cell cycle analyses and that of the 2D cultures are denoted by *P < 0.05 and **P < 0.01
Discussion
When the cells were viewed under the CLSM, the scaffold structures were clearly visible in both the Collagen and Geltrex (Fig. 1c–f). As can be seen in Fig. 1, some minor morphological differences were apparent between the HeLa or HaCaT cells grown in conventional 2D (Fig. 1a, b) when compared to those on the Collagen based or Geltrex 3D membrane (Fig. 1c–f). However, nuclear staining confirmed that the nuclear integrity of both tested cells were not significantly altered by culture on either the Collagen or the Geltrex substrate and it is postulated that the morphological differences observed are attributed to the growth on a soft porous membrane in comparison to that of the 2D glass substrate.
The in vitro viability of both cell lines was assessed in both 3D environments and all membrane variations were compared to a traditional 2D culture system used as control. Significant (P ≥ 0.05) differences were noted between the viabilities of the two cell lines on the 3D membranes and 2D substrates. These differences presented themselves as an apparent increase in the viability levels of both cell lines on the 3D matrices, but this is in fact due to an increase in the conversion rate of the resazurin to resorufin in the AB assay, due to the transition from a 2D to a 3D system (Bonnier et al. 2015). Indeed, similar effects were observed for an exposure to the chemotherapeutic agent Doxorubicin (Casey et al. 2016). The effect was notably different in the Collagen based 3D matrix at a concentration of 2.5 mg/ml (6 well plates) for both the cell lines, but it is postulated that this may have been due to the increased physical density of the higher concentration of Collagen of restricting nutrient levels to the cells or more likely the increased density of the membrane hindering the conversion of the dye by binding to the fibrous mesh of the ECM. It was also noted that, while increases in AB conversion were also observed when both cell lines were cultured on the Geltrex® ECM, this effect was of a much smaller magnitude than the variations observed in the Collagen ECM, suggesting that the effect, while not eliminated, can be minimised by employing a different ECM. In previous studies comparing the viability of cells grown in conventional 2D cultures to that of cells grown on collagen gel matrices, the apparent increased viability observed using the Alamar Blue cytotoxicity assay was attributed to differences in the diffusion and conversion rates of the test dye due to the alteration of the geometry and morphology of the test system (Bonnier et al. 2015). However, when the culture period was extend past 24 h, significant (P ≥ 0.05) variations in the AB assay responses to those of a 2D control were observed, as a drop in cellular viability. The current study again indicates that, rather than affecting a significant change in the cell metabolism, the 3D matrix (Collagen or Geltrex®) composition and concentration alters the exposure conditions of the cells to the dye (AB), but notably that the effect can be reduced by ECM type, concentration and exposure period, and the observed effects should be taken into account when comparing cellular exposures in 2D and 3D matrices.
The apoptosis results were in contrast to the AB studies and verified the postulation that there were no differences in cellular viability in 2D and 3D systems after 24 h exposure (Fig. 4). The cells cultured on the highest working concentration of the collagen ECM (2.5 mg/ml) showed the highest level of cellular viability of 96%, which, although not significantly different to that of the 2D control (94%), gives support to the notion that the highly concentrated fibrous membrane of the 2.5 mg/ml concentration Collagen ECM restricted the diffusion of the AB in the test environment, resulting in a lower conversion rate in the AB studies. In contrast to the HeLa cells, no variations were noted in cell viability levels in the HaCaT cultures as a function of Collagen concentration, cultures yielding viability levels of 97% in the 2D and an average of 98% in all the 3D concentrations tested. This gives further support to the notion that cultures grown on 3D do not have an increased viability as indicated by the AB conversion rates, but that the different cell growth environments can themselves influence the conversion rates of the cytotoxicity assay (Bonnier et al. 2015), resulting in an apparent increased viability in 3D matrices compared to 2D cultures. Identical studies were then performed with the Geltrex® based 3D cultures, in which, again, no variations were noted between viability levels of 2D and 3D cultures. In the HeLa cell line, no differences in viability were noted between different volumes of Geltrex® employed to form the membrane, as was the case with the Collagen based membranes, 2D cultures yielding 94% viability and the 3D yielding 92 and 93% viability levels, differences which fall outside statistical significance, again providing supportive evidence that observed viability levels were only a result of the transition from 2D to 3D.
In vivo, the proliferation of cells is strictly controlled by numbers of proteins which can regulate prognosis of the cell cycle. However, the onset of carcinoma and indeed the immortalisation process of cells can alter the normal control of the cell cycle (Stacey et al. 2009). There are three important checkpoints during cell cycle, the first, G1 checkpoint between the G1/S phase, the second, G2 checkpoint between the G2/M phase and the spindle checkpoint in the mitotic phase between metaphase and anaphase (Han et al. 1995; Gorbsky 2001; Seluanov et al. 2009). Interestingly, statistically significant (P ≥ 0.05) differences were noted in the cell cycle assay, which were seen to be dependent on the working concentration of the Collagen concentration, cell population numbers in the G0/G1 phase decreasing and S-Phase population numbers increasing with decreasing Collagen working concentration, indicating that the presence of the Collagen substrate most likely altered the cycle of the HeLa cells (Fig. 6) by arresting cells in the G0/G1 phase. This effect, while also apparent for the HaCaT (Fig. 6) cells, was notably of lesser extent, the greatest variation being observed at the lowest working concentration of Collagen, indicating that the normal HaCaT line was not as susceptible to alteration in cell cycle by Collagen as the HeLa line. In contrast to the Collagen, only the HeLa (Fig. 7) cell line displayed variations in cell phases when compared to that of the 2D culture, slight increases in the G2/M phase with a corresponding decrease in the G0/G1 being observed. No variations in the HaCaT (Fig. 7) line were observed, both 2D and 3D cultures showing little or no variation in cell populations at each checkpoint, indicating that the HeLa and HaCaT cell cycle were largely or completely unaltered by the transition from 2D to that of 3D Geltrex culture. The observed cell cycle interruptions are thought to be the cause of the decreasing cellular viability levels determined with the AB assay for the longer term exposure on the Collagen membrane. The effect causes a reduced proliferation rate of the cells on the Collagen, resulting in a reduction in the number of cells present on the 3D matrix for the 48 and 72 h exposures when compared to that of the 2D control, resulting in a lower assay conversion rate on the membranes.
Conclusion
In summary, this study presents a comparison between 2D and 3D culture by using two commercial products of 3D culture in different concentrations and volumes of 3D culture. Thus, the study shows that transfer from 2D to 3D culture does not necessarily affect the viability of the cells. Moreover, differences in fluorescent detection of the AB assay are primarily due to an increased cell surface area exposed to the surrounding environment which leads to an increase in uptake and conversion rates of dye and not to changes in cellular viability levels. Viability levels were verified via flow cytometry and no differences in live cell and apoptosis levels between cells grown on 2D culture and cells grown in 3D culture were noted. However, when the culture length was increased these increases in AB conversion were reduced, ultimately displaying a reduced viability on 3D when compared to a 2D. It was subsequently shown that transfer from 2D to 3D culture can influence cell cycle by inducing an interruption at the S-phase of the cell cycle interruptions result in a decreased cellular numbers due to a lower proliferation rate of cells on the Collagen membrane and should be accounted for in experimental planning. The results of this study strongly support the use of 3D culture in cytotoxicity assays to improve the relevance of drug or toxin screening protocols is a viable option, as there is no loss in cellular viability. They may indeed provide a more comparable culture environment to that of in vivo exposures, but appropriate controls and experimental validations must be incorporated into the protocols at every assessed time point. Numerous chemotherapeutic compounds work by processes of DNA intercalation and inhibition of macromolecular biosynthesis (Parker 2009), and as such, are most effective at set cell checkpoints. If the cell culture environment employed arrests the cell at a particular checkpoint, as is observed in this study, the efficacy of a drug could potentially be enhanced or delayed. Indeed, in previous study (Casey et al. 2016) variations in doxorubicin toxicity at short term cellular exposures were observed resulting from a transition from 2D to 3D collagen membrane. Such responses may have been due to the alteration of cell cycle, altering the mechanism of action of the doxorubicin. Therefore, in choosing a membrane for screening drug toxicity, consideration must be given to the membrane effect on cellular systems. If basic functions like cell cycle can be influenced by experimental protocols this may in turn reduce or indeed improve the efficacy of tested drugs, depending on their mode of action. A viable option, as there is no loss in cellular viability, and may indeed provide a more comparable culture environment to that of in vivo exposures by appropriate controls and experimental validations must be incorporated into the protocols at every assessed time point.
Acknowledgements
This study were funded by the Government of Libya for M. Gargotti and Consejo Nacional de Cienciay Tecnología, Mexico for U. Lopez-Gonzalez and this work has been enabled by Science Foundation Ireland Principle Investigator Award 11/PI/1108.
References
- Al-Nasiry S, Geusens N, Hanssens M, Luyten C, Pijneuborg R. The use of Alamar Blue assay for quantitative analysis of viability, migration and invasion of choriocarcinoma cells. Hum Reprod. 2007;22:1304–1309. doi: 10.1093/humrep/dem011. [DOI] [PubMed] [Google Scholar]
- Annabi N, Tamayol A, Uquillas JA, Akbari M, Bertassoni LE, Cha C, Camci-unal G, Dokmeci MR, Peppas NA. 25th anniversary article: rational design and applications of hydrogels in regenerative medicine. Adv Mater. 2014;26:85–124. doi: 10.1002/adma.201303233. [DOI] [PMC free article] [PubMed] [Google Scholar]
- Antoni D, Burckel H, Josset E, Noel G. Three-dimensional cell culture: a breakthrough in vivo. Int J Mol Sci. 2015;16:5517–5527. doi: 10.3390/ijms16035517. [DOI] [PMC free article] [PubMed] [Google Scholar]
- Bonnier F, Keating ME, Wróbel T, Majzner K, Baranska M, Garcia A, Blanco A, Byrne HJ. Cell viability assessment using the Alamar Blue assay: a comparison of 2D and 3D cell culture models. Toxicol In Vitro. 2015;29:124–131. doi: 10.1016/j.tiv.2014.09.014. [DOI] [PubMed] [Google Scholar]
- Breslin S, O’Driscoll L. Three-dimensional cell culture: the missing link in drug discovery. Drug Discov Today. 2013;18:240–249. doi: 10.1016/j.drudis.2012.10.003. [DOI] [PubMed] [Google Scholar]
- Cartmell SH, Porter BD, Garcia AJ, Guldberg RE. Effects of medium perfusion rate on cell-seeded three-dimensional bone constructs in vitro. Tissue Eng. 2003;9:1197–1203. doi: 10.1089/10763270360728107. [DOI] [PubMed] [Google Scholar]
- Casey A, Gargotti M, Bonnier F, Byrne HJ. Chemotherapeutic efficiency of drugs in vitro: comparison of doxorubicin exposure in 3D and 2D culture matrices. Toxicol In Vitro. 2016;33:99–104. doi: 10.1016/j.tiv.2016.02.022. [DOI] [PubMed] [Google Scholar]
- Cody D, Casey A, Naydenova I, Mihaylova E (2013) A comparative cytotoxic evaluation of acrylamide and diacetone acrylamide to investigate their suitability for holographic photopolymer formulations. Int J Polym Sci 2013. doi:10.1155/2013/564319
- Drife JO. Breast development in puberty. Ann N Y Acad Sci. 1986;464:58–65. doi: 10.1111/j.1749-6632.1986.tb15993.x. [DOI] [PubMed] [Google Scholar]
- European Union—Directive 2010/63/EU of the European Parliament and of the Council of 22 September 2010
- Freshney RI. Culture of animal cells. A manual of basic technique. 5. Hoboken: Wiley; 2005. [Google Scholar]
- Gilbert TW, Sellaro TL, Badylak SF. Decellularization of tissues and organs. Biomaterials. 2006;27:3675–3683. doi: 10.1016/j.biomaterials.2006.02.014. [DOI] [PubMed] [Google Scholar]
- Gorbsky GJ. The mitotic spindle checkpoint. Curr Biol. 2001;11:R1001–R1004. doi: 10.1016/S0960-9822(01)00609-1. [DOI] [PubMed] [Google Scholar]
- Han Z, Chatter D, He DM, Pantazis P, Wyche JH, Hendrickson EA. Evidence for a G2 checkpoint in p53-independent apoptosis induction by X-irradiation. Mol Cell Biol. 1995;15:5849–5857. doi: 10.1128/MCB.15.11.5849. [DOI] [PMC free article] [PubMed] [Google Scholar]
- Herzog E, Casey A, Lyng FM, Chambers G, Byrne HJ, Davoren M. A new approach to the toxicity testing of carbon-based nanomaterials—the clonogenic assay. Toxicol Lett. 2007;174:49–60. doi: 10.1016/j.toxlet.2007.08.009. [DOI] [PubMed] [Google Scholar]
- Hutmacher DW. Scaffolds in tissue engineering bone and cartilage. Biomaterials. 2000;21:2529–2543. doi: 10.1016/S0142-9612(00)00121-6. [DOI] [PubMed] [Google Scholar]
- Kim JB. Three-dimensional tissue culture models in cancer biology. Semin Cancer Biol. 2005;15:365–377. doi: 10.1016/j.semcancer.2005.05.002. [DOI] [PubMed] [Google Scholar]
- Kuda T, Yano T. Colorimetric alamarBlue assay as a bacterial concentration and spoilage index of marine foods. Food Control. 2003;14:455–461. doi: 10.1016/S0956-7135(02)00100-7. [DOI] [Google Scholar]
- Kutys ML, Doyle AD, Yamada KM. Regulation of cell adhesion and migration by cell-derived matrices. Exp Cell Res. 2013;319:2434–2439. doi: 10.1016/j.yexcr.2013.05.030. [DOI] [PMC free article] [PubMed] [Google Scholar]
- Lee J, Cuddihy MJ, Kotov NA. Three-dimensional cell culture matrices: state of the art. Tissue Eng Part B Rev. 2008;14:61–86. doi: 10.1089/teb.2007.0150. [DOI] [PubMed] [Google Scholar]
- Mosmann T. Rapid colorimetric assay for cellular growth and survival: application to proliferation and cytotoxicity assays. J Immunol Methods. 1983;65:55–63. doi: 10.1016/0022-1759(83)90303-4. [DOI] [PubMed] [Google Scholar]
- Mukherjee SG, O’Claonadh N, Casey A. Comparative in vitro cytotoxicity study of silver nanoparticle on two mammalian cell lines. Toxicol In Vitro. 2011;26:238–251. doi: 10.1016/j.tiv.2011.12.004. [DOI] [PubMed] [Google Scholar]
- O’Brien J, Wilson I, Orton T, Pognan F. Investigation of the Alamar Blue (resazurin) fluorescent dye for the assessment of mammalian cell cytotoxicity. Eur J Biochem. 2000;267:5421–5426. doi: 10.1046/j.1432-1327.2000.01606.x. [DOI] [PubMed] [Google Scholar]
- Padmalayam I, Suto MJ. 3D cell cultures. Mimicking in vivo tissues for improved predictability in drug discovery. Annu Rep Med Chem. 2012;47:367–378. doi: 10.1016/B978-0-12-396492-2.00024-2. [DOI] [Google Scholar]
- Parker WB. Enzymology of purine and pyrimidine antimetabolites used in the treatment of cancer. Chem Rev. 2009;109:2880–2893. doi: 10.1021/cr900028p. [DOI] [PMC free article] [PubMed] [Google Scholar]
- Peck Y, Wang D-A. Three-dimensionally engineered biomimetic tissue models for in vitro drug evaluation: delivery, efficacy and toxicity. Expert Opin Drug Deliv. 2013;10:369–383. doi: 10.1517/17425247.2013.751096. [DOI] [PubMed] [Google Scholar]
- Pettit RK, Weber CA, Kean MJ, Hoffmann H, Pettit GR, Tan T, Franks KS, Horton ML. Microplate Alamar Blue assay for Staphylococcus epidermidis biofilm susceptibility testing. Antimicrob Agents Chemother. 2005;49(7):2612–2617. doi: 10.1128/AAC.49.7.2612-2617.2005. [DOI] [PMC free article] [PubMed] [Google Scholar]
- Place ES, George JH, Williams CK, Stevens MM. Synthetic polymer scaffolds for tissue engineering. Chem Soc Rev. 2009;38:1139–1151. doi: 10.1039/b811392k. [DOI] [PubMed] [Google Scholar]
- Rampersad SN. Multiple applications of Alamar Blue as an indicator of metabolic function and cellular health in cell viability bioassays. Sensors (Switzerland) 2012;12:12347–12360. doi: 10.3390/s120912347. [DOI] [PMC free article] [PubMed] [Google Scholar]
- Ravi M, Paramesh V, Kaviya SR, Anuradha E, Solomon FD. 3D cell culture systems: advantages and applications. J Cell Physiol. 2015;230:16–26. doi: 10.1002/jcp.24683. [DOI] [PubMed] [Google Scholar]
- Rimann M, Graf-Hausner U. Synthetic 3D multicellular systems for drug development. Curr Opin Biotechnol. 2012;23:803–809. doi: 10.1016/j.copbio.2012.01.011. [DOI] [PubMed] [Google Scholar]
- Riss T (2014) Overview of 3D Cell culture model systems validating cell-based assays for use with 3D cultures [PowerPoint slides]. Retrieved from https://worldwide.promega.com/-/media/files/promega-worldwide/north-america/promega-us/webinars-and-events/2014/3d-cell-culture-webinar-march-2014.pdf?la=en
- Seluanov A, Hine C, Azpurua J, Feigenson M, Bozzella M, Mao Z, Catania KC, Gorbunova V. Hypersensitivity to contact inhibition provides a clue to cancer resistance of naked mole-rat. Proc Natl Acad Sci. 2009;106:19352–19357. doi: 10.1073/pnas.0905252106. [DOI] [PMC free article] [PubMed] [Google Scholar]
- Stacey G, Bar P, Granville R (2009) Primary cell cultures and immortal cell lines. Encycl Life Sci, pp. 1–6. http://orca.cf.ac.uk/24620/
- Vega-Avila E, Pugsley MK. An overview of colorimetric assay methods used to assess survival or proliferation of mammalian cells. Proc West Pharmacol Soc. 2011;54:10–14. [PubMed] [Google Scholar]
- White MJ, DiCaprio MJ, Greenberg DA. Assessment of neuronal viability with Alamar Blue in cortical and granule cell cultures. J Neurosci Methods. 1996;70:195–200. doi: 10.1016/S0165-0270(96)00118-5. [DOI] [PubMed] [Google Scholar]
- Worthington P, Pochan DJ, Langhans SA. Peptide hydrogels—versatile matrices for 3D cell culture in cancer medicine. Front Oncol. 2015;2015:92. doi: 10.3389/fonc.2015.00092. [DOI] [PMC free article] [PubMed] [Google Scholar]


