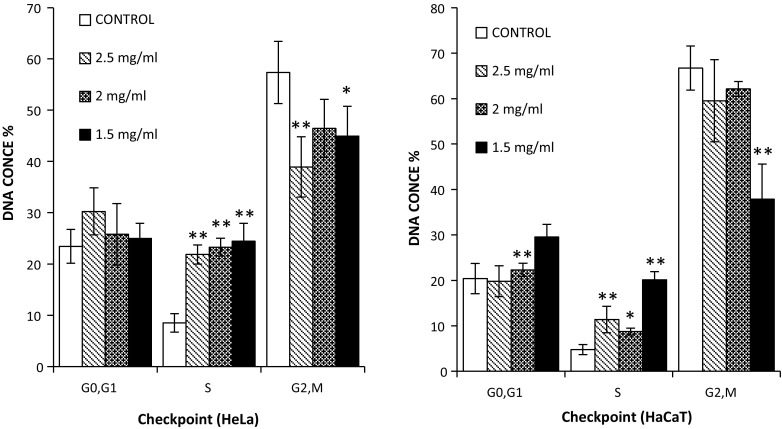
Fig. 6.

Cell cycle analysis of HeLa (left) and HaCaT (right) cells grown on three different concentrations of Collagen gel (3D) and cells grown on plastic (2D) culture, and percentage of cells at G0/G1, S, and G2/M phases of cell cycle. Data are expressed as a percentage of three independent experiments ± SD of three individual experiments. Statistically significant differences between the 3D culture membrane cell cycle analyses and that of the 2D cultures are denoted by *P < 0.05 and **P < 0.01
