
Fig. 7.
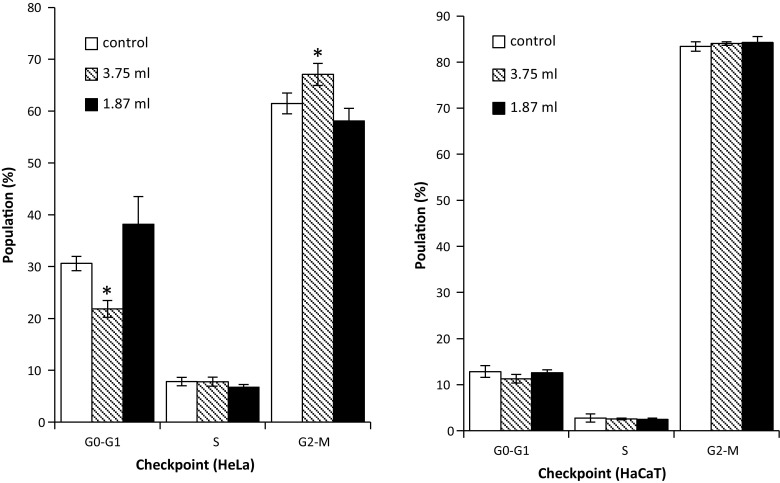
Cell cycle analysis of HeLa and HaCaT cell grown on two different concentration of Geltrex (3D) and cells grown on plastic (2D) culture, and percentage of cells at G0/G1, S and G2/M phases of cell cycle. Data are expressed as a percentage of three independent experiments ± SD of three individual experiments. Statistically significant differences between the 3D culture membrane cell cycle analyses and that of the 2D cultures are denoted by *P < 0.05 and **P < 0.01