Abstract
Sensor-based cellular microphysiometry is a technique that allows non-invasive, label-free, real-time monitoring of living cells that can greatly improve the predictability of toxicology testing by removing the influence of biochemical labels. In this work, the Intelligent Mobile Lab for In Vitro Diagnostics (IMOLA-IVD) was utilized to perform cellular microphysiometry on 3D multicellular spheroids. Using a commercial 3D printer, 3 × 3 microwell arrays were fabricated to maintain nine previously cultured HepG2 spheroids on a single BioChip. Integrated layers above and under the spheroids allowed fluidic contact between spheroids in microwells and BioChip sensors while preventing wash out from medium perfusion. Spheroid culturing protocols were optimized to grow spheroids to a diameter of around 620 μm prior to transfer onto BioChips. An ON/OFF pump cycling protocol was developed to optimize spheroid culture within the designed microwells, intermittently perfuse spheroids with fresh culture medium, and measure the extracellular acidification rate (EAR) and oxygen uptake rate (OUR) with the BioChips of the IMOLA-IVD platform. In a proof-of-concept experiment, spheroids were perfused for 36 h with cell culture medium before being exposed to medium with 1% sodium dodecyl sulphate (SDS) to lyse cells as a positive control. These microphysiometry studies revealed a repeatable pattern of extracellular acidification throughout the experiment, indicating the ability to monitor real-time metabolic activity of spheroids embedded in the newly designed tissue encapsulation. After perfusion for 36 h with medium, SDS exposure resulted in an instant decrease in EAR and OUR signals from 37 mV/h (± 5) to 8 mV/h (± 8) and from 308 mV/h (± 21) to −2 mV/h (± 13), respectively. The presented spheroid monitoring system holds great potential as a method to automate screening and analysis of pharmaceutical agents using 3D multicellular spheroid models.
Keywords: Spheroid-on-chip, Organ-on-chip, Microphysiometry, Label-free sensing, Extracellular acidification, Cellular respiration
Introduction
Pharmaceutical research into new molecules involves multiple steps including target identification, drug discovery, compound synthesis, preclinical study, and drug development (Kang et al. 2008). This is followed by a subsequent phase of clinical trials, manufacturing, and product lifecycle management. When an active pharmaceutical ingredient is successfully identified as a candidate drug, preclinical testing involving in vitro (i.e. cell culture) and in vivo (i.e. animal models) ADMET (absorption, distribution, metabolism, excretion, toxicity) characterization is performed before the new substance enters clinical trials (Rubin and Gilliland 2012). Particularly, more emphasis has been placed on improving in vitro toxicology studies that use human and animal cells in recent years (Baras et al. 2012; Alépée et al. 2014; Astashkina and Grainger 2014). While in vivo animal studies can provide foundational knowledge of drug interaction with fully developed organ systems, their low translation to human subjects and reliability in predicting clinical outcomes causes a gap in the drug development pipeline (Waring et al. 2015). This gap allows potentially harmful drugs to progress into the costly phase of clinical trials (Marx et al. 2016).
Drug toxicity is a leading cause of failures in clinical trials and post-market attrition of approved drugs. The average success rates for ten big pharmaceutical companies from 1991 to 2000 indicated that 89% of substances which passed preclinical testing failed during clinical testing (Kola and Landis 2004). Implementing early stage in vitro models that accurately mirror their in vivo counterparts is a critical step towards preventing future failures due to toxicity and filling the gap between preclinical and clinical testing in the drug development pipeline. It is crucial to conduct in vitro toxicology assays in early R&D stages based on the approach “fail early, fail cheap” in order to analyze potential toxicities as early as possible (Wen and Yang 2008).
2D culture models are an important component in early-stage, high-throughput assessment of chemical toxicity. However, taken alone the results from these assays are not always predictive of in vivo response of human organs (Matsusaki et al. 2014). This is likely due to a lack of organ-specific traits in immortalized cell lines. Primary cells retain more cell-specific functionality and have been utilized in both planar and suspension-based assays. However, the isolation process damages cell surface receptors and, in effect, inhibit long-term culture; making studies in toxicity unfeasible with suspension cultures (Soldatow et al. 2013).
To aid in assessing organ toxicity in vitro, 3D cellular models have emerged as a complementary approach that creates an environment that mimics the native environment of tissue (Edmondson et al. 2014). For example, liver slices include all liver cell types and stromal cells do a good job mirroring mechanisms of toxicity (Bale et al. 2014). However, there are practical limitations to the implementation of 3D cultures due to their increased size and their geometry. Additionally, difficulty in sample acquisition makes scaling liver slices to a volume necessary for preclinical trials impractical for high-throughput screening (Lee et al. 2005). Sandwich cultures, where hepatocytes are placed between layers of hydrogel scaffolds, also preserve liver-specific function and are a more scalable alternative (Wilkening et al. 2003). The feasibility of using these cultures for hepatotoxicity assessments is restricted because cells have limited access to oxygen and nutrients due to limited diffusion into the scaffolds. Spheroids, a type of scaffold-free model, based on self-assembly, are a promising archetype that is more suitable for high-throughput toxicity testing (Mueller et al. 2014) and also demonstrated higher cell viability and detoxification capability compared to monolayer culture (Abu-Absi et al. 2002).
For these reasons, multicellular spheroids have attracted more attention recently for usage in a variety of test schemes (Mehta et al. 2012; Soldatow et al. 2013; Astashkina and Grainger 2014) and have already been successfully used in high-throughput applications (Kelm and Fussenegger 2004) and long-term culture (Ramaiahgari et al. 2014). Spheroid formation in most cell types relies on self-assembly of cells, making it a simple and versatile method that can be easily integrated into a variety of experimental protocols. Because of these advantages, spheroids are excellent tissue models to incorporate with newly evolving Organ-on-a-Chip platforms. Organs-on-Chips attempt to mimic complex in vivo conditions using a combination of microfluidics and biology and are poised to become indispensable diagnostic tools for early stage toxicological assessments of developing drug formulations (Huh et al. 2012).
Real-time sensing not only has implications for foundational studies as presented, but also has the potential to change the way toxicology studies are performed by increasing the time resolution available to a single study (Eklund et al. 2004). A large drawback in traditional toxicology assessments is the need for multiple samples in order to establish a temporal response to exposure. This increases the cost associated with drug development. Real-time assessments have the benefit of a single sample providing long-term data in a time-resolved fashion. Cellular microphysiometry, a label-free technique where multiple sensors monitor metabolic parameters, can be used to indirectly and noninvasively monitor metabolic processes of 3D models, providing researchers with long-term data on toxic response or kinetics (Weltin et al. 2014). In addition, the continuous online monitoring of microphysiometry systems allows the study of cellular recovery in response to chemical stimulation, a process not easily probed via traditional techniques (Wang et al. 2005). Recently, electrochemical sensors were integrated in a 96-well plate and were then used for lactate and oxygen measurement of hepatocyte spheroids (Weltin et al. 2017). HepaRG cells were cultured with a seeding density of 2000 cells/well for 3 days on a shaker. Candidate studies with Antimycin A, a suppressor of the aerobic metabolic pathway, and Bosentan, which induced acute liver toxicity in recent studies, demonstrated the capability to identify the harmful changes in metabolism after drug exposure.
In this work, the Intelligent Mobile Lab for In Vitro Diagnostics (IMOLA-IVD), a modular, electrochemical platform that measures metabolic and morphological parameters such as extracellular acidification (pH), cellular respiration (pO2), and morphology (impedance) was utilized to monitor HepG2 spheroids using real-time cellular microphysiometry (Weiss et al. 2013). The IMOLA-IVD has been successfully used to monitor suspension and monolayer cultures, where cells are seeded directly onto the surface of the BioChip. The IMOLA-IVD is able to perform automated microphysiological assays for toxicity evaluation (Eggert et al. 2015) and it was demonstrated recently that the microsensor platform allows monitoring of the transepithelial electrical resistance of reconstructed human epidermis models (Alexander and Wiest 2016). Previously unpublished attempts were made at immobilizing and monitoring 3D cellular constructs specifically multicellular spheroids (unpublished work); however, collagen coating resulted in de-differentiation to planar morphology during the course of experiments. Furthermore, immobilization via hydrogels resulted in dampening of the sensor signal. Building upon this preliminary data, we developed a novel system for integrating 3D hepatocyte spheroids with the IMOLA-IVD for label-free, non-invasive measurements of the metabolic parameters of spheroids.
Materials and methods
Overview and configuration of IMOLA-IVD monitoring system
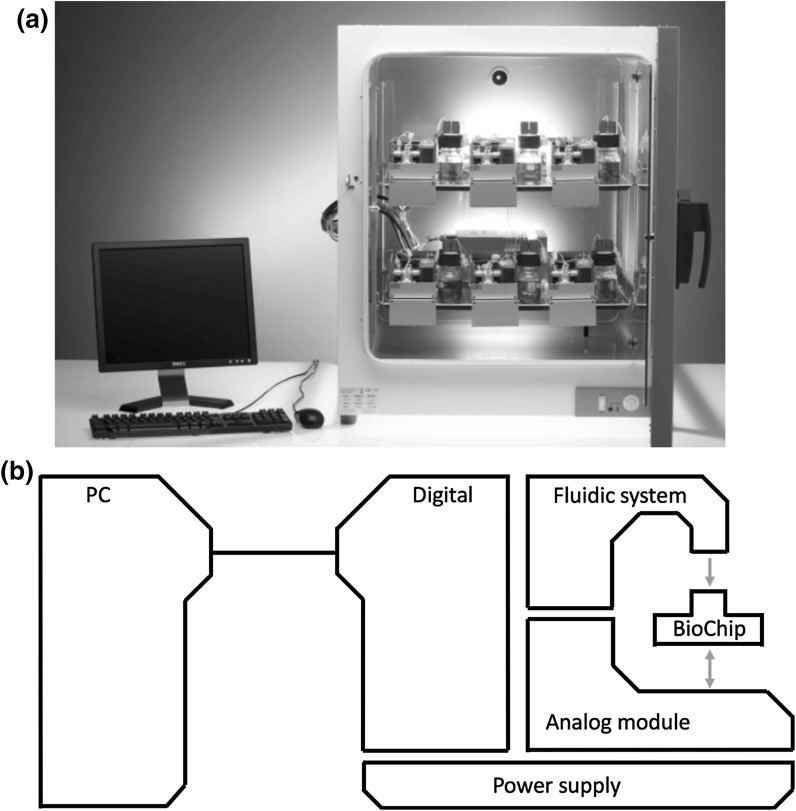
The IMOLA-IVD lab-on-a-chip system (cellasys GmbH, Munich, Germany) is a modular, electrochemical platform that passively monitors metabolic and morphological parameters. Up to 6 IMOLA-IVDs (Fig. 1a) can be installed offering parallel and online investigation of six samples with the controlled atmosphere of an incubator. The modular structure is composed of an analog module, a fluidic system, a BioChip, power supply, the digital module and a personal computer (Fig. 1b). The installed system communicates with a personal computer via the digital module. One analog module performs measurements on a single BioChip. Experimental settings are programmed and managed with the software module Data Acquisition and Link Application (DALiA) Client 2.0. The user is able to determine the parameters for the pump cycle (stop-and-pump modes), flow speed, and the application of different solutions (i.e. cell culture medium, chemicals, drugs etc.). Using the DALiA client 2.0, custom experiments are performed using periodic pump ON/OFF cycling with a peristaltic pump. The detailed implementation of an automated assay into the IMOLA-IVD system is explained in a previous publication (Eggert et al. 2015). Pump ON cycles replenish cells with fresh medium, allowing cells to maintain viability; while pump OFF cycles allow the dynamic environmental parameters to be measured by on-chip sensors as the cells acidify the medium and consume oxygen and nutrients. This allows the user to noninvasively monitor the metabolism of the cellular population.
Fig. 1.
a Six Intelligent Mobile Labs for in vitro diagnostics are installed in an incubator and connected to a personal computer for temporary data storage and control of experimental settings. b The illustration presents the modular structure of the technology with the sensor chip (BioChip), the analog module for the operation of the microsensors, the fluidic system for the application of cell culture medium and test substances, the power supply, and the digital module which communicates with a personal computer
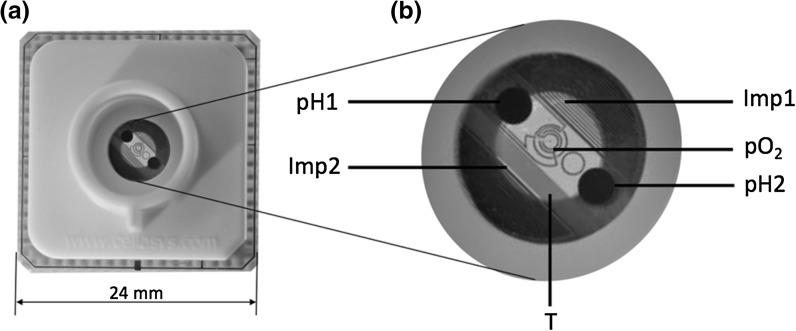
BioChips enable the metabolic monitoring of cellular parameters via label-free, parallel, and continuous measurements in real-time (Fig. 2a). Impedance, extracellular acidification, oxygen consumption and temperature are measured in a microenvironment using two inter-digitated electrode structure (IDES) sensors, two miniaturized pH sensors, one amperometric sensor and one temperature sensor (Fig. 2b). The sensor substrate is manufactured in a three step thin-film technology process. First a noble metal layer is deposited to form the sensor structures, second the pH functionality is added by growing a metal-oxide layer (Brischwein et al. 2009), finally an insulation layer is added to define the open sensor surfaces and cover wiring as well as the complete temperature sensor. The complete sensor-set operates by electrochemical principles. The pH sensitive electrodes (diameter 1.0 mm) are operated versus one Ag/AgCl electrode outside of the fluidic head. The dissolved oxygen sensor is a three electrode membrane-free Clark cell with a working electrode diameter of 50 µm. The read out of the electrochemical microsensors are voltages and the unit is mV. Due to the high miniaturization, the microsensors tend to drift (see Figs. 6 and 7, top), therefore a direct conversion to pH or dissolved oxygen concentration would be erroneous. A common practice to further process the raw data is to collect—at the beginning of an experiment—some basal rates and compare those to the rates when a compound is added (McConnell et al. 1992). To allow quantitative data analysis the EAR and OUR are given in mV/h. It is notable that the drift affects the absolute values of the microsensors, however the sensitivity stays constant during the experiments. Methods to filter the drift out of the experimental data are given in Wiest et al. (2016).
Fig. 2.
a The IMOLA BioChips allows label-free and continuous measurements of cellular cultures on the chip. b The BioChip-D is presented with a detailed view of the sensor chip with the two pH sensors (pH1, pH2), two electric impedance sensors (Imp1, Imp2), one amperometric sensor (pO2), and one temperature sensor (T)
Fig. 6.
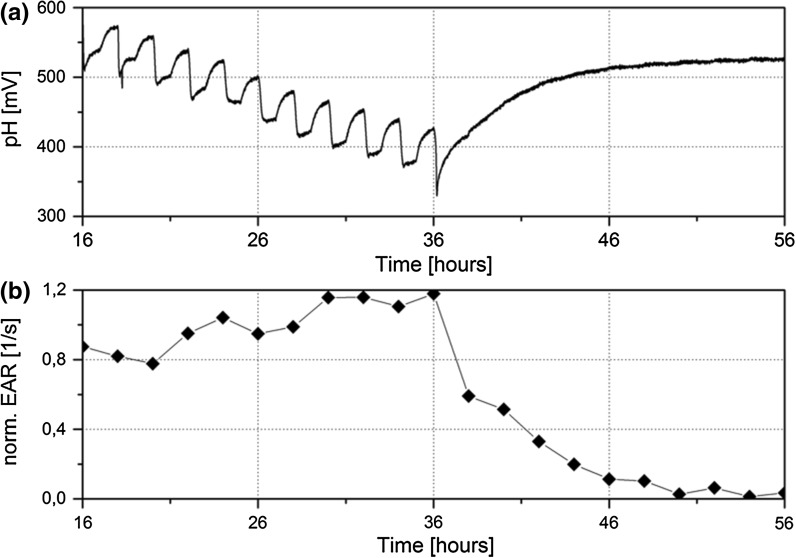
Exposure to sodium dodecyl sulphate (SDS) was performed to evaluate the ability for the system to perform real-time recording of changes due to toxic exposure. The applied pump cycle was 1 h on and 1 h off, and 1% SDS was added after 36 h. a Original pH signals and b the normalized extracellular acidification rate (EAR) indicate spheroid metabolism before SDS exposure. During pump off cycles, spheroids metabolism showed an increase in measured pH that corresponds with the acidification of the medium. Subsequent pump on cycles resulted in a return to basal pH levels. After the addition of 1% SDS solution this trend disappeared as cells no longer acidify the medium. EAR decreased over 10 h after SDS exposure and reached a base line afterwards
Fig. 7.
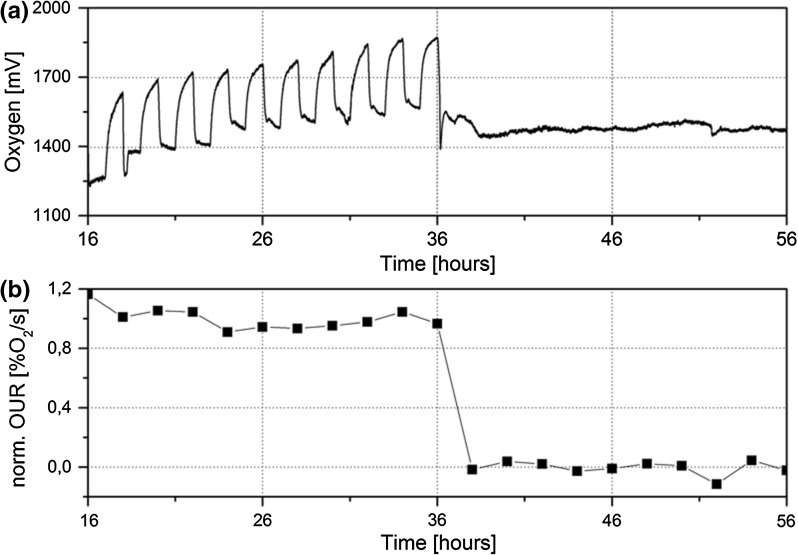
Oxygen consumption was monitored for nine HepG2 spheroids encapsulated on a single BioChip. The applied pump cycle was 1 h on and 1 h off, and 1% SDS was added after 36 h. Both a original oxygen signals and b the normalized oxygen uptake rate (OUR) indicated a base line before the SDS exposure and then an instant drop. Oxygen consumption increased during pump off phase and decreased instantly to a basal line in the pump on phase before SDS exposure. The addition of 1% SDS resulted in an instant toxic response, indicated by the decrease of the signal values and OUR. IMOLA oxygen sensors showed consistent consumption of oxygen by cells in spheroid morphologies. At the addition of SDS the consumption curves halted and OUR reached a base line after 2 h of SDS exposure
Prior to all experiments, the system tubing was disinfected by applying 70% ethanol for 20 min followed by a wash out with ddH2O for 20 min. Then, the flasks with the solutions were connected to the fluidic modules and a pre-filling was performed to remove air bubbles in the fluidic delivery system. Next, the incubation system was set to 37 °C 24 h prior the experiment. Pre-filling of the tubes was performed immediately before the experiment to remove the generated air bubbles due to the heating process. For disinfection, BioChips were treated for 20 min with UV irradiation under a laminar flow hood. Experimental settings were uploaded into the DALiA client 2.0 via IMOLA support module (ISM) and pump configuration files. Configuration files contain valve switching times and flow rates for optimal cellular viability and experimental exposure.
Spheroid encapsulation design and fabrication
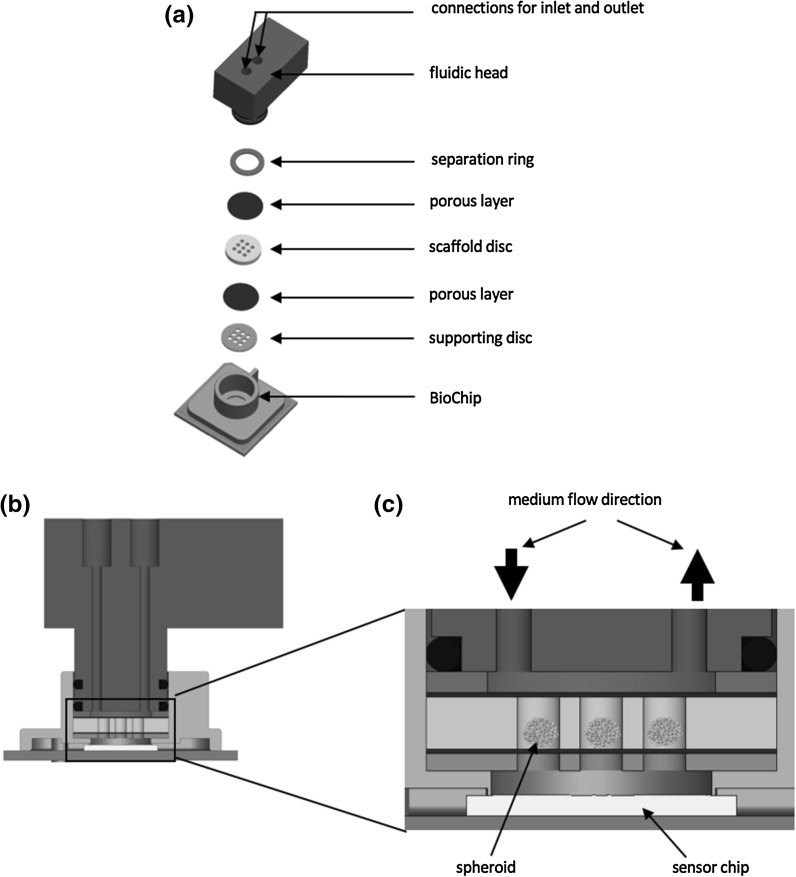
Previous experiments have shown that nine spheroids are a reasonable number to achieve gaugeable EAR and OUR in the micro reaction volume on the BioChip. So, a spheroid encapsulation was developed that allows long-term culture of up to nine spheroids on a single BioChip, which is capable of measuring extracellular acidification and dissolved oxygen. Therefore, a polylactic acid (PLA) disc with a 3 × 3 array of microwells was 3D printed with an Ultimaker 2 (Ultimaker BV, Geldermalsen, Netherlands) and incorporated onto BioChips to culture spheroids in individual microwell culture chambers (Fig. 3a–c). Nine microwells with a height of 1.5 mm and a diameter of 1.2 mm were designed for spheroid culture within these cavities. Integrated net filters with a mesh size of 120 μm (NY2H04700, Merck Millipore, Darmstadt, Germany) were placed above and below the spheroids to allow fluidic contact between spheroids in microwells and BioChip sensors while preventing wash out from medium perfusion. A supporting disc containing the same size and number of microwells was placed on the bottom of the housing ring, creating a chamber between the sensor chip and the supporting disc enabling the measurement of the cellular parameters. To minimize the diffusion length the supporting disc is oriented exactly as the scaffold disc. Finally, a separation ring is added below the fluidic head with the inlet and outlet. Prior to experimental use, printed prototype parts were disinfected in 70% ethanol for 20 min followed by two 10 min washing steps with sterile ddH2O water.
Fig. 3.
a To maintain spheroid cultures on the IMOLA system a new spheroid encapsulation was designed. The exploded view shows that the encapsulation consisting of a standard IMOLA fluidic head, a separation ring, a net filter membrane, a scaffold disc which houses nine spheroids, another net filter membrane and a support disc. b The assembly is stacked onto a standard IMOLA BioChip. c Medium is perfused through the fluidic head and the porous membrane shields cells from direct sheer forces, while allowing access to fresh medium
HepG2 culture and formation of HepG2 spheroids
The human hepatoma cell line HepG2 (ACC 180) was obtained from the German collection of microorganisms and cell cultures (DMSZ, Braunschweig, Germany). Cells were maintained in 2D monolayer cultures in 25 cm2 tissue culture flasks in RPMI-1640 culture medium supplemented with 10 μg/ml Gentamycin, 23.8 mM Sodium Bicarbonate and 10% heat-inactivated Fetal Bovine Serum (FBS). The cells were kept in an incubator at 37 °C at 95% relative humidity and 5% CO2. At 80–90% confluence, cells were passaged by removing the medium and washing with phosphate buffered saline (PBS). Cells were treated with 4 mL 0.05% Trypsin and 0.02% EDTA solution for 30 s at room temperature followed by removing the Trypsin/EDTA and incubation at 37 °C for 10 min. Afterwards, cells were removed from the bottom by gentle pipetting with 4 mL of serum-free culture medium. Cell counting was performed by mixing 10 μL cell suspension and 10 μL 0.4% Trypan blue (Thermo Fisher Scientific, Waltham, MA, USA) using a Countess II automated cell counter (Invitrogen GmbH, Darmstadt, Germany). For 2D monolayer culture, 300.000 cells were seeded into a new tissue culture flask with 4 mL culture medium. The medium was changed twice a week. All chemicals and solutions were purchased from Sigma-Aldrich Chemie GmbH (Taufkirchen, Germany) unless otherwise noted.
After cell counting, 200 μL with 1000 cells was pipetted into U-bottom 96-well plates with cell-repellent surface (650970, Greiner Bio-One International GmbH, Kremsmünster, Austria) and centrifuged at 1000×g for 5 min. The medium was changed daily by refreshing 50% of the culture volume during the first 4 days. The optimized growth protocol was previously developed by seeding 250, 500, 1000, 2000, 4000, and 8000 cells per spheroid and characterized using a quantitative image analysis based on ImageJ (Eggert et al. 2017).
Characterization of flow and sensor dynamics
Fluid flow experiments were conducted for the newly designed spheroid encapsulation to evaluate the effect of net filter placement on pH and impedance sensor response and stabilization time. Two separate PBS standards, PBS 1 and PBS 2, with distinct osmolarity and pH values were tested in a pre-programmed flow sequence where solutions were perfused through the BioChip assemblies. The flow protocol consisted of 2 h of flow at 100 μL/min with PBS 1 (osmolarity: 300 mOsm/kg; pH: 7.4) followed by 2 h of flow with PBS 2 (osmolarity: 600 mOsm/kg; pH: 6.4) at the same speed. The signals were monitored for at least 24 h. For characterization studies of flow and sensor dynamics, three independent experiments (n = 3) were performed using the developed microwell system with nine spheroids.
On-chip spheroid culture and metabolic monitoring
On-chip spheroid culture with the designed encapsulation array was performed with previously cultured spheroids. Feasibility studies were performed to assess the potential of performing metabolic monitoring of spheroids on the IMOLA-IVD and to select the optimal pump cycle for maximum sensor response. For on-chip monitoring, single spheroids cultured using the optimized growth protocol were pipetted into microwells for live monitoring experiments. Nine previously cultured spheroids were pipetted manually into microwells located on the scaffold disc, positioned on BioChip. Each spheroid was transferred in a single pipetting procedure into the microwells until each microwell contained one spheroid. Subsequently, the successful pipetting of spheroids into microwells was analyzed with a microscope. Three independent experiments (n = 3) were performed for the metabolic monitoring of nine spheroids embedded in microwells with the IMOLA-IVD platform. Metabolic monitoring of HepG2 spheroids was performed with an applied pump cycle of 1 h on and 1 h off (1 h ON/OFF) and 30 min on and 30 min off (30 min ON/OFF). The applied pump cycle was 1 h ON/OFF for the first 25 h followed by a pump cycle of 30 min ON/OFF for further 24 h. Culture medium was pumped at 100 μL/min during the pump ON phases. Extracellular acidification was recorded every 5 s via BioChips during the pump OFF as well as ON phases.
Exposure to sodium dodecyl sulphate
As a proof-of-concept study, sodium dodecyl sulphate (SDS), an anionic surfactant, was added to the spheroids embedded on the BioChip in order to determine its toxic effect on cell metabolism. SDS is commonly used as a positive control in standard cytotoxic assays, such as the Cytosensor Microphysiometer Toxicity Test (Hartung et al. 2010). For the exposure to SDS, the previously described set-up and preparation was used for the spheroids and the encapsulation. For the first 10 h, unbuffered culture medium was continually pumped at 100 μL/min, and afterwards cycled between 1 h pump on and 1 h pump off. After 36 h, medium containing 1% SDS was added as a positive control using the same pump protocol for another 24 h. Extracellular acidification and oxygen consumption were recorded every 5 s via BioChips.
Data processing in cellular microphysiometry
Data processing was performed in order to extract the extracellular acidification rate (EAR) and oxygen uptake rate (OUR) from the recorded signals during the exposure to SDS. EAR and OUR were calculated for 20 h before SDS application (experiment time: 16–36 h) and then for 20 h afterwards (experiment time: 36–56 h) for one experimental set-up. The gradient was extracted by simple linear regression via a proprietary R-script. Further information regarding data processing in cellular microphysiometry can be found in Wiest et al. (2016).
Results and discussion
Results of flow characterization studies
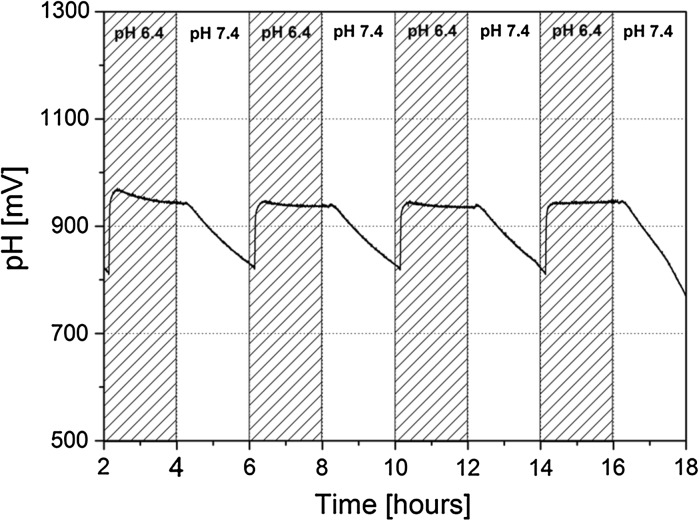
To evaluate the impact of the modified measurement chamber on sensor response, chips were assembled without spheroids and subjected to flow tests with PBS standard solutions. Two separate PBS standards, PBS 1 and PBS 2, with distinct osmolarity and pH values were tested in a pre-programmed flow sequence where solutions were perfused through the BioChip assemblies. The aforementioned flow protocol consisted of 2 h of flow at 100uL/min with PBS 1 (osmolarity: 300 mOsm/kg; pH: 7.4) followed by 2 h of flow with PBS 2 (osmolarity: 600 mOsm/kg; pH: 6.4) at the same speed. This protocol was first performed on the standard BioChip assembly with the original encapsulation, as reported in Weiss et al. (2013), and then repeated for the new spheroid encapsulation.
In the original encapsulation, the reaction chamber is limited to a volume of 6 µL. This results in complete solution replacement after around 4 s of pumping. As a result, the on-chip pH sensors respond very rapidly to the change of PBS solution. Stable pH values are reached within 200 s of switching after the solution comes in contact with the sensors. The incorporation of a multi-layered spheroid encapsulation assembly has a marked effect on the sensor response time, as it can be seen in Fig. 4. It is important to note that the total reaction chamber volume increases to around 40 µL in the new assembly. This slows the sensor response when switching between fluids. Additionally, the presence of the net filter alters the normal flow behaviour within the chamber and acts as a barrier to the sensor surface. For the developed encapsulation design with the nylon net of 120 μm, a steady state is reached for PBS 2 (pH 6.4) but not with PBS1. This is possibly due to poor mixing of the two PBS solutions at the given flow rate. However, it is notable that after the allotted flow time, measured pH values return to reproducible levels allowing the user to calibrate a measured change in pH based on the start value (adjusting for sensor drift).
Fig. 4.
Fluid flow conditions were tested for the new spheroid encapsulation design without cell. As the pH solution is switched between values of 6.4 and 7.4, the measured voltage fluctuates as well. Steady state values are reached for pH values of 6.4 whereas a dedicated drop in signal is seen when switching to pH values of 7.4
On-chip spheroid culture and metabolic monitoring
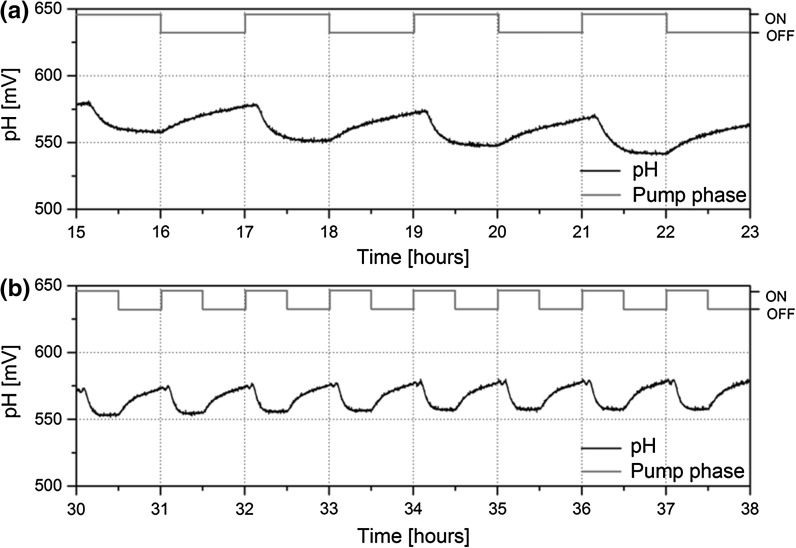
Finally, mature spheroids grown using the optimized protocol were placed on several different chips and the feasibility of extended culture and pH monitoring was tested via perfusion pumping of unbuffered culture medium. Nine spheroids were embedded into the printed microwell cavities for observation of pH fluctuations. Figure 5 shows a comparison of the pH voltage signal between the 1 h ON/OFF (Fig. 5a) and 30 min ON/OFF (Fig. 5b).
Fig. 5.
The extracellular pH of HepG2 spheroids was monitored with the developed spheroid encapsulation design with an applied pump cycle of a 1 h on and 1 h off and b 30 min on and 30 min off. Changes in pH signal are presented in mV (black), and the pump phase is presented with on or off (blue). An increase in pH signal during the pump off phase was observed for both pump set-ups. During the pump on phase, the pH signal decreased to a basal line. (Color figure online)
The pH signal indicated an acidification of the medium during the off phase for both pump set-ups, indicating metabolic activity occurring within spheroids immobilized on the chips. For the 1 h cycle, an EAR of 24 mV/h (± 4) was measured for nine spheroids embedded on the BioChip. When the pump was set on during the 1 h cycle, the pH signal decreased by 28–32 mV within 30 min and drifted gradually downwards by 3–5 mV/h for 30 more minutes. When the pump cycled between 30 min on and 30 min off, the EAR increased to 39 mV/h (± 2). Commonly, pH signals indicate a reduction of cellular metabolism over the longer pump off intervals, and the pH signal drifted towards an asymptote. Cells reduce their metabolic rate in response to being in an acidic environment, as cells detect their waste products are building up around them.
During the off cycle, the build-up of metabolic waste within the chamber, close to the surface of the pH sensors, causes a decrease in the measured pH between the medium in the chamber and the reference electrode contained within fluidic lines. During the subsequent pump on cycle, fresh medium is pumped through the tubes and mixed with used medium within the measurement chamber. Because the chamber is divided into several compartments by the porous membrane layers and the spheroid cavity array, time is needed for the diffusion of fresh medium throughout each distinct chamber. This process is limited by the size of the membrane pore size, the medium flow speed and viscosity. In addition, the spheroids itself might hinder the fluid exchange between the channel above and the sensor beneath.
Exposure to sodium dodecyl sulphate
Unbuffered RPMI-1640 supplemented with 1% SDS was applied as a positive control to spheroids after 36 h to lyse cells and halt metabolic activity. Prior to the addition of medium with 1% SDS, acidification of the medium was monitored during 1 h off phase. For spheroids embedded on the nylon net, the pH signal increased instantly when the pump was set off by 55–65 mV within 18–24 min, and then drifted upwards by 4–10 mV/h (Fig. 6a). The pH signal increased by an EAR of 38 mV/h (± 5) within the 1 h off phase (Table 1). When the pump was set on, the pH signal reacted immediately and decreased to a basal line. The application of 1% SDS caused a decrease of around 100 mV followed by an EAR of 8 mV/h (± 8) in the subsequent pump off phases. After 14 h of SDS application, the pH signal reached a plateau and drifted upwards by 1 mV/h for the next 10 h until the experiment was stopped. The pH drift upwards after the SDS application is due to change in the pH value, as post experiment pH measurements revealed a pH value of 7.41 for the RPMI-1640 and a pH value of 7.32 for the RPMI-1640 supplemented with 1% SDS. Normalized EAR indicated a similar trend to the original pH signals (Fig. 6b).
Table 1.
Calculated extracellular acidification rate (EAR) and oxygen uptake rate (OUR) before and after exposure to sodium dodecyl sulphate (SDS)
| Before SDS | After SDS | |
|---|---|---|
| EAR | 38 mV/h (± 5) | 8 mV/h (± 8) |
| OUR | 308 mV/h (± 22) | −2 mV/h (± 13) |
The addition of 1% SDS followed by the toxic response was also recorded for the oxygen signal. Figure 7a shows the oxygen consumption before and after SDS addition. During the perfusion without SDS, the oxygen signal increased by 283–324 mV within the 1 h pump off phase and an OUR of 308 mV/h (± 21) was calculated (Table 1). When the pump was set on, the signal changed instantly and decreased by 245–289 mV within 18–22 min followed by a drift downwards. The addition of 1% SDS caused an instant decrease of 473 mV within 11.5 min. Afterwards, no changes in the signal values were measured during the pump off phase, indicating that no more oxygen was consumed. The OUR after exposure to SDS decreased to −2 mV/h (± 13). After SDS exposure the normalized OUR decreased within one pump cycle to a base line (Fig. 7b).
The recorded temperature data do not show any metabolic activity. Also the impedance values do not show spheroid activity however, lower impedance values are recorded when the anionic SDS is added. Schmid et al. (2016) reported that—with a different electrode geometry—it is possible to measure electrical impedance on spheroids.
Conclusion
In conclusion, time-resolved, label-free measurements of multicellular spheroid metabolism were recorded by monitoring their rates of extracellular acidification and oxygen consumption using the IMOLA-IVD with a defined tissue encapsulation. Historically, end-point assays, which require redundant sampling for long-term studies, have been used for in vitro toxicity studies. However, the chemical labels used during these tests can alter metabolic function, producing false toxicity results. In the presented work, we demonstrated a method to overcome that drawback by replacing chemical labels with BioChip-based electrochemical sensors to preserve the native function of spheroids which is essential for an accurate assessment of toxicity. Moreover, passive sensing techniques extend the amount of data that can be obtained from a single sample.
The presented work tested a novel encapsulation design using a membrane barrier material. Flow characterization using PBS standards of different pH and osmolarity values illustrated the functionality of the system by showing almost instantaneous pH sensor response times to acidification when switching between PBS solutions for the novel lab-on-chip platform for spheroid metabolism monitoring. The pipetting and culture of nine spheroids in an array of 3 × 3 microwells demonstrated an innovative embedding solution on BioChips, enabling the measurement of metabolic activity throughout the experiment. The addition of SDS to the medium served to lyse cells, halted cellular oxygen consumption and disrupted basal extracellular acidification signalling received by the pH sensors.
Finally, the present study is a first approach to establish a next generation “spheroid-on-chip” assay platform based on label-free, real-time monitoring of multicellular spheroids for in vitro toxicity testing and can be utilized for extended profiling of candidate drugs on 3D target in vitro models. In contrast with currently available approaches, the developed microphysiometer platform has the advantage of being able to record real-time kinetics during toxic response. Furthermore, high reproducibility can be achieved through automation of the IMOLA-IVD. In conclusion, the presented system provides a “ready-to-use” platform for further toxicology testing, paving the way towards more accurate predictions in drug safety and efficacy in the future.
Acknowledgements
F. Alexander would like to thank the Whitaker International Program for their financial support of this work. The authors would also like to thank the Deutscher Tierschutzbund—Akademie für Tierschutz (German Animal Welfare Federation—Animal Welfare Academy).
References
- Abu-Absi SF, Friend JR, Hansen LK, Hu W-S. Structural polarity and functional bile canaliculi in rat hepatocyte spheroids. Exp Cell Res. 2002;274:56–67. doi: 10.1006/excr.2001.5467. [DOI] [PubMed] [Google Scholar]
- Alépée N, Alepee N, Bahinski A, et al. State-of-the-art of 3D cultures (organs-on-a-chip) in safety testing and pathophysiology. Altex. 2014;31:441–477. doi: 10.14573/altex1406111. [DOI] [PMC free article] [PubMed] [Google Scholar]
- Alexander F, Wiest J. Automated transepithelial electrical resistance measurements of the EpiDerm reconstructed human epidermis model. Conf Proc IEEE Eng Med Biol Soc. 2016;2016:469–472. doi: 10.1109/EMBC.2016.7590741. [DOI] [PubMed] [Google Scholar]
- Astashkina A, Grainger DW. Critical analysis of 3-D organoid in vitro cell culture models for high-throughput drug candidate toxicity assessments. Adv Drug Deliv Rev. 2014;69–70:1–18. doi: 10.1016/j.addr.2014.02.008. [DOI] [PubMed] [Google Scholar]
- Bale SS, Vernetti L, Senutovitch N, et al. In vitro platforms for evaluating liver toxicity. Exp Biol Med. 2014;239:1180–1191. doi: 10.1177/1535370214531872. [DOI] [PMC free article] [PubMed] [Google Scholar]
- Baras ASAI, Baras ASAI, Schulman KA. Drug development risk and the cost of capital. Nat Rev Drug Discov. 2012;11:347–348. doi: 10.1038/nrd3722. [DOI] [PubMed] [Google Scholar]
- Brischwein M, Grothe H, Wiest J, Zottmann M, Ressler J, Wolf B. Planar ruthenium oxide sensors for cell-on-a-chip metabolic studies. Chem Anal-Wars. 2009;54:1193–1201. [Google Scholar]
- Edmondson R, Broglie JJ, Adcock AF, Yang L. Three-dimensional cell culture systems and their applications in drug discovery and cell-based biosensors. Assay Drug Dev Technol. 2014;12:207–218. doi: 10.1089/adt.2014.573. [DOI] [PMC free article] [PubMed] [Google Scholar]
- Eggert S, Alexander F, Wiest J. An automated microphysiological assay for toxicity evaluation. Conf Proc IEEE Eng Med Biol Soc. 2015;2015:2175–2178. doi: 10.1109/EMBC.2015.7318821. [DOI] [PubMed] [Google Scholar]
- Eggert S, Alexander F, Wiest J. Enabling 3D hepatocyte spheroids for microphysiometry. Conf Proc IEEE Eng Med Biol Soc. 2017;2017:1617–1620. doi: 10.1109/EMBC.2017.8037148. [DOI] [PubMed] [Google Scholar]
- Eklund SE, Taylor D, Kozlov E, et al. A microphysiometer for simultaneous measurement of changes in extracellular glucose, lactate, oxygen, and acidification rate. Anal Chem. 2004;76:519–527. doi: 10.1021/ac034641z. [DOI] [PubMed] [Google Scholar]
- Hartung T, Bruner L, Curren R, et al. First alternative method validated by a retrospective weight-of-evidence approach to replace the Draize eye test for the identification of non-irritant substances for a defined applicability domain. Altex. 2010;27:43–51. doi: 10.14573/altex.2010.1.43. [DOI] [PubMed] [Google Scholar]
- Huh D, Torisawa Y, Hamilton GA, et al. Microengineered physiological biomimicry: organs-on-chips. Lab Chip. 2012;12:2156–2164. doi: 10.1039/c2lc40089h. [DOI] [PubMed] [Google Scholar]
- Kang LF, Chung BG, Langer R, Khademhosseini A. Microfluidics for drug discovery and development: from target selection to product lifecycle management. Drug Discov Today. 2008;13:1–13. doi: 10.1016/j.drudis.2007.10.003. [DOI] [PMC free article] [PubMed] [Google Scholar]
- Kelm JM, Fussenegger M. Microscale tissue engineering using gravity-enforced cell assembly. Trends Biotechnol. 2004;22:195–202. doi: 10.1016/j.tibtech.2004.02.002. [DOI] [PubMed] [Google Scholar]
- Kola I, Landis J. Can the pharmaceutical industry reduce attrition rates? Nat Rev Drug Discov. 2004;3:711–716. doi: 10.1038/nrd1470. [DOI] [PubMed] [Google Scholar]
- Lee M-Y, Park CB, Dordick JS, Clark DS. Metabolizing enzyme toxicology assay chip (MetaChip) for high-throughput microscale toxicity analyses. Proc Natl Acad Sci USA. 2005;102:983–987. doi: 10.1073/pnas.0406755102. [DOI] [PMC free article] [PubMed] [Google Scholar]
- Marx U, Andersson TB, Bahinski A, et al. Biology-inspired microphysiological system approaches to solve the prediction dilemma of substance testing. Altex. 2016;33:272–321. doi: 10.14573/altex.1603161. [DOI] [PMC free article] [PubMed] [Google Scholar]
- Matsusaki M, Case CP, Akashi M. Three-dimensional cell culture technique and pathophysiology. Adv Drug Deliv Rev. 2014;74:95–103. doi: 10.1016/j.addr.2014.01.003. [DOI] [PubMed] [Google Scholar]
- McConnell HM, Owicki JC, Parce JW, et al. The cytosensor microphysiometer: biological applications of silicon technology. Science. 1992;257:1906–1912. doi: 10.1126/science.1329199. [DOI] [PubMed] [Google Scholar]
- Mehta G, Hsiao AY, Ingram M, et al. Opportunities and challenges for use of tumor spheroids as models to test drug delivery and efficacy. J Control Release. 2012;164:192–204. doi: 10.1016/j.jconrel.2012.04.045. [DOI] [PMC free article] [PubMed] [Google Scholar]
- Mueller D, Krämer L, Hoffmann E, et al. 3D organotypic HepaRG cultures as in vitro model for acute and repeated dose toxicity studies. Toxicol Vitr. 2014;28:104–112. doi: 10.1016/j.tiv.2013.06.024. [DOI] [PubMed] [Google Scholar]
- Ramaiahgari SC, den Braver MW, Herpers B, et al. A 3D in vitro model of differentiated HepG2 cell spheroids with improved liver-like properties for repeated dose high-throughput toxicity studies. Arch Toxicol. 2014;88:1083–1095. doi: 10.1007/s00204-014-1215-9. [DOI] [PubMed] [Google Scholar]
- Rubin EH, Gilliland DG. Drug development and clinical trials—the path to an approved cancer drug. Nat Rev Clin Oncol. 2012;9:215–222. doi: 10.1038/nrclinonc.2012.22. [DOI] [PubMed] [Google Scholar]
- Schmid YRF, Bürgel SC, Misun PM, et al. Electrical impedance spectroscopy for microtissue spheroid analysis in hanging-drop networks. ACS Sens. 2016;1:1028–1035. doi: 10.1021/acssensors.6b00272. [DOI] [PMC free article] [PubMed] [Google Scholar]
- Soldatow VVY, Lecluyse ELEEL, Griffith LLG, Rusyn I. In vitro models for liver toxicity testing. Toxicol Res (Camb) 2013;2:23–39. doi: 10.1039/C2TX20051A. [DOI] [PMC free article] [PubMed] [Google Scholar]
- Wang P, Xu G, Qin L, et al. Cell-based biosensors and its application in biomedicine. Sens Actuators B Chem. 2005;108:576–584. doi: 10.1016/j.snb.2004.11.056. [DOI] [Google Scholar]
- Waring MJ, Arrowsmith J, Leach AR, et al. An analysis of the attrition of drug candidates from four major pharmaceutical companies. Nat Rev Drug Discov. 2015;14:475–486. doi: 10.1038/nrd4609. [DOI] [PubMed] [Google Scholar]
- Weiss D, Brischwein M, Grothe H, et al. Label-free monitoring of whole cell vitality. Conf Proc IEEE Eng Med Biol Soc. 2013;2013:1607–1610. doi: 10.1109/EMBC.2013.6609823. [DOI] [PubMed] [Google Scholar]
- Weltin A, Slotwinski K, Kieninger J, et al. Cell culture monitoring for drug screening and cancer research: a transparent, microfluidic, multi-sensor microsystem. Lab Chip. 2014;14:138–146. doi: 10.1039/C3LC50759A. [DOI] [PubMed] [Google Scholar]
- Weltin A, Hammer S, Noor F, et al. Accessing 3D microtissue metabolism: lactate and oxygen monitoring in hepatocyte spheroids. Biosens Bioelectron. 2017;87:941–948. doi: 10.1016/j.bios.2016.07.094. [DOI] [PubMed] [Google Scholar]
- Wen Y, Yang S-T. The future of microfluidic assays in drug development. Expert Opin Drug Discov. 2008;3:1237–1253. doi: 10.1517/17460441.3.10.1237. [DOI] [PubMed] [Google Scholar]
- Wiest J, Namias A, Pfister C, et al. Data processing in cellular microphysiometry. IEEE Trans Biomed Eng. 2016;63:2368–2375. doi: 10.1109/TBME.2016.2533868. [DOI] [PubMed] [Google Scholar]
- Wilkening S, Stahl F, Bader A. Comparison of primary human hepatocytes and hepatoma cell line HepG2 with regard to their biotransformation properties. Drug Metab Dispos. 2003;31:1035–1042. doi: 10.1124/dmd.31.8.1035. [DOI] [PubMed] [Google Scholar]


