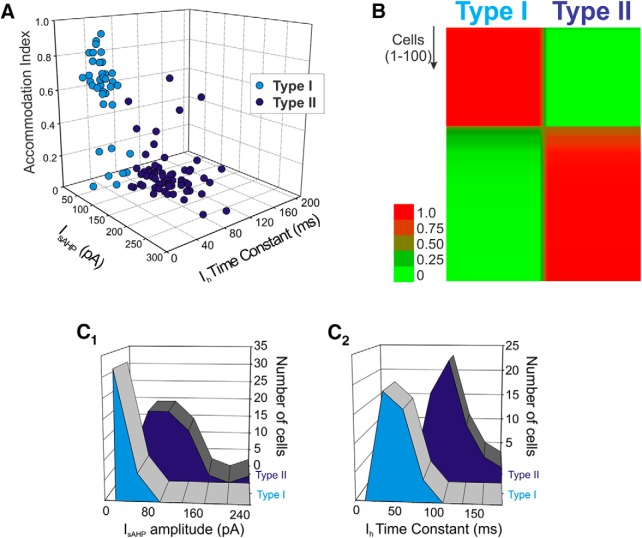
Figure 2.
Sorting of L5 pyramidal cells. A, Plotting the amplitude of IsAHP, the time constant of Ih and the AI cluster the cells in our sample into what appear to be two largely nonoverlapping subsets. B, Autoclass, an unsupervised Bayesian classifier, also sorted the cells in our sample into two classes with the vast majority of cells sorting unambiguously to one of the two classes. The heat map depicts the probability that each cell tested in the current sample belongs to the type I or the type II classes. Probability is color-coded in a green-red scale as indicated in the side bar. After sorting, type I and type II cells, considered as groups, can be seen to differ in terms of the amplitude distribution for IsAHP (C1) and the distribution of time constant for Ih (C2). C1-C2: n = 100 cells.

