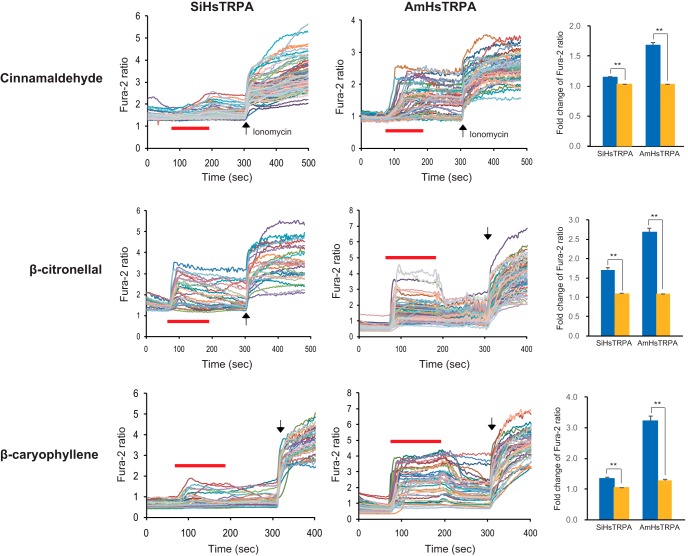
Figure 3.
Activation of both SiHsTRPA and AmHsTRPA by three plant-derived compounds. Activation of both SiHsTRPA and AmHsTRPA by cinnamaldehyde, β-citronellal, and β-caryophyllene was analyzed by calcium imaging. Red bars show the period when each compound was added, and then washed off. Arrows show the time points when ionomycin was added. The concentration of each compound tested was 1 mm. The mean value of fold change of Fura-2 ratio with error bar (± SEM) is shown for the compound-stimulated DsRed-positive (blue) and DsRed-negative (yellow) cells expressing SiHsTRPA or AmHsTRPA. The total numbers of cells analyzed were 70–206. **, Significant difference by one-tailed Welch’s t test (P < 0.001).

