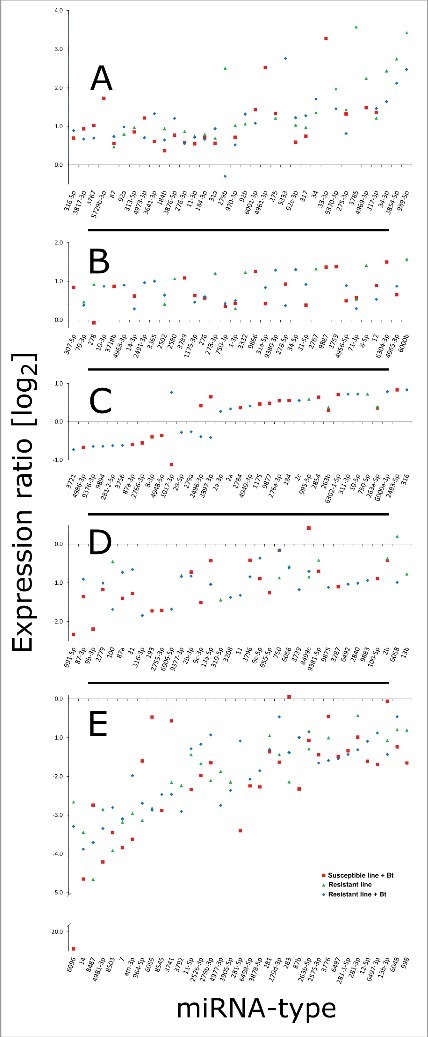
Figure 6.

Distribution of expressed miRNAs in the midgut of Bt-resistant and susceptible G. mellonella larvae infected with Bt. The miRNA sequences were obtained from miRBase v21 and their expression profiles were determined by microarray analysis. The figure (A-E) represent significantly expressed miRNAs in infected susceptible and resistant larvae, and uninfected resistant larvae. The fold differences are expression levels relative to uninfected susceptible larvae.
