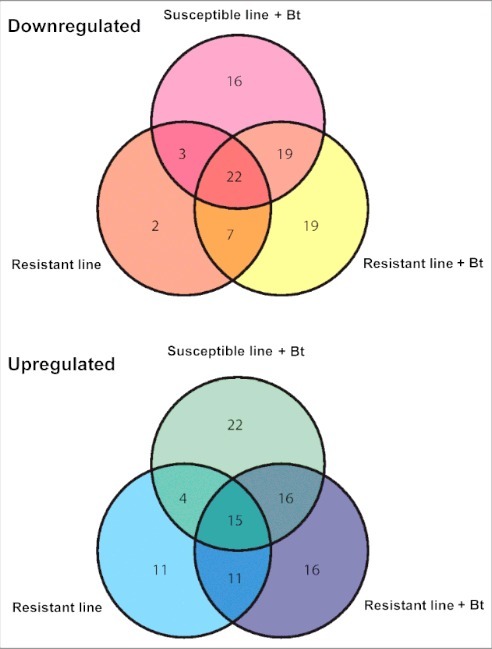
Figure 7.

Venn diagram showing the differential expression of miRNAs in the midgut of infected and uninfected Bt-resistant or susceptible G. mellonella larvae. The miRNA sequences were obtained from miRBase v21 and their expression profiles were determined by microarray analysis. The fold differences of downregulated and upregulated miRNAs are shown relative to uninfected susceptible G. mellonella larvae (p < 0.01).
