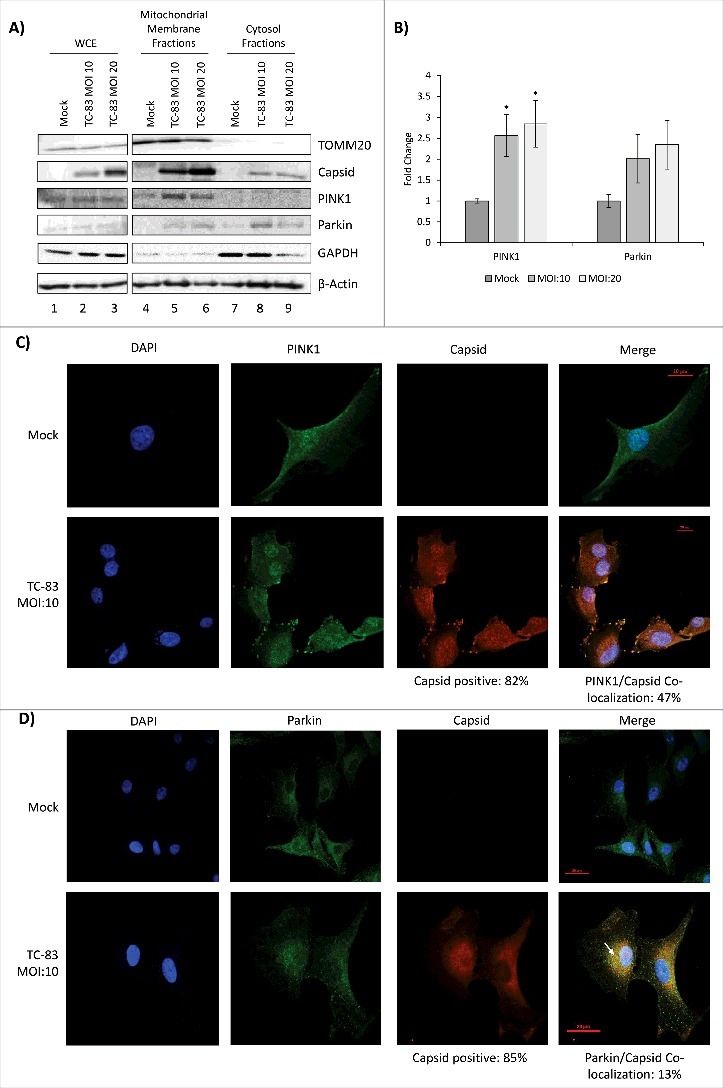
Figure 5.

PINK1 and Parkin co-localize in the mitochondrial membrane of TC-83 infected cells. (A) Western blot analysis of whole cell extract (WCE) and subcellular fractions from uninfected (mock) and TC-83 infected cells. Infection control: capsid; mitochondrial marker: TOMM20; cytosolic marker: GAPDH; β-actin: protein loading control. (B) PINK1 and Parkin mitochondrial membrane band intensities analyzed by Quantity One software. * indicates significance between infected and mock PINK1 quantities. (C) Confocal images showing co-localization of PINK1 (green) and VEEV capsid (red). (D) Confocal images showing partial co-localization of Parkin and VEEV capsid (red) (C-D) Nuclei stained with DAPI (blue). Scale bars indicate 20µm.
