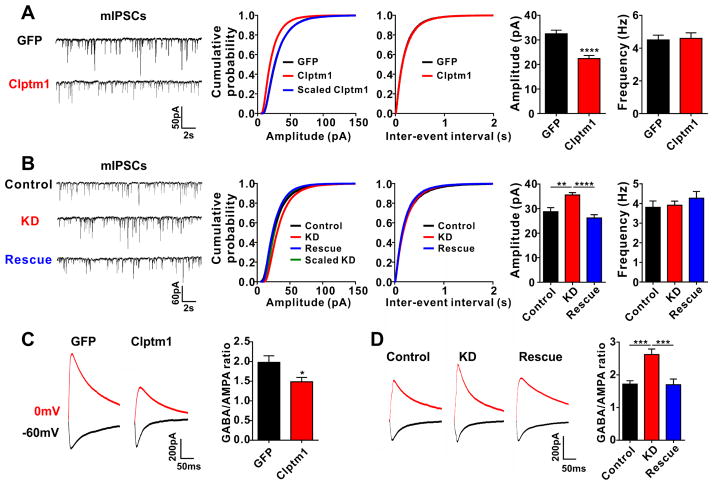
Figure 6. Clptm1 Modulates Inhibitory Synaptic Transmission in Vivo.
Neonatal mice were injected with AAV vectors to alter Clptm1 expression and electrophysiological recordings were performed on CA1 neurons expressing the fluorescent protein markers in acute brain slice at P14–17.
(A) Overexpression of YFP-p2a-Clptm1 (Clptm1) significantly reduced mIPSC amplitude compared with control group expressing GFP. n=24–25 cells from 2 mice, **** p<0.0001, t-test. The cumulative probability curve of Clptm1 amplitude was scaled by dividing by a factor of 0.73. K-S test showed no significant difference between control and scaled Clptm1 groups.
(B) Groups were co-injected with AAV-U6-shScramble-hSyn-Tdtomato and AAV-hSyn-GFP as control, AAV-U6-shClptm1-hSyn-Tdtomato and AAV-hSyn-GFP as knockdown (KD), or AAV-U6-shClptm1-hSyn-Tdtomato and AAV-hSyn-YFP-p2a-Clptm1* as rescue. Recordings were collected from Tdtomato and GFP or YFP dual positive CA1 pyramidal neurons. Knockdown of Clptm1 significantly increased mIPSC amplitude compared with the control group, an effect rescued by the shRNA-resistant Clptm1*. n=28 cells from 3–4 mice, p<0.0001 one-way ANOVA and ** p<0.01, **** p<0.0001 post hoc Holm-Sidak tests. The cumulative probability curve of KD amplitude was scaled by dividing by a factor of 1.16. K–S test showed no significant difference between control and scaled KD groups.
(C and D) The GABA/AMPA ratio was recorded in hippocampal CA1 pyramidal neurons by stimulating the Schaffer collateral-commissural fibers and holding the cells at 0 mV for GABAAR currents and −60 mV for AMPAR currents. The GABA/AMPA ratio was significantly reduced in neurons overexpressing Clptm1 (C, n=23–25 cells from 2–3 mice, * p<0.05, t-test). Knockdown of Clptm1 elevated the GABA/AMPA ratio, and co-expressing the shRNA-resistant Clptm1* restored the GABA/AMPA ratio to control level (D, n=23–27 cells from 2–3 mice, p<0.05 one-way ANOVA and *** p<0.001 post hoc Holm-Sidak tests).
Results are expressed as mean ± SEM.

