

Auditory-motor neural synchronization during perception is restricted to a narrow frequency range and enhanced at ~4.5 Hz.
Abstract
The relation between perception and action remains a fundamental question for neuroscience. In the context of speech, existing data suggest an interaction between auditory and speech-motor cortices, but the underlying mechanisms remain incompletely characterized. We fill a basic gap in our understanding of the sensorimotor processing of speech by examining the synchronization between auditory and speech-motor regions over different speech rates, a fundamental parameter delimiting successful perception. First, using magnetoencephalography, we measure synchronization between auditory and speech-motor regions while participants listen to syllables at various rates. We show, surprisingly, that auditory-motor synchrony is significant only over a restricted range and is enhanced at ~4.5 Hz, a value compatible with the mean syllable rate across languages. Second, neural modeling reveals that this modulated coupling plausibly emerges as a consequence of the underlying neural architecture. The findings suggest that the temporal patterns of speech emerge as a consequence of the intrinsic rhythms of cortical areas.
INTRODUCTION
The relation between perception and action has been investigated extensively in neuroscience and psychology. A prominent example comes from speech. One line of study has yielded converging evidence: There exists a mechanistic, causal link between the speech-motor output systems and the auditory perceptual systems that underpin the monitoring and guidance of speech-motor control (1–6).
Controversy arises concerning the role of speech-motor cortex in perception. Much evidence documents a link between perceptual and motor systems: (i) During the processing of speech (4, 5), especially in the presence of noise (7), speech-motor areas are active; (ii) transcranial magnetic stimulation of motor cortex interferes with phonological discrimination tasks (8–10); and (iii) induced mechanical modifications of vocal tract articulators influence speech perception in adults (11) and infants (12).
Debating the putative functional role of the motor system for speech perception may have masked questions about how these regions are linked in the first place. There is a lack of a biophysical description of the neural network underlying the link between motor and auditory brain regions. Our neurophysiological data provide a new perspective. To test a possible mechanistic link, we exploit the concept of synchrony (13) between auditory and speech-motor regions.
Auditory cortex activity entrains to speech faithfully (14, 15), and this neural-to-speech signal synchronization is necessary to produce representations that yield intelligible speech (16–19). Neural entrainment is especially prominent in the theta band (4 to 7 Hz).
Is coupling between acoustic stimuli and auditory cortical activity linked to the sensorimotor machinery? Recent results using electrophysiology provide first steps in elucidating how synchronization can play a role in facilitating communication across regions during speech (20, 21). Interareal synchrony might support sensorimotor integration; however, the key properties have not been characterized, in particular the sensitivity to syllable rate, arguably the most fundamental property of speech perception and production.
Here, we identify an architectural constraint of the auditory-motor circuitry for speech from the viewpoint of synchrony. Using magnetoencephalography (MEG), we measure how coupling between auditory and motor regions, identified in individual participants’ brains, is modulated while the participants listen to syllables presented at various rates. We show that coupling, quantified as interareal neural synchrony, is only significant over a restricted range, showing a specific enhancement at ~4.5 Hz, a value that aligns closely with the mean syllable rate across languages (22). Modeling reveals that such restricted synchronization could emerge as a consequence of the underlying neural architecture and provides evidence for an intrinsic speech-motor rhythm.
RESULTS
We designed an MEG protocol to characterize sensorimotor integration in speech processing as a function of syllable rate. Participants were presented with a set of audio trials, consisting of trains of synthesized syllables played at different rates, while their brain activity was recorded. The signals originating in auditory and speech-motor cortices, derived from the raw magnetic field, were then submitted to further analyses.
Seventeen individuals participated; each completed two speech-based localizer conditions and then listened to the different auditory conditions of interest. Each stimulus consisted of 3 s of silence (baseline) followed by 6 s of syllable repetition. Syllables were repeated at five different rates: 2.5, 3.5, 4.5, 5.5, and 6.5 syllables/s (Fig. 1A). To insure the participants’ attention to the stimuli, after each trial, they indicated whether a given target syllable was present (fig. S1 displays the behavioral performance).
Fig. 1. Extracting motor and auditory cortex activity while perceiving speech.
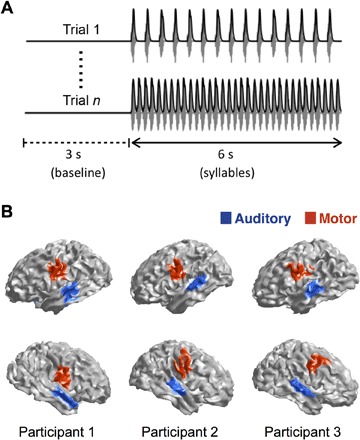
(A) Two examples of the experimental trials. Gray, sound wave; black, its envelope. The upper trial shows a syllable rate of 2.5 Hz, and the lower trial shows a syllable rate of 6.5 Hz. (B) Functional localizations of speech-motor (red) and auditory (blue) regions for three participants. Top row, left hemisphere; bottom row, right hemisphere.
To extract the time series of the activity generated in specific cortical areas, the participants first performed independent auditory and motor localizer tasks during the MEG session (see Materials and Methods). In addition, each participant’s structural magnetic resonance image (MRI) was obtained, and we used source reconstruction techniques [minimum norm estimation (MNE)] to generate a reliable localization of bilateral auditory and speech-motor areas for each participant (Fig. 1B and fig. S2). Finally, time series were obtained of the activity elicited in the main experiment (syllable presentation) in the localized areas of interest (see Materials and Methods).
Activity in auditory cortices synchronizes to the speech envelope across rates
The experiment capitalizes on the well-established finding of entrainment of auditory cortical activity to the envelope of speech, resulting in an enhancement of brain-stimulus synchrony for frequencies around the perceived syllable rate (14, 15, 17, 19). To confirm that the present data replicated this effect and to explore whether entrainment was modulated by syllable rate, we computed the phase locking values (PLVs) between auditory cortex time series and the speech envelopes (see Materials and Methods).
A first characterization of the data revealed, as expected, an enhanced synchronization of the neural signal to the speech envelope at the frequency corresponding to a given syllable rate (Fig. 2A). Each PLV plot shows a peak surrounding the rate of the stimulus (increment PLV relative to the 3-s duration baseline). To quantify this result, we computed the mean PLV, per condition and participant, around the perceived syllable rate (Fig. 2B; see Materials and Methods). First, for all five rate conditions, the PLV shows a significant increment from baseline [Wilcoxon signed-rank test, P < 0.01, corrected for false discovery rate (FDR)]. Note that, here, we display the average across hemispheres; the PLV for individual regions [right auditory (RA) and left auditory (LA) areas] did not contribute differentially (fig. S3). A Kruskal-Wallis test revealed a significant difference across conditions [χ2(4) = 15.18, P < 0.05]. This effect appears to be driven by the weaker response profile at the 6.5 syllable rate condition. A post hoc analysis comparing the central condition (4.5 syllables/s) against all others showed no statistical differences (Wilcoxon signed-rank test, P4.5,2.5 = 0.25, P4.5,3.5 = 0.72, P4.5,5.5 = 0.72, P4.5,6.5 = 0.16, FDR-corrected).
Fig. 2. Activity in auditory cortices synchronizes to the speech envelope across rates.
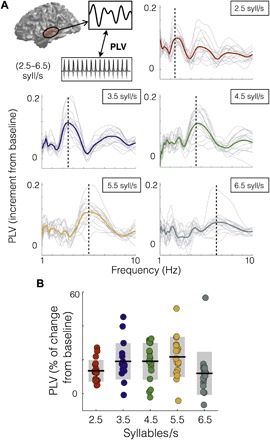
(A) Increment from baseline of PLV between auditory cortex and the envelope of the sound as a function of frequency. The panels correspond to different syllable rate conditions. Light gray lines, individual subject data; colored line, mean across subjects (red, 2.5 syllables/s; blue, 3.5 syllables/s; green, 4.5 syllables/s; yellow, 5.5 syllables/s; dark gray, 6.5 syllables/s). Vertical line, stimulus rate. (B) Mean PLV around the syllable rate of each condition (syllable rate ±0.5 Hz). Dots, individual participants; black lines, mean across participants; shadowed region, SD.
Synchronization between auditory and motor cortices reveals a preferred rate
We next examined the sensorimotor integration of speech. A range of studies implicate the activation of motor cortex while listening to syllables (5, 7, 23), but it is worth recalling that this putative sensorimotor linkage remains controversial. Here, we pursued a new perspective, testing the existence of phase synchronization between auditory and motor areas and asking, crucially, whether this synchronization is modified by different speech rates.
To address this question, we computed the PLV between the auditory cortex and speech-motor cortex time series for the different stimulus conditions. To control for artifactual cross-talk between anatomically proximal regions, we calculated the PLV between contralateral areas (Fig. 3A, top left; see Materials and Methods). The PLVs for right motor (RM)–LA and left motor (LM)–RA signals were calculated and averaged (both PLVs showed the same pattern as the average; fig. S4A). The synchronization between the auditory and speech-motor brain signals increased for the 2.5, 3.5, and 4.5 syllable/s conditions for frequencies around the corresponding stimulus rate. This was not observed for the higher rate conditions (Fig. 3A).
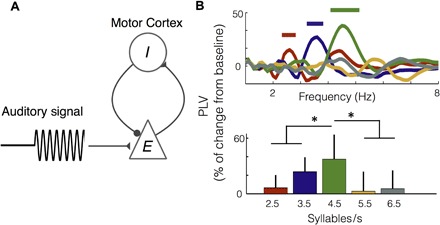
Fig. 3. Synchronization between auditory and motor cortices is modulated by the heard syllable rate.
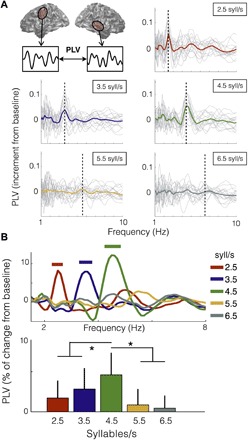
(A) Increment from baseline of PLV between auditory and motor cortex activity as a function of frequency. Top left, schematic of analysis. The data panels correspond to the different syllable rate conditions. Light gray lines, individual subject data; colored line, mean across participants (red, 2.5 syllables/s; blue, 3.5 syllables/s; green, 4.5 syllables/s; yellow, 5.5 syllables/s; dark gray, 6.5 syllables/s). Vertical dashed line, stimulus rate. (B) Top: Percent change from baseline of PLV as a function of frequency, averaged across subjects. Straight lines on the top show significant increment from baseline (Wilcoxon signed-rank test, P < 0.03, FDR-corrected). Bottom: Mean PLV around the syllable rate of each condition (syllable rate ±0.5 Hz). Asterisk (*) shows significant difference between conditions (Wilcoxon signed-rank test, P < 0.03, FDR-corrected).
The enhancement of the auditory-motor PLV around the heard syllable rate was statistically significant for the first three conditions (Fig. 3B, top; Wilcoxon signed-rank test, P < 0.03, FDR-corrected). For a higher-resolution characterization of the coupling pattern, we computed the mean PLV, per condition and participant, around the syllable rate (Fig. 3B, bottom). We found significant difference across conditions as shown by a Kruskal-Wallis test [χ2(4) = 26.5, P < 0.001]. Unexpectedly, a post hoc analysis comparing the central condition against all others revealed that the synchronization between areas is enhanced while hearing syllables at 4.5 Hz (Wilcoxon signed-rank test, P < 0.03, FDR-corrected). To test the robustness of this result, we repeated the analysis using a different index to measure coupling (phase lag index; see Materials and Methods), and we showed that the same synchronization pattern is recovered (fig. S4B). We also performed power analyses for motor and auditory regions; none of these showed an enhancement for the 4.5 syllable rate condition (fig. S5).
To examine whether this observed synchronization pattern was restricted to the interaction between motor and auditory regions, rather than being a generic property of interareal coupling, the PLV pattern between auditory regions across hemispheres was calculated. This auditory-auditory PLV showed peaks at the frequencies corresponding to each syllable rate but no significant difference across conditions (fig. S6), unlike the auditory-motor PLV pattern.
Next, we tried a different analysis to explore whether the strength of the auditory-motor coupling depends on the auditory-speech coupling. Figure 4 shows the auditory-motor PLV as a function of the auditory-speech PLV for each syllable rate condition. Fitting a linear regression for each plot revealed that just for the central conditions, the correlation between variables is significant (r2.5 = 0.18, P2.5 = 0.33; r3.5 = 0.43, P3.5 = 0.02; r4.5 = 0.49, P4.5 = 0.01; r5.5 = 0, P5.5 = 0.99; r6.5 = 0.3, P6.5 = 0.11). This result suggests that when auditory cortex is synchronized to an external stimulus, this synchronization is conveyed to motor areas only in a restricted frequency range.
Fig. 4. Correlation between auditory-motor PLV and auditory-speech PLV.
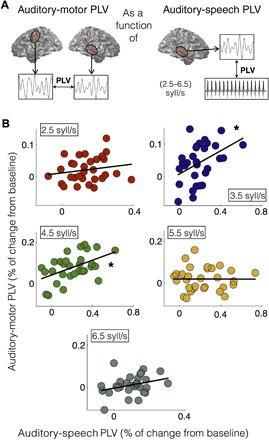
(A) Schematic of analysis. (B) Contralateral motor-auditory PLV as a function of the corresponding auditory-stimulus PLV. Each panel represents a different syllable rate condition (red, 2.5 syllables/s; blue, 3.5 syllables/s; green, 4.5 syllables/s; yellow, 5.5 syllables/s; dark gray, 6.5 syllables/s), and the black line represents the linear fitting of the data. Asterisk (*) shows significant correlation between variables (P < 0.05, FDR-corrected).
A simple neural model successfully accounts for auditory-motor synchronization
Finally, we investigated whether the relatively complex and unexpected auditory-motor synchronization pattern could emerge as a consequence of the underlying neural architecture. Our data show that auditory-motor coupling is restricted and enhanced at 4.5 Hz, whereas the auditory-stimulus coupling remains stable across the tested syllable rates. This observation is compatible with a model in which the speech-motor cortex behaves like an oscillator (an element capable of generating rhythms and to be entrained) coupled to the auditory system. We adopted a physiologically inspired neural population model meeting these requirements and explored whether it can explain our measurements.
We choose the Wilson-Cowan mean-field approximation to represent speech-motor cortex (24). This model is a biophysical model of the interaction between an inhibitory and an excitatory neuronal population that has been widely used in neuroscience (25–27). The model is described by Eqs. 1 and 2, where S is a sigmoid function whose arguments represent the input activity for each neuron population; E and I represent the activity of the excitatory and inhibitory neurons, respectively; τ is the membrane time constant; a and b are synaptic coefficients; c and d are feedback coefficients; and ρ is the basal input activity from other areas of the brain.
With respect to the auditory cortex activity (A), we assumed it to be entrained by the speech envelope, and we used Eq. 3 to represent the different experimental conditions. This equation typifies a periodic signal with period 1/syllable rate that remains at zero for the first 3 s.
| (1) |
| (2) |
| (3) |
Finally, the interaction between regions takes place because the excitatory motor population receives the auditory cortical activity as input (Eq. 1 and Fig. 5A). The parameter κ represents the strength of the interaction.
Fig. 5. A simple neural model replicates the auditory-motor synchronization pattern.
(A) Schematic illustration of the neural model: Motor cortex modeled through a set of Wilson-Cowan equations representing an inhibitory-excitatory network, and the excitatory population receives the auditory cortex activity as input. (B) Numerical simulations submitted to the same analyses as the experimental data set. Straight lines show significant increment from baseline (Wilcoxon signed-rank test, P < 0.03, FDR-corrected). Asterisk (*) shows significant differences between conditions (Wilcoxon signed-rank test, P < 0.03, FDR-corrected). Colors identify the different conditions (red, 2.5 syllables/s; blue, 3.5 syllables/s; green, 4.5 syllables/s; yellow, 5.5 syllables/s; dark gray, 6.5 syllables/s).
To reproduce the experimental conditions, the whole MEG data set for one participant was numerically simulated (see Materials and Methods). This methodology allowed us to test the neural model and also to validate the experimental design and the analyses. With respect to the parameters: a, b, c, d, ρE, and ρI were fixed within the range typically used in the literature (24, 28), whereas τ was set to 60 ms to get the maximal coupling at 4.5 Hz and κ = 0.5 to get the desired modulation. Note that the value of the membrane time constant, τ, is close to the one used in previous works (26, 27) and within the range of the experimental results (29).
The numeric simulations were submitted to the same analyses as the experimental data. The PLVs between the auditory and motor simulated time series, averaged across trials of the same rate, showed the same pattern as the real data (Fig. 5B, top). The mean PLV around the condition rate (Fig. 5B, bottom) also displayed the same features as the experimental results. In particular, there was a significant difference across conditions as revealed by a Kruskal-Wallis test [χ2(4) = 45.6, P < 0.001); post hoc planned comparisons showed that the synchronization between regions was enhanced for the 4.5 syllable/s condition (Wilcoxon signed-rank test, P < 0.03, FDR-corrected).
The numerical simulations showed that the experimentally observed synchronization pattern could emerge as a consequence of a relatively simple underlying neural mass model. Moreover, to validate the plausibility of the model, we applied it to a related older study (30) that addressed auditory speech-motor interaction using delayed auditory feedback. We showed that this simple model captures the essential behavioral results of that experiment (fig. S7).
Finally, to further validate that the main feature making the model compatible with the observations is the representation of motor areas as a neural oscillator, we also investigated a linear description and we show that it does not reproduce the experimental results (fig. S8).
DISCUSSION
Our results are best seen in the context of the larger literature on the relationship between perception and action. This area of research, especially the work focused on speech, remains quite controversial (31, 32). Although substantial effort has been devoted to determine the functional role of the sensorimotor integration of speech, the relationship between auditory and speech-motor systems in the time domain remains largely unexplored. In this neurophysiological experiment, we fill this gap in our knowledge by testing the synchronization between auditory and speech-motor regions across syllable rates, regardless of any imputed functional role. We exploit the well-documented phenomenon that there is a reliable coupling between acoustic stimuli and auditory cortical activity to investigate how sensorimotor synchronization might be implemented across rates. The neural recordings reveal a surprising new phenomenon: Although the results broadly support the view that there exists a systematic relation between auditory and speech-motor regions, this relationship is not uniform across rates but selectively modulated.
Typical experimental approaches to study the sensorimotor integration of speech, specifically testing the extent to which motor representations and computations support perception, have pursued multiple lines of evidence, as outlined above. Cumulatively, the data suggest some form of interaction between auditory and speech-motor cortex, but the mechanisms remain elusive. We capitalize on a new approach to study the sensorimotor integration of speech. A body of findings from systems and cognitive neuroscience suggests that synchronization between brain regions may represent a crucial contribution to the cortical computational code (33). Insofar as anatomically distinct regions can be said to be coupled when measuring their activity, this coupling can be argued to underlie how computations are coordinated. We build on this line of research. The hypothesis that the sensorimotor infrastructure underlying speech may be subserved by synchronized oscillatory activity has not been pursued systematically. Influential data by Park et al. (21) show the promise of this method when looking more broadly at how synchronization correlates with intelligibility. In light of the promise of this line of attack, our study addresses a fundamental gap in our understanding of synchronization in speech-motor processing. We describe how synchronization comes into play by systematically testing the crucial role of speech rate and, specifically, how interareal synchronization is modulated by syllable rate. Performance in speech tasks is extremely rate-sensitive, and outside of rates ranging from ~2 to 9 syllables/s, the ability to extract usable information declines sharply (34, 35).
The experimental observations can be summarized as follows: The auditory-motor coupling is restricted and enhanced at 4.5 Hz, whereas the auditory-stimulus coupling remains stable across the tested syllable rates. Our numerical simulation confirmed that a well-established neural mass model captures these observations. The main feature of this model—in opposition to a linear model in which the speech-motor area represents a passive element—is representing motor areas as a neural oscillator. Different additional experiments would be needed to further enhance the accuracy of the model. However, our data suggest that the basic elements of the model should include speech-motor regions as a neural oscillator with a natural frequency close to 4.5 Hz.
Moreover, our findings reinforce previous results (36) that reveal frequencies around 4.5 Hz as the natural rhythms of speech-motor cortices. This line of reasoning converges, as well, with the fact that it has been shown that mouth movements while speaking occur in the same range of frequencies as highlighted here; notably, the coherence between the speech envelope and mouth movement is also enhanced around 4 Hz (37). In addition, the mean envelope modulation rate across languages happens to be in the same range (22). Together, the evidence suggests that the temporal patterns of speech emerge as a consequence of the interaction between cortical areas, with their own intrinsic rhythms, and the additional constraints imposed by the biomechanics of the vocal system consistent with the frame/content theory (38).
In this experiment, we focused on the sensorimotor integration of speech. Several studies have shown speech-motor cortex activation while listening to speech (5, 7, 23, 39). We build on this result and explore the relationship between auditory and speech-motor systems in the time domain. However, some evidence reveals that motor activation is not restricted to speech-like stimuli. For example, it has been reported that tool sounds (40), music (41), and rhythms (42) also activate motor cortices. In light of such data, further work would be needed to explore how our findings extend to other auditory stimuli. Note that the mean rate of speech (in terms of the physical variation quantified using the modulation spectrum) also lies between 4 and 5 Hz (22), whereas these rate-optimized phenomena are perhaps less obvious for other signals. Music, for example, has a different mean modulation rate (22). Although our conclusion on this issue must remain speculative, our data invite the hypothesis that, in the time/phase domain, there is rate-restricted specificity in the relation between speech-motor and auditory cortices.
We systematically investigated the synchronization between auditory and speech-motor cortices across rates and showed that these areas synchronized for a restricted range of frequencies, with a peak at 4.5 Hz. A well-described mean-field neural model of oscillatory neural behavior reproduced our results. To our knowledge, this work is among the first to pursue a mechanistic explanation of how the sensorimotor integration of speech is achieved, regardless of a functional interpretation. The data show that coupling exists between auditory and speech-motor cortex during listening to speech but that this coupling is rather more restricted than one might have anticipated. This new approach may lead to a more comprehensive understanding of the link between perceptual and motor systems in speech processing and, perhaps, other sensorimotor domains.
MATERIALS AND METHODS
Subjects
Seventeen subjects participated in this study (9 males; mean age, 28; age range, 20 to 40; 15 native speakers of American English and 2 native speakers of Spanish). All self-reported normal hearing and no neurological deficits, and all had normal structural MRI scans. Participants were paid for taking part in the study and provided written informed consent. Two additional participants completed the experiment but were removed: One because the participant was not able to perform the task and the other because the MEG signal was too noisy. The protocol was approved by the local Institutional Review Board (New York University’s Committee on Activities Involving Human Subjects).
Stimuli
The stimuli consisted of the spoken syllables /ba/, /wa/, /ma/, and /va/, which were synthesized with the free online text-to-speech software www.fromtexttospeech.com/ using a male voice. Each of the syllables was compressed to 120-ms duration using Praat software (43) and set to the same overall energy root mean square.
Each audio trial of the main experiment consisted of 3 s of silence (baseline phase) followed by 6 s of syllables (stimulation phase). For each trial, two syllables, the stable and the odd syllable, were randomly selected from the pool of four (/ba/, /wa/, /ma/, and /va/) to be repeatedly played during the stimulation phase. The syllables were sequentially presented with an occurrence frequency of 0.7 for the stable and 0.3 for the odd. A silent gap was placed between all syllables in each trial. The intersyllable silence was uniform within trial, and six different conditions of trials were generated by varying this value between 280 and 34 ms. This corresponds to rates of 2.5, 3.5, 4.5, 5.5, and 6.5 syllables/s. Eight trials consisting of different syllables were generated for every syllable rate condition.
Tasks
The participants performed the following tasks during MEG recording:
1) Motor localizer. Different consonants were sequentially presented on a screen, separated by a stop cue. Subjects were instructed to continuously mouth (mimic without vocalizing) each consonant plus an /a/ vowel as soon as the given consonant was presented on the screen and to continue until the word stop was presented. The time between the consonant presentation and the stop cue was jittered between 1.5 and 3 s to avoid prediction, and the intertrial interval (ITI) was jittered between 1 and 1.6 s. The consonants used were /b/, /v/, /w/, and /m/. Twenty-five repetitions of each consonant were presented in a pseudorandomized order.
2) Auditory localizer. Single syllables were sequentially played to participants while they were instructed to stay focused without performing any task. The presented syllables consisted of 25 repetitions of each of the same syllables used to generate the stimuli for the main experiment (/ba/, /wa/, /ma/, and /va/). The 100 total presented syllables were played in pseudorandom order, with an ITI jittered between 0.9 and 1.5 s.
3) Main experiment. During each block, 40 auditory trials (8 trials per syllable rate condition; see Stimuli) were played. At the end of each trial, one of the four possible syllables (/ba/, /wa/, /ma/, and /va/) was displayed on the screen. Participants were instructed to indicate whether the syllable was presented in the trial. The decision was made by pressing a button with the right hand (index finger: yes, syllable was present; middle finger: no, syllable was not present). The displayed syllable had a 50% probability of being present in the trial. There was no time constraint to make the decision, and the next trial started between 0.9 and 1.1 s after button press.
The overall experimental design consisted of two blocks of the main experiment followed by the motor localizer, the auditory localizer, and, finally, two more blocks of the main experiment. Two minutes of MEG data was recorded after each participant left the MEG room (empty room data). All auditory stimuli were presented binaurally at a mean 75-dB sound pressure via MEG-compatible tubephones (E-A-RTONE 3A, 50 ohm; Etymotic Research) attached to E-A-RLINK foam plugs inserted into the ear canal.
Data acquisition and processing
Neuromagnetic responses were recorded with a 1000-Hz sampling rate using a 157-channel whole-head axial gradiometer system (Kanazawa Institute of Technology) in a magnetically shielded room. Five electromagnetic coils were attached to the subject’s head to monitor head position during MEG recording. The coils were localized to the MEG sensors at three different time points: at the beginning of the experiment, before the motor localizer, and before the last two blocks of the main experiment. The positions of the coils with respect to three anatomical landmarks (the nasion and the left and right tragus) were determined using three-dimensional (3D) digitizer software (Source Signal Imaging Inc.) and digitizing hardware (Polhemus Inc.). This measurement allowed a coregistration of the subjects’ anatomical MRI with the MEG data. An online bandpass filter between 1 and 200 Hz and a notch filter at 60 Hz were applied to the MEG recordings.
Data processing and analyses were conducted used custom Matlab code and the FieldTrip toolbox (44). For each participant’s data set, noisy channels were visually rejected. Two procedures were applied to the continuous MEG recordings. First, a least squares projection was fitted to the data from the 2 min of empty room recorded at the end of each session. The corresponding component was removed from the recordings (45). Second, the environmental magnetic field, measured with three reference sensors located away from the participant’s head, was regressed out from the MEG signals using time-shifted principal components analysis (46). The MEG signals were then detrended, and artifacts related to eyeblinks and heartbeats were removed using independent component analysis.
Structural MRI
High-resolution T1-weighted 3D volume MR data were acquired using a Siemens Allegra 3-T head-only scanner. Each participant’s MRI data were preprocessed using the FieldTrip pipeline. Cortical reconstruction and volumetric segmentation were performed with the FreeSurfer image analysis suite.
Source reconstruction
To functionally localize each participant’s auditory and motor areas and to extract the signal coming from those regions, it is necessary to reconstruct the cortical current sources generating the magnetic fields recorded by the MEG sensors. Cortically constrained MNE (47) was used. This method approximates the cortical surface as a large number of current dipoles and estimates the dipole’s amplitude configuration with minimum overall energy that generates the measured magnetic field. Mathematically, it solves the following equation
where x(t) and y(t) are the MEG measurement and the dipole’s amplitudes at time t, respectively. W is the linear inverse operator defined as
where R and C represent the spatial covariance matrix of the sources and the noise, respectively, A is the linear forward matrix operator that gives the magnetic field at the sensor’s positions produced by orthogonal current unit dipoles, and l is a noise scaling factor. The parameters used for the source reconstructions were the average of the covariance of each trial’s baseline as the noise covariance matrix, a value of 3 for l, and a source space of 8196 points with a volume conduction model (both reconstructed from each subject’s structural MRI) to compute A.
Every current dipole source is a 3D vector. When the average across trials is projected back to source space, power is computed as the norm over the three orientations for each location and time point. If single trials are projected, then one signal per source is reconstructed by projecting the 3D time series along the direction explaining the most variance.
Auditory area localization
One hundred trials were extracted from the continuous MEG data from the auditory localizer. Trials were defined as 1 s of data centered on the syllable’s onsets. Trials were visually inspected and removed if gross artifacts were detected. Baseline was defined as the 500 ms before syllable onset. Trials were averaged and projected to source space using MNE. Power was averaged for baseline and the stimulus window (from 50 to 300 ms after the sound onset). Bilateral regions within temporal lobes with activity above baseline (Wilcoxon signed-rank test, P < 0.05) were identified. Then, for each region, 100 sources around the more active one were selected and defined as the auditory cortex of the corresponding hemisphere.
Motor area localization
It has been shown that while speaking, a suppression of the motor cortical 20-Hz rhythm takes place in mouth-related areas (48). Building on this result, speech-motor areas were identified by locating this suppression. Continuous MEG data from the motor localizer protocol were segmented into trials with a duration of 3 s [1 s before the starting cue appears on the screen (baseline) and 2 s after the mouth movement period]. Each trial was projected back to source space using MNE, the source signals were filtered between 17 and 25 Hz (μ-band), and their amplitudes were computed as the absolute value of the Hilbert transform. Amplitude was averaged for the baseline and stimulus windows (from 500 to 1500 ms after the starting cue). Bilateral regions showing a μ-band suppression compared with baseline (Wilcoxon signed-rank test, P < 0.05) were identified. For each region, 100 sources around the most suppressed one were selected and defined as the speech-motor cortex of the corresponding hemisphere. Four subjects showed the suppression only in the left hemisphere; therefore, no right speech-motor area was defined for them.
Data analysis
Main experiment data
As described above, four regions of interest (ROIs) were functionally identified for each participant: RM, LM, RA, and LA. The activity for each ROI while listening to syllables at the different rates was computed in the following analyses.
The data from the four blocks of the Main Experiment protocol were segmented into trials aligned with the auditory presentations. Trials were visually inspected and removed if gross artifacts were detected. Every participant’s data set comprised between 29 and 32 trials for each syllable rate condition (2.5, 3.5, 4.5, 5.5, and 6.5 syllables/s). The 3 s of silence before the beginning of the syllable repetition was defined as baseline. The cortical activity for each trial was reconstructed using an MNE inverse solution. The signals from the 100 sources comprising each area (LM, RM, LA, and RA) were averaged and resampled at 200 Hz, providing one time series per ROI and trial.
The spectrograms of the auditory stimuli were computed using the NSL (Neural Systems Laboratory) Auditory Model Matlab toolbox (49). This toolbox filters the signal in a specific set of frequency bands, emulating the auditory filters applied by the cochlea (yielding what we call auditory channels), and computes their envelopes. The stimulus cochlear envelopes were calculated by adding the auditory channels between 180 and 7246 Hz. Envelopes were resampled at 200 Hz.
Phase locking value
The synchronization between two signals was measured by the PLV between them as a frequency function. A continuous Morlet wavelet transform (frequency band, 1 to 10 Hz with 0.1-Hz resolution) was applied to both signals; the phase evolution for each frequency was extracted, and the PLV (as a function of frequency) was computed using the following formula
where f is the frequency, t is the discretized time, T is the total number of time points, and θ1 and θ2 are the phase of the first and the second signals, respectively.
Stimulus envelope–brain signal coupling
The PLV was calculated during the stimulation phase of each trial between each ROI signal and the corresponding auditory stimulus envelope. Windows of 2-s length and 1-s overlap were used, and the last window was disregarded to avoid boundary artifacts. The results for all time windows were averaged within a trial, providing one PLV per trial. The PLVs were then averaged within each condition and functional ROI (averaging left and right), obtaining one PLV as a function of the frequency for each participant’s data, functional region, and for each syllable rate. For each condition, the mean auditory PLV around the syllable rate (±0.5 Hz) was computed and compared with the same value evaluated for the baseline data (PLV between baseline auditory time series and the stimulation phase envelope). The percentage of change from baseline was estimated as the difference between the PLV during stimulation and during baseline divided by baseline.
Auditory-motor coupling
The PLV for RM-LA and LM-RA signals was calculated and then averaged. The choice to calculate the PLV between contralateral ROIs was made to avoid artifactual cross-talk between proximal regions (50). The stimulation phase PLV was computed in the same way as for the stimulus-brain coupling. To estimate the PLV at baseline, one window of 2 s right before syllable onset was used and averaged across all trials of a given syllable rate condition.
Weighted phase lag index
First, the cross-spectrum between signals was calculated as , where Z represents the Morlet wavelet transform. Then, the debiased wPLI (weighted phase lag index) square estimator was computed following Vinck et al. (51), using these formulae
where f is the frequency, t is the discretized time, and T is the total number of time points.
Model and simulations
The motor cortex activity was described by a minimal model for the dynamics of an inhibitory and an excitatory synaptically coupled neural population (24). The interaction with auditory areas was modeled by including the auditory cortex activity as an input for the excitatory population as shown in Eq. 1. The parameters of Eqs. 1 and 2 were set as a = b = c = 10 and d = 2 according to the literature (28). Basal input values were fixed at ρE = −1.5 and ρI = −3.2; this choice sets the system close to an Andronov-Hopf bifurcation, that is, increasing ρE would shift the system from steady state to oscillatory behavior. Finally, κ = 0.5 and τ = 60 ms to reproduce the experimental synchronization features (an enhancement of the PLV between motor and auditory regions when the last one oscillates at 4.5 Hz).
Auditory cortex activity was modeled by
| (4) |
where t ∈ [0 9] is the time in seconds, f is the oscillation frequency in Hz, and i = 1, …, 6 represents the different condition numbers. The signal emulates the auditory cortex activity while listening to the auditory stimuli: It starts at zero (baseline/silence period), and at t = 3 (the syllable onset), it increases the basal level and starts oscillating at the syllable rate. The auditory oscillation frequencies reproduce the experimental conditions fi = [2.5; 3.5; 4.5; 5.5; 6.5] Hz. For a given auditory activity (A; Eq. 4), the corresponding motor cortex activity (E − I) was calculated by numerically solving the set of differential Eqs. 1 and 2.
The MEG data simulations were performed using the FieldTrip toolbox. MEG-simulated data for the four blocks of the Main Experiment (32 trials per syllable rate condition) were generated for one subject according to the model. Each ROI activity was simulated by one dipole located in the center of the region. The dipole orientations were random unity vectors, and a different set was generated for the last two blocks (half of the data). According to the model, the time courses of the auditory dipoles’ activities were given by A, and the corresponding (E − I) was used for the motor dipoles. The MEG sensor signals were computed using the forward solution derived from the subject’s structural image.
For the selected subject, four more blocks of the Main Experiment were included in the experimental protocol, but the audio trials were replaced with silence. The recorded MEG signals were added to the simulated ones as a background activity. The mean amplitude of the simulated data during the stimulation phase was set as 2.5% of the amplitude of the background activity. The simulated data for the four blocks were submitted to the same processing and analysis as the experimental ones.
Supplementary Material
Acknowledgments
We thank G. Hickok, G. Cogan, S. Haegens, and K. Doelling for comments and advice. Funding: The work was supported by NIH 2R01DC05660. Author contributions: M.F.A. and D.P. designed the research and wrote the paper. M.F.A. acquired and analyzed the data. Competing interests: The authors declare that they have no competing interests. Data and materials availability: All data needed to evaluate the conclusions in the paper are present in the paper and/or the Supplementary Materials. Additional data related to this paper may be requested from the authors.
SUPPLEMENTARY MATERIALS
Supplementary material for this article is available at http://advances.sciencemag.org/cgi/content/full/4/2/eaao3842/DC1
fig. S1. Behavioral results.
fig. S2. Functional localizations.
fig. S3. PLV between auditory cortices and speech envelope.
fig. S4. Synchronization between auditory and motor cortices.
fig. S5. Power profiles for auditory and motor cortices.
fig. S6. PLV between LA and RA areas.
fig. S7. A simple neural model replicates behavioral results.
fig. S8. A linear model does not replicate the auditory-motor synchronization pattern.
REFERENCES AND NOTES
- 1.Tremblay S., Shiller D. M., Ostry D. J., Somatosensory basis of speech production. Nature 423, 866–869 (2003). [DOI] [PubMed] [Google Scholar]
- 2.Hickok G., Houde J., Rong F., Sensorimotor integration in speech processing: Computational basis and neural organization. Neuron 69, 407–422 (2011). [DOI] [PMC free article] [PubMed] [Google Scholar]
- 3.F. H. Guenther, Neural Control of Speech (MIT Press, 2016). [Google Scholar]
- 4.Cheung C., Hamilton L. S., Johnson K., Chang E. F., The auditory representation of speech sounds in human motor cortex. eLife 5, e12577 (2016). [DOI] [PMC free article] [PubMed] [Google Scholar]
- 5.Wilson S. M., Saygin A. P., Sereno M. I., Iacoboni M., Listening to speech activates motor areas involved in speech production. Nat. Neurosci. 7, 701–702 (2004). [DOI] [PubMed] [Google Scholar]
- 6.Tian X., Poeppel D., Mental imagery of speech: Linking motor and perceptual systems through internal simulation and estimation. Front. Hum. Neurosci. 6, 314 (2012). [DOI] [PMC free article] [PubMed] [Google Scholar]
- 7.Du Y., Buchsbaum B. R., Grady C. L., Alain C., Noise differentially impacts phoneme representations in the auditory and speech motor systems. Proc. Natl. Acad. Sci. U.S.A. 111, 7126–7131 (2014). [DOI] [PMC free article] [PubMed] [Google Scholar]
- 8.Meister I. G., Wilson S. M., Deblieck C., Wu A. D., Iacoboni M., The essential role of premotor cortex in speech perception. Curr. Biol. 17, 1692–1696 (2007). [DOI] [PMC free article] [PubMed] [Google Scholar]
- 9.Sato M., Tremblay P., Gracco V. L., A mediating role of the premotor cortex in phoneme segmentation. Brain Lang. 111, 1–7 (2009). [DOI] [PubMed] [Google Scholar]
- 10.Möttönen R., Dutton R., Watkins K. E., Auditory-motor processing of speech sounds. Cereb. Cortex 23, 1190–1197 (2013). [DOI] [PMC free article] [PubMed] [Google Scholar]
- 11.Ito T., Tiede M., Ostry D. J., Somatosensory function in speech perception. Proc. Natl. Acad. Sci. U.S.A. 106, 1245–1248 (2009). [DOI] [PMC free article] [PubMed] [Google Scholar]
- 12.Bruderer A. G., Danielson D. K., Kandhadai P., Werker J. F., Sensorimotor influences on speech perception in infancy. Proc. Natl. Acad. Sci. U.S.A. 112, 13531–13536 (2015). [DOI] [PMC free article] [PubMed] [Google Scholar]
- 13.G. Buzsáki, in Rhythms of the Brain (Oxford Univ. Press, 2009), pp. 1–464. [Google Scholar]
- 14.Ahissar E., Nagarajan S., Ahissar M., Protopapas A., Mahncke H., Merzenich M. M., Speech comprehension is correlated with temporal response patterns recorded from auditory cortex. Proc. Natl. Acad. Sci. U.S.A. 98, 13367–13372 (2001). [DOI] [PMC free article] [PubMed] [Google Scholar]
- 15.Luo H., Poeppel D., Phase patterns of neuronal responses reliably discriminate speech in human auditory cortex. Neuron 54, 1001–1010 (2007). [DOI] [PMC free article] [PubMed] [Google Scholar]
- 16.Lakatos P., Chen C.-M., O’Connell M. N., Mills A., Schroeder C. E., Neuronal oscillations and multisensory interaction in primary auditory cortex. Neuron 53, 279–292 (2007). [DOI] [PMC free article] [PubMed] [Google Scholar]
- 17.Henry M. J., Obleser J., Frequency modulation entrains slow neural oscillations and optimizes human listening behavior. Proc. Natl. Acad. Sci. U.S.A. 109, 20095–20100 (2012). [DOI] [PMC free article] [PubMed] [Google Scholar]
- 18.Peelle J. E., Gross J., Davis M. H., Phase-locked responses to speech in human auditory cortex are enhanced during comprehension. Cereb. Cortex 23, 1378–1387 (2013). [DOI] [PMC free article] [PubMed] [Google Scholar]
- 19.Doelling K. B., Arnal L. H., Ghitza O., Poeppel D., Acoustic landmarks drive delta–theta oscillations to enable speech comprehension by facilitating perceptual parsing. Neuroimage 85, 761–768 (2014). [DOI] [PMC free article] [PubMed] [Google Scholar]
- 20.Alho J., Lin F.-H., Sato M., Tiitinen H., Sams M., Jääskeläinen I. P., Enhanced neural synchrony between left auditory and premotor cortex is associated with successful phonetic categorization. Front Psychol. 5, 394 (2014). [DOI] [PMC free article] [PubMed] [Google Scholar]
- 21.Park H., Ince R. A. A., Schyns P. G., Thut G., Gross J., Frontal top-down signals increase coupling of auditory low-frequency oscillations to continuous speech in human listeners. Curr. Biol. 25, 1649–1653 (2015). [DOI] [PMC free article] [PubMed] [Google Scholar]
- 22.Ding N., Patel A. D., Chen L., Butler H., Luo C., Poeppel D., Temporal modulations in speech and music. Neurosci. Biobehav. Rev. 81, 181–187 (2017). [DOI] [PubMed] [Google Scholar]
- 23.Pulvermüller F., Huss M., Kherif F., del Prado Martin F. M., Hauk O., Shtyrov Y., Motor cortex maps articulatory features of speech sounds. Proc. Natl. Acad. Sci. U.S.A. 103, 7865–7870 (2006). [DOI] [PMC free article] [PubMed] [Google Scholar]
- 24.Wilson H. R., Cowan J. D., Excitatory and inhibitory interactions in localized populations of model neurons. Biophys. J. 12, 1–24 (1972). [DOI] [PMC free article] [PubMed] [Google Scholar]
- 25.Goldin M. A., Alonso L. M., Alliende J. A., Goller F., Mindlin G. B., Temperature induced syllable breaking unveils nonlinearly interacting timescales in birdsong motor pathway. PLOS ONE 8, e67814 (2013). [DOI] [PMC free article] [PubMed] [Google Scholar]
- 26.Ozeki H., Finn I. M., Schaffer E. S., Miller K. D., Ferster D., Inhibitory stabilization of the cortical network underlies visual surround suppression. Neuron 62, 578–592 (2009). [DOI] [PMC free article] [PubMed] [Google Scholar]
- 27.Marcos E., Pani P., Brunamonti E., Deco G., Ferraina S., Verschure P., Neural variability in premotor cortex is modulated by trial history and predicts behavioral performance. Neuron 78, 249–255 (2013). [DOI] [PubMed] [Google Scholar]
- 28.F. C. Hoppensteadt, E. M. Izhikevich, Weakly Connected Neural Networks (Springer Science & Business Media, 1997). [Google Scholar]
- 29.Tripathy S. J., Burton S. D., Geramita M., Gerkin R. C., Urban N. N., Brain-wide analysis of electrophysiological diversity yields novel categorization of mammalian neuron types. J. Neurophysiol. 113, 3474–3489 (2015). [DOI] [PMC free article] [PubMed] [Google Scholar]
- 30.Black J. W., The effect of delayed side-tone upon vocal rate and intensity. J. Speech Disord. 16, 56–60 (1951). [DOI] [PubMed] [Google Scholar]
- 31.Lotto A. J., Hickok G. S., Holt L. L., Reflections on mirror neurons and speech perception. Trends Cogn. Sci. 13, 110–114 (2009). [DOI] [PMC free article] [PubMed] [Google Scholar]
- 32.Pulvermüller F., Fadiga L., Active perception: Sensorimotor circuits as a cortical basis for language. Nat. Rev. Neurosci. 11, 351–360 (2010). [DOI] [PubMed] [Google Scholar]
- 33.Singer W., Dynamic formation of functional networks by synchronization. Neuron 69, 191–193 (2011). [DOI] [PubMed] [Google Scholar]
- 34.Ghitza O., Behavioral evidence for the role of cortical θ oscillations in determining auditory channel capacity for speech. Front Psychol. 5, 652 (2014). [DOI] [PMC free article] [PubMed] [Google Scholar]
- 35.Dupoux E., Green K., Perceptual adjustment to highly compressed speech: Effects of talker and rate changes. J. Exp. Psychol. Hum. Percept. Perform. 23, 914–927 (1997). [DOI] [PubMed] [Google Scholar]
- 36.Giraud A.-L., Kleinschmidt A., Poeppel D., Lund T. E., Frackowiak R. S. J., Laufs H., Endogenous cortical rhythms determine cerebral specialization for speech perception and production. Neuron 56, 1127–1134 (2007). [DOI] [PubMed] [Google Scholar]
- 37.Chandrasekaran C., Trubanova A., Stillittano S., Caplier A., Ghazanfar A. A., The natural statistics of audiovisual speech. PLOS Comput. Biol. 5, e1000436 (2009). [DOI] [PMC free article] [PubMed] [Google Scholar]
- 38.MacNeilage P. F., The frame/content theory of evolution of speech production. Behav. Brain Sci. 21, 499–546 (1998). [DOI] [PubMed] [Google Scholar]
- 39.Chevillet M. A., Jiang X., Rauschecker J. P., Riesenhuber M., Automatic phoneme category selectivity in the dorsal auditory stream. J. Neurosci. 33, 5208–5215 (2013). [DOI] [PMC free article] [PubMed] [Google Scholar]
- 40.Lewis J. W., Brefczynski J. A., Phinney R. E., Janik J. J., DeYoe E. A., Distinct cortical pathways for processing tool versus animal sounds. J. Neurosci. 25, 5148–5158 (2005). [DOI] [PMC free article] [PubMed] [Google Scholar]
- 41.Bangert M., Peschel T., Schlaug G., Rotte M., Drescher D., Hinrichs H., Heinze H.-J., Altenmüller E., Shared networks for auditory and motor processing in professional pianists: Evidence from fMRI conjunction. Neuroimage 30, 917–926 (2006). [DOI] [PubMed] [Google Scholar]
- 42.Bengtsson S. L., Ullén F., Ehrsson H. H., Hashimoto T., Kito T., Naito E., Forssberg H., Sadato N., Listening to rhythms activates motor and premotor cortices. Cortex 45, 62–71 (2009). [DOI] [PubMed] [Google Scholar]
- 43.Boersma P., PRAAT, a system for doing phonetics by computer. Glot Int. 5, 341–345 (2002). [Google Scholar]
- 44.Oostenveld R., Fries P., Maris E., Schoffelen J.-M., FieldTrip: Open source software for advanced analysis of MEG, EEG, and invasive electrophysiological data. Comput. Intell. Neurosci. 2011, 156869 2011. [DOI] [PMC free article] [PubMed] [Google Scholar]
- 45.Adachi Y., Shimogawara M., Higuchi M., Haruta Y., Ochiai M., Reduction of non-periodic environmental magnetic noise in MEG measurement by continuously adjusted least squares method. IEEE Trans. Appl. Supercond. 11, 669–672 (2001). [Google Scholar]
- 46.de Cheveigné A., Simon J. Z., Denoising based on time-shift PCA. J. Neurosci. Methods 165, 297–305 (2007). [DOI] [PMC free article] [PubMed] [Google Scholar]
- 47.Dale A. M., Liu A. K., Fischl B. R., Buckner R. L., Belliveau J. W., Lewine J. D., Halgren E., Dynamic statistical parametric mapping: Combining fMRI and MEG for high-resolution imaging of cortical activity. Neuron 26, 55–67 (2000). [DOI] [PubMed] [Google Scholar]
- 48.Salmelin R., Schnitzler A., Schmitz F., Freund H.-J., Single word reading in developmental stutterers and fluent speakers. Brain 123, 1184–1202 (2000). [DOI] [PubMed] [Google Scholar]
- 49.T. Chi, SS. NSL Matlab Toolbox (Maryland Neural Systems Laboratory, University of Maryland, 2001).
- 50.Ghuman A. S., McDaniel J. R., Martin A., A wavelet-based method for measuring the oscillatory dynamics of resting-state functional connectivity in MEG. Neuroimage 56, 69–77 (2011). [DOI] [PMC free article] [PubMed] [Google Scholar]
- 51.Vinck M., Oostenveld R., Van Wingerden M., Battaglia F., Pennartz C. M. A., An improved index of phase-synchronization for electrophysiological data in the presence of volume-conduction, noise and sample-size bias. Neuroimage 55, 1548–1565 (2011). [DOI] [PubMed] [Google Scholar]
Associated Data
This section collects any data citations, data availability statements, or supplementary materials included in this article.
Supplementary Materials
Supplementary material for this article is available at http://advances.sciencemag.org/cgi/content/full/4/2/eaao3842/DC1
fig. S1. Behavioral results.
fig. S2. Functional localizations.
fig. S3. PLV between auditory cortices and speech envelope.
fig. S4. Synchronization between auditory and motor cortices.
fig. S5. Power profiles for auditory and motor cortices.
fig. S6. PLV between LA and RA areas.
fig. S7. A simple neural model replicates behavioral results.
fig. S8. A linear model does not replicate the auditory-motor synchronization pattern.