
Figure 3.
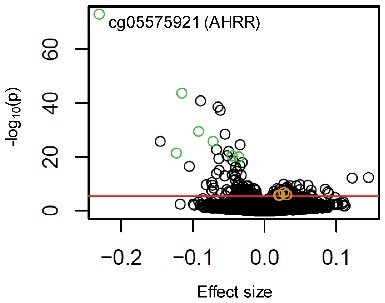
Effect size of association between urine cotinine levels and DNA methylation in monocytes. A volcano plot depicts the significance [-log10(P value), y-axis] vs. the effect size (beta, x-axis) from the associations between DNA methylation (M-value) and log urine cotinine levels (ng/ml) for each of the 484,817 CpG sites investigated (significant results not previously identified shown as golden circles; top seven most significant genomic loci shown as green circles; red line indicates genome-wide significance, FDR < 0.01).