

ABSTRACT
The nuclear lamina mechanically integrates the nucleus with the cytoskeleton and extracellular environment and regulates gene expression. These functions are exerted through direct and indirect interactions with the lamina's major constituent proteins, the A-type lamins, which are encoded by the LMNA gene. Using quantitative stable isotope labeling-based shotgun proteomics we have analyzed the proteome of human dermal fibroblasts in which we have depleted A-type lamins by means of a sustained siRNA-mediated LMNA knockdown. Gene ontology analysis revealed that the largest fraction of differentially produced proteins was involved in actin cytoskeleton organization, in particular proteins involved in focal adhesion dynamics, such as actin-related protein 2 and 3 (ACTR2/3), subunits of the ARP2/3 complex, and fascin actin-bundling protein 1 (FSCN1). Functional validation using quantitative immunofluorescence showed a significant reduction in the size of focal adhesion points in A-type lamin depleted cells, which correlated with a reduction in early cell adhesion capacity and an increased cell motility. At the same time, loss of A-type lamins led to more pronounced stress fibers and higher traction forces. This phenotype could not be mimicked or reversed by experimental modulation of the STAT3-IL6 pathway, but it was partly recapitulated by chemical inhibition of the ARP2/3 complex. Thus, our data suggest that the loss of A-type lamins perturbs the balance between focal adhesions and cytoskeletal tension. This imbalance may contribute to mechanosensing defects observed in certain laminopathies.
KEYWORDS: cytoskeleton, focal adhesion, LMNA, nuclear lamina, proteomics, SILAC, stress fibers, wound healing
Introduction
The nuclear lamina, a thin filamentous protein layer beneath the nuclear envelope, physically supports the cell nucleus and has a central role in nuclear organization and gene regulation.1 The major constituents of this meshwork are type V intermediate filament proteins, known as lamins. Mutations in the LMNA gene, which encodes A-type lamins, cause a wide spectrum of tissue-specific and systemic diseases collectively called laminopathies. Disease manifestations include muscular dystrophies, lipodystrophies, dilated cardiomyopathies and the premature aging syndromes Hutchinson-Gilford progeria (HGPS) and restrictive dermopathy (RD).1 Since the nuclear lamina is involved in gene regulation through chromatin organization and sequestration of transcription factors,1-5 mutations in genes encoding nuclear lamins directly affect gene expression. Indeed, microarray analysis of HGPS fibroblasts2,6 and of Lmna deficient MEFs7 have revealed large-scale changes in the transcriptome with respect to their wild-type counterparts. However, the stability and function of the encoded proteins are regulated by post-translational modifications and interactions, precluding direct extrapolation of gene expression data to protein level changes. A limited number of pioneering studies has documented changes in global protein expression in laminopathy patient cells or mouse model cells.8-11 However, the genetic variability between patients and the poor translational value of animal models complicate extraction of causal effects.12-14 Therefore we have now analyzed proteome changes in a controlled, isogenic cell system, namely human dermal fibroblasts in which we depleted A-type lamins by means of sustained siRNA-mediated knockdown,15 with the underlying reasoning that this may have value for better understanding laminopathies that are characterized by reduction (haploinsufficiency) or loss of A-type lamins, among which certain cardiomyopathies.16,17 We identified several proteins with significantly altered abundance that were involved in focal adhesion (FA) kinetics: actin-related protein 2 (ACTR2), actin-related protein 3 (ACTR3) and fascin actin-bundling protein 1 (FSCN1). We validated and complemented proteomics with functional studies, thereby revealing an unexpected uncoupling between cell adhesion and cytoskeletal tension.
Results
SILAC-based quantitative analysis in A-type lamin depleted fibroblasts reveals significant changes in the cytoskeletal proteome
To study the impact of A-type lamin depletion on global protein expression, we performed a SILAC-based quantitative proteomics experiment on human dermal fibroblasts after sustained knockdown of LMNA (LMNAkd). RT-qPCR revealed a ∼16-fold decrease of LMNA transcripts in LMNAkd cells. Lamins A and C were virtually absent on western blot and a ∼2.8-fold decrease was observed via immunofluorescent staining of lamin A, essentially approximating background levels. LMNAkd cells also showed a significant 3-fold increase of dysmorphic nuclei compared to control cells that were treated with a non-targeting control siRNA (NTkd) (Fig. S1).
Using the SILAC based proteomics approach for LMNAkd and NTkd cells depicted in Fig. 1A, we identified a total of 1,341 proteins, of which 75 showed significant differential expression (p < 0.05). 42 proteins were more abundantly and 33 were less abundantly present in LMNAkd cells. The complete dataset is provided as supplementary material (Suppl. Doc. S1). Gene ontology (GO) analysis of the protein classes indicated that the largest group (23.7%) of the proteins were cytoskeletal or cytoskeleton-associated. Gene ontology enrichment analysis (GOrilla) returned 5 GO terms that were significantly enriched for this protein set, namely 1) positive regulation of cellular component biogenesis, 2) regulation of cellular component biogenesis, 3) ARP2/3 complex-mediated actin nucleation, 4) regulation of actin filament-based process, and 5) regulation of actin filament polymerization, with group 3 showing with 7.5 fold the highest enrichment (Fig. 1B). A subset of 16 top hits that showed a relative fold change higher than 2 (CLIC4, DES, DLD, HSPB1, PLOD2, SAP18, SERPINB8, TGM2 and TPM1) or lower than 0.5 (ANXA4, ACTR2, ACTR3, ARPC4, EIF4G2, FSCN1 and LMOD1) was analyzed with RT-qPCR to assess transcript levels. Nine genes showed a clear positive correlation between transcript and SILAC ratio, whereas 7 did not (Fig. 1C).
Figure 1.
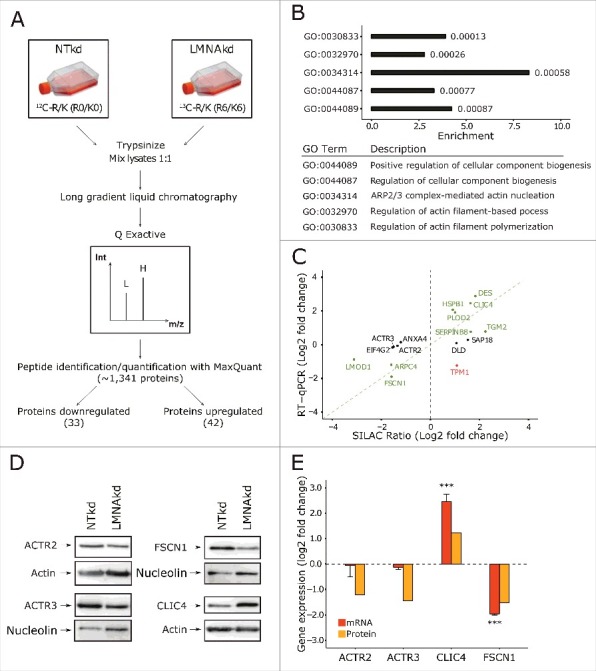
SILAC based quantitative proteomics of human dermal fibroblasts after sustained LMNAkd indicate that depletion of lamin A/C influences the levels of proteins involved in actin cytoskeleton organization. (A) Schematic overview of the SILAC experiment (see materials and methods for details). L = light medium, H = heavy medium, Int = intensity, m/z = mass/charge ratio. (B) Proteins that showed significant differences (p < 0.05) in the SILAC dataset were analyzed with Gorilla, yielding a subset of significantly affected pathways (p-value for the respective GO term depicted next to the bars). (C) Scatterplot between mRNA level, measured by RT-qPCR relative to non-targeting control (NTkd), and SILAC ratio. Genes in green text color showed correlation, genes in black text color showed no correlation, and genes in red text color showed inverse correlation. (D) Western blot analysis of ACTR2, ACTR3, FSCN1 and CLIC4. Nucleolin or actin was used as a loading control. (E) Gene expression levels of ACTR2, ACTR3, FSCN1 and CLIC4 measured by real-time qPCR relative to NTkd (in orange) and protein levels of ACTR2, ACTR3, FSCN1 and CLIC4 semi-quantified with western blot analysis (in yellow). Error bars indicate the standard deviation on the mean value of 3 biological replicates; significance was calculated with a Student's t-test; *** = p-value < 0.001.
Sustained LMNA knockdown alters the abundance of ACTR2, ACTR3, FSCN1 and CLIC4
GO analysis revealed that the cytoskeletal proteome became strongly affected in LMNAkd cells. We therefore validated 4 of the most prominently altered cytoskeletal or cytoskeleton-associated proteins using western blot, namely actin-related protein 2 (ACTR2) and actin-related protein 3 (ACTR3), subunits of the ARP2/3 complex, fascin actin-bundling protein 1 (FSCN1), a protein that organizes F-actin into parallel bundles and is involved in FA disassembly and chloride intracellular channel protein 4 (CLIC4), which is involved in diverse processes such as cell migration and wound healing and may be important for regulating cytoskeletal organization during the cell cycle.18,19 ACTR2, ACTR3 and FSCN1 proteins were found to be significantly less abundant in LMNAkd cells (ACTR2: 2.6-fold, ACTR3: 2.3-fold, and FSCN1: 2.8-fold decrease) in accordance with their SILAC ratio (ACTR2: 2.5-fold, ACTR3: 2.8-fold, and FSCN1: 3.0-fold decrease), but only FSCN1 also showed lower mRNA levels (3.7-fold decrease). CLIC4 protein abundance and mRNA levels were both significantly increased (2.3-fold and 5.7-fold increase respectively) similar to the SILAC ratio (3.1-fold increase) (Fig. 1D & E).
A-type lamin depletion reduces focal adhesion area
Since ARP2/3 and FSCN1 are directly involved in FA formation and disassembly, respectively, we quantified FAs by immunofluorescent staining of paxillin, vinculin and focal adhesion kinase (FAK) (Fig. 2A) and quantitative image analysis (Fig. 2B-D).20 In contrast with paxillin and vinculin, the FAK antibody did not reliably stain FAs. However, we did observe a significant decrease in nuclear FAK signal in LMNAkd cells (Fig. 2I). Fluorescence intensity of paxillin foci was significantly decreased in LMNAkd cells compared to NTkd cells (−11.6%), as was the number of FAs per cell (−46%), and the area per FA (−11.5%). In contrast, the number and fluorescence intensity of vinculin foci was not significantly altered; only the area showed a significant decrease in LMNAkd cells (−13.2%). Western blot analysis revealed a 2.4-fold decrease in paxillin protein abundance after LMNAkd, which was in line with the (non-significant) 1.6-fold decrease in the SILAC data. Vinculin and FAK protein levels were unaltered (Fig. 2E). We also analyzed mRNA expression of paxillin with RT-qPCR and measured a 2.1-fold decrease of PXN expression (Fig. S2A). To assure that the effects on FA were specifically caused by A-type lamin depletion, we rescued LMNA expression in LMNAkd cells by prolonged culturing after a sustained knockdown in absence of siRNA. The number and area of paxillin foci restored when lamin A/C levels returned back to basal levels after 1 week in the absence of siRNA, suggesting a direct causal effect (Fig. 2F-H).
Figure 2.

A-type lamin depletion reduces FA and rescue of LMNA expression alleviates the phenotype. (A) Representative images of NTkd and LMNAkd cells after immunofluorescence staining for paxillin, vinculin or FAK (yellow) and counterstaining with DAPI (cyan). (B) Normalized mean fluorescence (%) of FA points relative to the average of NTkd. (C) Quantification of the number of FAs per cell. (D) Area per FA (µm2). (E) Western blot for paxillin, vinculin and FAK. Nucleolin or actin was used as a loading control. (F) Number of FAs per cell relative to NTkd control 1 week after LMNAkd was either arrested or continued. (G) FA area relative to NTkd control cells. (H) Lamin A level relative to NTkd control cells. (I) Normalized mean fluorescence (%) of nuclear FAK relative to NTkd cells. Immunofluorescent staining was performed in triplicate and a minimum of 100 cells were imaged per replicate. In the boxplots the horizontal line indicates the median, boxes the 25th and 75th percentile, and whiskers the 5th and 95th percentile. For all figures, significance was calculated with the Wilcoxon rank sum test; *** = p-value < 0.001.
LMNAkd reduces adhesive capacity but increases contractile tension
Since a reduction in FA number or size may reduce cell adhesion we analyzed the net adhesive capacity of the fibroblasts seeded onto collagen-coated wells using a colorimetric cell adhesion assay. We observed a 60% reduction in initial cell adhesion in LMNAkd cells (Fig. 3A). Intuitively, reduced adhesion, together with a reduced number of FA points, suggests less contractile tension in those cells that are attached. Concurrent phalloidin staining however, revealed more pronounced stress fibers in lamin A/C depleted cells as evidenced by an increased fluorescence intensity for the fibers (Fig. 3B). To analyze whether the more pronounced stress fibers also increased contractile tension we performed traction force microscopy (TFM) using trypsin-mediated detachment of micro-patterned cells. TFM measurements showed a significant 2.8-fold increase in traction force, suggesting that LMNAkd cells indeed display higher cytoskeletal tension (Fig. 3C).
Figure 3.
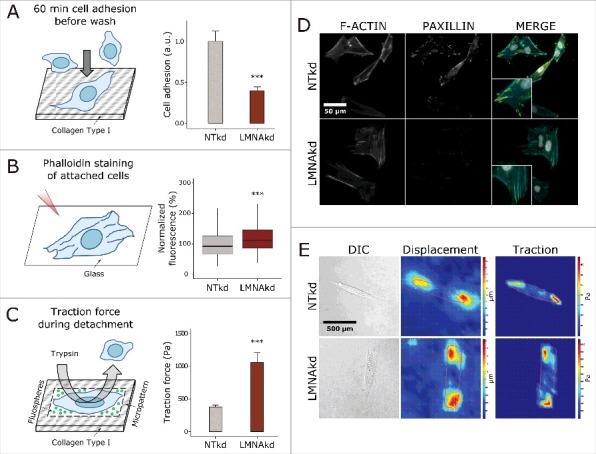
LMNAkd reduces adhesive capacity, but increases contractile tension. (A) Schematic overview of the colorimetric cell adhesion assay (left) and barplot of the results of the assay, expressed relative to NTkd cells (right). Error bars indicate the standard deviation on the mean value of 10 replicates. (B) Schematic overview of the rhodamine phalloidin staining used to characterize stress fibers of attached cells (left) and box plot of the normalized mean fluorescence intensity (relative to NTkd cells (%)) of stress fibers per cell (right). Phalloidin staining was conducted in triplicate and a minimum of 100 cells were imaged per replicate. In the boxplot the horizontal line indicates the median, boxes the 25th and 75th percentile, and whiskers the 5th and 95th percentile. (C) Schematic overview of the traction force microscopy experiment (left) and barplot of the maximum traction force in NTkd and LMNAkd cells (right). Error bars indicate the standard deviation on the mean value of 8 NTkd cells and 10 LMNAkd cells. (D) Representative images of NTkd and LMNAkd cells after immunofluorescence staining for paxillin (yellow), rhodamine phalloidin staining for actin (cyan) and counterstaining with DAPI (gray). (E) Representative DIC images, heat maps of the displacement and heat maps of the traction forces in NTkd and LMNAkd cells based on TFM measurements (see materials and methods for details). For the TFM experiment, significance was calculated with the Students t test; *** = p-value < 0.001. For the other experiments significance was calculated with the Wilcoxon rank sum test; *** = p-value < 0.001.
A-type lamin depletion increases cell mobility but impairs directionality in wound healing
Since FA size dictates cell migration rate we analyzed cell migration by means of a wound healing assay.21-23 In general, LMNAkd induced a significant decrease in wound healing performance: the wound healing rate, expressed as the decrease of wound area as a function of time (see materials and methods), was approximately 38% lower than the rate of NTkd cells (Fig. 4A, C & D). The average displacement of individual NTkd fibroblasts was not significantly different from that of the entire field of view, but for LMNAkd, cells at the leading edge (i.e. the first row of cells) displayed a significant increase in motility as compared to NTkd cells. Despite this increased motility, LMNAkd fibroblast movement lacked direction: whereas 100% of the NTkd cells moved toward the wound, only 33% of the LMNAkd cells showed this directionality (Fig. 4B & E).
Figure 4.
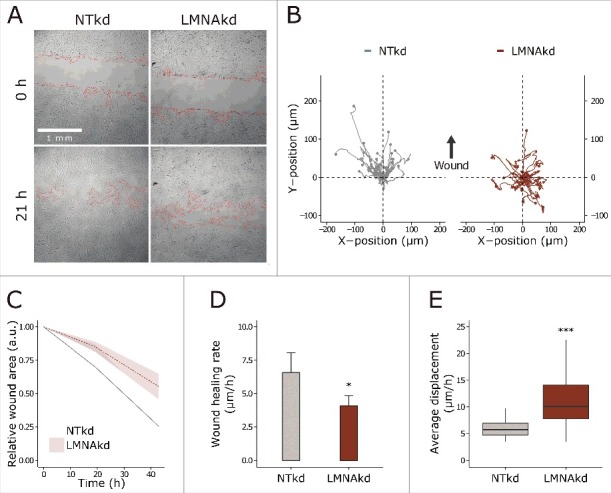
Lamin A/C depletion reduces wound healing potential, but increases single cell motility. (A) Representative transmission images of the wound healing assay at 2 time points (0 and 21 h) of the experiment, the wound area is delineated in red. (B) XY-movement of individual cells over 28 h, relative to the initial position. (C) Normalized wound area at different time points, relative to the initial wound area. The line is the mean value, the shaded region indicates the standard deviation on the mean value of 8 replicates. (D) Cell migration rate (µm/h) of NTkd and LMNAkd cells. Error bars indicate the standard deviation on the mean value of 8 replicates. (E) Average displacement (µm/h) of cells, measured by tracking individual cells in time-lapse images of a wound healing assay. The line is the mean value, the shaded region indicates the standard deviation on the mean value of 8 replicates. In the boxplots the horizontal line indicates the median, boxes the 25th and 75th percentile, and whiskers the 5th and 95th percentile. Significance was calculated in D with the Student's t-tes and in E with the Wilcoxon rank sum test; * = p-value < 0.05; *** = p-value < 0.001.
STAT3 knockdown does not reproduce the LMNAkd phenotype, nor does IL6/IL6R treatment alleviate the effects of LMNAkd
Previous studies have shown that signal transducer and activator of transcription 3 (STAT3) and interleukin 6 (IL6) induce FSCN1 expression in breast cancer cells and human glioblastoma multiforme cells.24,25 In addition, both STAT3 and IL6 can affect cell migration.26,27 Since LMNAkd reduced FSCN1 expression, we analyzed the gene expression of STAT3, IL6 and interleukin 6 receptor (IL6R) with RT-qPCR. A significant decrease in expression of STAT3 (7.1-fold) and IL6R (6.8-fold) was observed after LMNAkd (Fig. S2A). The protein level of STAT3 was also decreased 2.3-fold, as shown by western blot, whereas IL6 showed 2.6-fold increased expression (Fig. S2A & D).
To elucidate whether an LMNAkd-associated decrease in STAT3 expression caused the decreased expression of FSCN1, STAT3 gene expression was reduced by RNAi. Despite a 64-fold reduction in STAT3 expression (Fig. S2B), no significant change in FSCN1 expression could be detected. Likewise, IL6 expression was unaffected by STAT3 knockdown (STAT3kd), but the expression of IL6R was significantly decreased (10-fold) (Fig. S2B). Wound healing potential after STAT3kd was slightly increased, but this was not significant (Fig. 5A & B). Immunofluorescent staining of paxillin indicated that the number of FAs per cell and the area was unaltered after STAT3kd (Fig. 5C & D).
Figure 5.
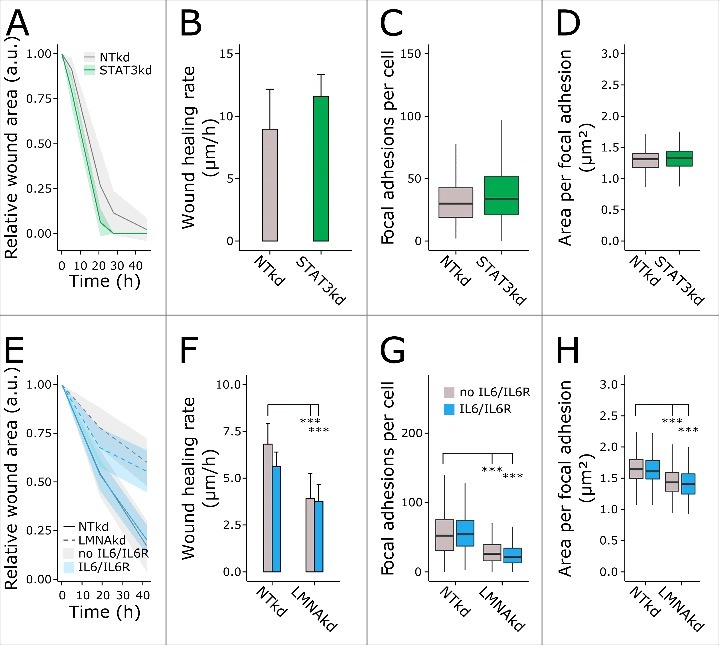
Impaired wound healing and FA after LMNAkd is not attributed to decreased STAT3 or decreased IL6/IL6R expression. (A) Normalized wound area at different time points, relative to the initial wound area, after STAT3kd compared to NTkd control. (B) Cell migration rate (µm/h) of control and STAT3kd cells. (C) Average number of FAs per cell after STAT3kd compared to NTkd control. (D) Area per FA (µm2) after STAT3kd compared to NTkd control. (E) Normalized wound area at different time points, relative to the initial wound area, after LMNAkd compared to NTkd control in presence (blue) or absence of IL6/IL6R (gray). (F) Cell migration rate (µm/h) of control and LMNAkd cells in presence (blue) or absence of IL6/IL6R (gray). (G) Average number of FAs per cell after LMNAkd compared to NTkd control in presence (blue) or absence of IL6/IL6R (gray). (H) Area per FA (µm2) after LMNAkd compared to NTkd control in presence (blue) or absence of IL6/IL6R (gray). The lines in A and E are the mean values, the shaded regions indicate the standard deviation on the mean value of 8 replicates. Error bars in B and F indicate the standard deviation on the mean value of 8 replicates. Immunofluorescent staining was conducted in triplicate and a minimum of 100 cells were imaged per replicate. In the boxplots the horizontal line indicates the median, boxes the 25th and 75th percentile, and whiskers the 5th and 95th percentile. For all figures, significance was calculated with either ANOVA or non-parametric contrast-based multiple comparison tests; *** = p-value < 0.001.
To check whether reduced IL6R expression contributed to the phenotype of LMNAkd cells, we treated LMNAkd cells with recombinant human IL6 and IL6 receptor (IL6R). This however, did not restore FSCN1 expression (Fig. S2C), nor did it affect wound healing potential, the number of FAs per cell or FA area (Fig. 5E-H).
A-type lamin depletion affects nuclear translocation of MKL1
Megakaryoblastic leukemia 1 (MKL1)-serum response factor (SRF) signaling signaling is crucial for cytoskeletal organization and FA assembly and FSCN1 is a target gene of SRF.28-30 Previous studies have shown that MKL1 – SRF signaling is impaired in lamin A/C deficient cells.31 We quantified MKL1 localization via immunofluorescence and observed a significant decrease in nuclear translocation of MKL1 in LMNAkd fibroblasts (Fig. 6).
Figure 6.
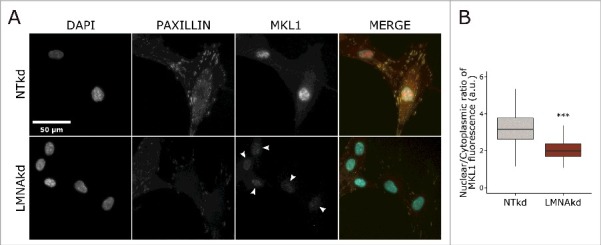
A-type lamin depletion reduces nuclear translocation of MKL1. (A) Representative images of NTkd and LMNAkd cells after immunofluorescence staining for paxillin (yellow), MKL1 (red) and counterstaining with DAPI (cyan). Arrowheads show reduced nuclear MKL1 in LMNAkd cells. (B) Normalized mean fluorescence (%) of nuclear MKL1 relative to NTkd cells. The immunofluorescent staining was conducted in triplicate and a minimum of 100 cells were imaged per replicate. In the boxplots the horizontal line indicates the median, boxes the 25th and 75th percentile, and whiskers the 5th and 95th percentile. Significance was calculated with the Wilcoxon rank sum test; *** = p-value < 0.001.
ARP2/3 inhibition causes FA attrition
To investigate whether reduced protein levels of ACTR2 and ACTR3 impaired FA formation, we inhibited the ARP2/3 complex in normal fibroblasts with bardoxolone methyl (CDDO-me). Fibroblasts were treated for 2 hours with 5 µM or 10 µM CDDO-me. Both concentrations reduced the number, the fluorescence, and the area of paxillin foci as compared to vehicle treated cells (Fig. 7), suggesting that Arp2/3 complex contributes to lamin A/C mediated FA formation.
Figure 7.
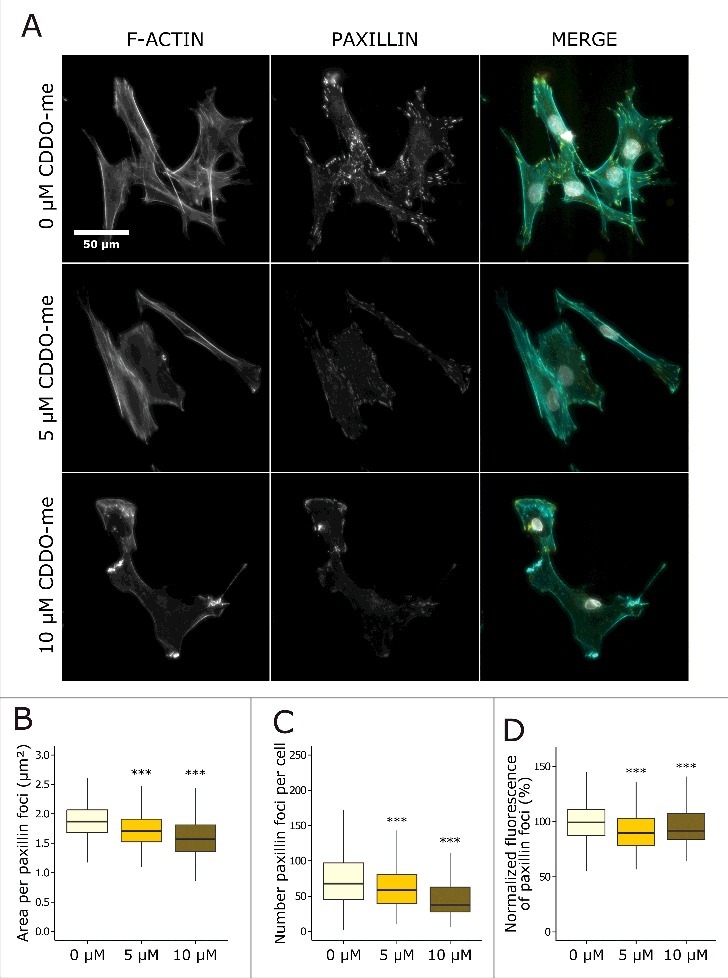
Chemical inhibition of the ARP2/3 complex by CDDO-me reduces FA and causes cell detachment. (A) Representative images of fibroblasts treated with different concentrations of CDDO-me (0 µM, 5 µM and 10 µM) for 2 hours after rhodamine phalloidin staining for actin (cyan), immunofluorescence staining for paxillin (yellow), and counterstaining with DAPI (gray). (B) Area per paxillin foci (µm2). (C) Number of paxillin foci per cell. (D) Normalized mean fluorescence (%) of paxillin foci relative to vehicle treated cells. The immunofluorescent staining was conducted in triplicate and a minimum of 100 cells were imaged per replicate. In the boxplots the horizontal line indicates the median, boxes the 25th and 75th percentile, and whiskers the 5th and 95th percentile. For all figures, significance was calculated with the Wilcoxon rank sum test; * = p-value < 0.05; ** = p-value < 0.01; *** = p-value < 0,001.
Discussion
To highlight the molecular changes that appear in the context of loss of A-type lamins, we performed a SILAC based quantitative proteomics experiment on human dermal fibroblasts after LMNAkd. Using GO enrichment analysis we found that proteins involved in actin cytoskeleton organization were affected by LMNAkd, which is in line with previous observations in fibroblasts from patients carrying LMNA mutations.10 What is novel in our data is a direct connection between the A-type lamins and FA formation. Specifically, proteins involved in FAs such as ACTR2, ACTR3, and FSCN1 were significantly downregulated in LMNAkd cells. Previously, FSCN1 knockdown has been shown to increase FA surface and ARP2/3 has been shown to trigger FA formation. Therefore, LMNAkd mediated reduction of Arp2/3 complex and FSCN1 could both increase or decrease FA formation.32-34 Via immunofluorescent staining and image analysis we discovered a significant reduction in the average FA size per cell for vinculin and paxillin, and a significant reduction in paxillin positive foci in LMNAkd cells. This corresponds well with earlier results reporting smaller FAs in Lmna−/− MEFs, and a decrease in cell-matrix adhesion sites after mechanical challenge of LMNA-mutated (ΔK32-P1, R429W and L380S) myoblasts.35,36 Next to the effects on FA size, a remarkable decrease of nuclear FAK was observed in LMNAkd cells, which might be associated with decreased proliferation defects that have been observed in LMNAkd and lamin A/C deficient cells.15,37-39
A reduction of FA size may suggest that LMNAkd cells are not as strongly attached to the substrate as NTkd cells, which was also indicated by an adhesion assay in which cells were allowed to attach for an hour before washing. However, such an assay only reflects the speed of attachment and not the actual adhesive potential or level of contractility in the attached cells. For those cells that were attached, we found more pronounced stress fibers and measured significantly higher traction forces during detachment, indicating increased cytoskeletal tension. More pronounced stress fibers might be attributed to a reduction in FSCN1 expression, since FSCN1 depletion has been shown to reorganize actin filaments into thicker, more contractile bundles, plausibly by slowing down actin polymerization at the stress fiber termini enabling the incorporation of a higher number of myosin II molecules.34 Counterintuitively, the actin stress fibers can still attach to and exert even stronger traction forces on smaller FAs. However it should be emphasized that stress fibers, which are not directly anchored at FAs, such as transverse arcs, also cover a portion of the measured traction forces, albeit to a lesser extent.39 Moreover, while FAs are considered to be the predominant mechanism by which cells exert traction forces on their extracellular matrix, it has also been noted that small FAs at the leading edge of a migrating cell developed greater traction force than the larger FAs further away from the front, suggesting that there is no one-to-one relationship between FA size and tensile force.40,41 In addition, the increased traction force may represent a compensatory mechanism that arises from the loss or reduction of mechanical coupling between the cytoskeleton and the nucleus. Supporting this notion, is the increased traction force observed in Nesprin 1-depleted cells, aligning with their shared role in the LINC.42 However, in the latter cells a concomitant increase in the number of FAs was observed, whereas we have not detected a significant change in the absolute number of FAs (as measured by vinculin).42 Our data thus revealed an apparent uncoupling between cell adhesive mechanisms and cytoskeletal tension. Similar uncoupling has previously also been documented for DAP kinase,43 an enzyme that seems to promote disassembly of FAs but not stress fibers in cells receiving serum factors.43 Interestingly, DAP kinase enhances the formation of stress fibers in response to oxidative stress,44 which is a hallmark of lamin A/C depleted cells.10,15,45 Loss of A-type lamins may thus activate a similar pathway.
Since FA size dictates cell migration rate, we measured cell mobility by tracking individual cells at the leading edge in a wound-healing assay. Whereas LMNAkd cells showed an overall lower wound healing potential – quite similar to previous observations in Lmna−/− MEFs and after LMNAkd in SW480 colon cancer cells36,46,47 – motility of individual cells was indeed increased. This may be a direct effect of reduced PXN expression, since low levels of paxillin have been shown to increase motility in lung cancer cells.48,49 Similar observation have been linked to a decrease in vinculin expression.50 The reduced wound healing potential is rather due to a loss of directionality, which may be caused by delayed reorientation of the nucleus and the microtubule-organizing center toward the wound, but may also be aggravated by impaired FA formation.51,46 Interestingly, the ARP2/3 complex and FSCN1 have also been linked to impaired wound healing potential: depletion of FSCN1 reduced wound healing rate in breast cancer cells25 and chemical inhibition of ARP2/3-dependent branched actin polymerization or knockdown of ACTR3 decreased the wound healing rate of Rat2 cells.52 Hence, the altered expression of these proteins is in line with the impaired wound healing observed in LMNAkd cells.
The reduced expression of FSCN1 after LMNAkd correlated with reduced IL6R and STAT3 expression. In contrast, IL6 showed a moderate increase in gene expression, possibly representing a compensatory mechanism. STAT3 depletion could not reproduce the de-adhesive phenotype seen after LMNAkd nor did IL6/IL6R treatment alleviate the adhesive defects seen in LMNAkd cell. This might point to a cell-type specific regulation of FSCN1 expression by the IL6-STAT3 axis or cross-talk with other regulatory pathways.
Since MKL1-SRF signaling regulates the expression of a large number of genes involved in actin cytoskeleton organization and FA, we analyzed the subcellular localization of MKL1.29 In line with studies in Lmna−/− MEFs and LMNA-mutated muscle precursors, we observed a decrease in nuclear MKL1 in LMNAkd cells.31,35 Hence, as postulated by Ho et al.31 lamin A/C depletion might affect actin polymerization, through mislocalized emerin, which in turn blocks nuclear translocation of MKL1, subsequently disturbing expression of MKL1-SRF target genes.31 Indeed, knockdown experiments in human mesenchymal stem cells (hMSCs) have shown that LMNA expression correlates with expression of SRF and its cofactors and functional emerin-lamin A/C interactions are required for cell spreading and proliferation.53,54 Interestingly FSCN1 has been identified as a putative novel SRF target gene.28,30 However SRF deficient cells show defective formation of stress fibers,30 as opposed to LMNAkd cells. A possible explanation for this discrepancy might be elevated yes associated protein (YAP) signaling, which counteracts this effect, as observed in LMNA-mutated muscle precursors,35 or the DAP kinase pathway mentioned earlier.
To elucidate whether decreased protein levels of ACTR2 and ACTR3 contribute to impaired FA formation in LMNAkd cells, we inhibited the ARP2/3 complex with CDDO-me. ARP2/3 inhibition affected FA and induced cell detachment. This was also observed after knockdown of ACTR3 in HeLa cells.33 However, it should be stressed that the effects of chemical inhibition of ARP2/3 are exaggerated, since LMNAkd cells still express ACTR2 and ACTR3. Low levels of ACTR2 and ACTR3 proteins probably affect the number of the hybrid vinculin-ARP2/3 complexes which are involved in FA formation.33 Next to reduced protein levels of the APR2/3 subunits, reduced paxillin expression might also contribute to impaired FA formation in LMNAkd cells, as shown in pulmonary arterial muscle cells after paxillin knockdown and in paxillin null mouse embryonic stem cells.55,56 In contrast, FSCN1 knockdown has been associated with larger FAs and a higher number per cell,34 so it is likely that decreased ACTR2, ACTR3 and paxillin protein levels overrule the effect of FSCN1 depletion on FA.
In conclusion, our data suggest that reduced LMNA expression influences the levels of proteins involved in actin cytoskeleton organization, in particular those of FA formation. This altered protein expression perturbs the balance between FAs and cytoskeletal tension as it is accompanied by decreased FA size, reduced initial cell attachment, and increased cell migration, but also increased cytoskeletal tension. Decreased protein levels of ACTR2, ACTR3 and paxillin likely contribute to the phenotype, whereas the STAT3-IL6 axis does not. Resolving the exact pathways underlying this uncoordinated regulation may help to better understand mechano-signaling defects witnessed in certain laminopathies. In order to do so, future studies should also include a comparison with 3D cultures as they more faithfully reflect the in vivo situation.57,58
Materials and methods
Cell culture
Normal human dermal fibroblasts (NHDF, Promocell, C-12300) were cultured in T25 or T75 culture flasks in DMEM High Glucose with L-Glutamine medium (Lonza, BE12-604F) supplemented with 10% fetal bovine serum (Gibco, Life Technologies, 10500–064) and 1% penicillin/streptomycin (Westburg, DE17-602E/12), at 37°C and 5% CO2, according to standard procedures. All experiments were performed with cells in between passages 9 and 20. In case of direct comparison, passage-matched cells were used. Where indicated, fibroblasts were treated with 100 ng/ml human recombinant IL6 (Thermo Fisher Scientific, F10395-HNAE-25) and 200 ng/ml human recombinant IL6 receptor (IL6R) (Sigma-Aldrich, SRP3097-20UG) for 24 h.
SiRNA-mediated knockdown
Expression of LMNA was silenced with siGENOME Lamin A/C siRNA (Dharmacon, D-001050-01-20). STAT3 expression was silenced with ON-TARGETplus STAT3 siRNA (Dharmacon, L-003544-00-0005). Stealth RNAi siRNA Negative Control, Med GC (Life Technologies, 12935-300) was used as a negative non-targeting control (NTkd). siRNA transfections were performed using Lipofectamine RNAi-MAX Transfection Reagent (Life technologies, 13778-075) according to the manufacturer's instructions. A sustained knockdown was induced by 2 transfection rounds separated by 72 h. All measurements were carried out 168 h (1 week) after the initial transfection.
Stable isotope labeling and mass spectrometry
NHDF cells were grown in SILAC DMEM (lacking L-arginine and L-lysine, Cambridge Isotope Laboratories, DMEM-500) supplemented with 1% penicillin/streptomycin/L-glutamine (Gibco, 10378–016) and 10% dialyzed FBS (Cambridge Isotope Laboratories, FBS-50). Before knockdown, LMNAkd fibroblasts were grown in medium supplemented with [13C6]-L-arginine (Cambridge Isotope Laboratories, CLM-2265-H-0.1) and [13C6]-L-lysine (Cambridge Isotope Laboratories, CLM-2247-H-0.05) and control (NTkd) fibroblasts in medium supplemented with 0.47 mM L-arginine (Cambridge Isotope Laboratories, ULM-8347-0.1) and 0.46 mM L-lysine (Cambridge Isotope Laboratories, ULM-8766-0.05) for at least 5 passages. A labeling efficiency of 99.2% was obtained with no significant arginine to proline conversion (Suppl. Doc. S2). NTkd and LMNAkd fibroblasts (passage 17) were lysed by applying 3 freeze-thaw cycles and digested using trypsin. A fraction of the samples was mixed and analyzed by the Orbitrap Velos mass spectrometer, based on the results, the mixing was changed to obtain a 1:1 ratio. The peptide mixture was analyzed by a LC−MS/MS system using an Ultimate 3000 RSLC nano liquid chromatograph (Thermo Fisher Scientific, Bremen, Germany) in-line connected to a Q Exactive mass spectrometer (Thermo Fisher Scientific). Peptides were identified and quantified with MaxQuant,59 which used Mascot60 as search engine. Reversed sequences and commonly observed contaminants were removed and the relative quantification ratios were normalized and log transformed using Perseus software (Computation Systems Biochemistry, Max Planck Institute of Biochemistry, München, Germany). An outlier significance score for log protein ratios (significance A) was calculated, a p-value of 0.05 was used as threshold value.59 The SILAC experiment was conducted in triplicate, but one replicate was omitted since no significant depletion of A-type lamins was observed in that replicate. The complete data set is provided as supplementary material (Suppl. Doc. S1), in which SILAC ratio's (log2 fold change), posterior error probability (PEP), intensity, significance A levels, sequence coverage, peptide counts (razor and unique peptides), molecular weight (kDa), protein IDs, protein names and gene names are presented. Gene ontology of identified proteins was analyzed for protein class with the online resource PANTHER (Protein ANalysis THrough Evolutionary Relationships)61 and gene ontology enrichment analysis was performed with GOrilla (Gene Ontology enRIchment AnaLysis and VisuaLizAtion tool).62
Quantitative PCR
RNA was extracted from cells using the RNAeasy mini kit (Qiagen, 74104), with on-column DNase digestion. Concentrations of purified RNA were measured with the NanoDrop 2000 (Thermoscientific). Per sample, 1 µg of RNA was converted to cDNA using SuperScript® III Reverse Transcriptase (RT) (Life Technologies, 18080–044). All qPCR reactions were performed on a RotorGene 3000 (Qiagen/Corbett) using the SensiMix™ SYBR® No-ROX Kit (Bioline, QT650) according to the manufacturer's instructions. Relative abundance of LMNA transcripts (forward: TGGACGAGTACCAGGAGCTT; reverse: ACTCCAGTTTGCGCTTTTTG), IL6 transcripts (forward: AGTGAGGAACAAGCCAGAGC; reverse: GTCAGGGGTGGTTA-TTGCAT), IL6R transcripts (forward: GGCACGCCTTGGACAGAATC; reverse: AAGAATCTTGCACTGGGAGGC), STAT3 transcripts (forward: CAGGAGCATCC-TGAAGCTGAC; reverse: GGTGAGGGACTCAAACTG-CC), ACTR2 transcripts (forward: GTAGCCATCCAGGCAGTTCT; reverse: AAGGCGTATCCTCGCAACAG), ACTR3 transcripts (forward: CTGTGTGGTGGACTGTG-GCA; reverse: TCAACACCTTTCATCACCCTCC), FSCN-1 transcripts (forward: CCAACCGCTCCAGCTATGAC; reverse: CTGCCCACCGTCCAGTATTT), CLIC4 transcripts (forward: GAGGACAAAGAGCCCCTCATC; reverse: GGGGCAGTTTCCTATGCTTTC) and PXN transcripts (forward: GGAAAAGTTGCGGGGCATAG; reverse: GT-GGTAGACTCCAAGTCCGC), were measured relative to ACTB (forward: CCTTGCACATGCCGGAG; reverse: GCACAGAGCCTCGCCTT) and GAPDH (forward: TGC-ACCACCAACTGCTTAGC; reverse: GGCATGGACTGT-GGTCATGAG) reference transcripts. Analysis was done using the ΔΔCt-method.63
Immunofluorescence staining
Cells were grown on glass coverslips and fixed in 4% paraformaldehyde for 15 min at room temperature and washed (3 × 5 min) with PBS. Subsequently, cells were permeabilized with 0.5% Triton X-100 (5 min), and incubated with primary antibody diluted in 50% fetal bovine serum (FBS) for 60 min. After minimally 3 PBS washing steps, slides were incubated with secondary antibody diluted in 50% FBS for 30 min and, where indicated, with rhodamine phalloidin (ThermoFisher Scientific, R415) for the labeling of F-actin. After the incubation the slides were washed again, and mounted with VECTASHIELD™ Mounting Medium (Vector Labs, VWR, 101098–042) containing 1 µg/ml 4′,6-diamino-2-phenylindole (DAPI, ThermoFisher Scientific, D1306). Primary antibodies used were directed against lamin A (Rabbit, Abcam, ab26300), paxillin (Mouse, Merck Millipore, 05-417), vinculin (Mouse, Sigma-Aldrich, V9131), FAK (Rabbit, Santa Cruz Biotechnology Inc., sc-932) and MKL1 (Rabbit, Abcam, ab49311). Secondary antibodies were DyLight 488 conjugated donkey anti-rabbit (Jackson ImmunoResearch Laboratories Inc., JAC-705606147) and DyLight 488 conjugated donkey anti-mouse (Jackson ImmunoResearch Laboratories Inc., JAC-715486150). Immunofluorescently stained cells were visualized using a Nikon Ti Eclipse inverted widefield fluorescence microscope (Nikon Instruments) with 40× Plan Apo oil (NA = 1.3) or 60× Plan Apo VC (NA = 1.4) objectives. Immunofluorescent staining was performed in triplicate, and per microscope slide a minimum of 9 regions was imaged.
Western blot
Cells were grown in T75 culture flasks and lysed using the whole-cell extraction protocol of the Nuclear Extract Kit (Active Motif, 40010). Protein concentration was measured with the Pierce 660 nm assay (Thermo Scientific, 22662). Cell lysates were subjected to SDS-PAGE (8% or 12% bis-tris with MOPS running buffer) and transferred to BioTrace PVDF membranes (Pall Corporation, 66542). Primary antibodies were directed against lamin A/C (Mouse, Santa Cruz Biotechnology Inc., sc-56139), Arp2 (Rabbit, Abcam, ab47654), Arp3 (Mouse, Abcam, ab49671), Fascin (Mouse, Abcam, ab78487), STAT3 (Cell Signaling, #9139), paxillin (Mouse, Merck Millipore, 05–417), vinculin (Mouse, Sigma-Aldrich, V9131), FAK (Rabbit, Santa Cruz Biotechnology Inc., sc-932), β actin (Mouse, Abcam, ab8226) and nleolin (control) (Rabbit, Novus Biologicals, NB600-241). HRP conjugated goat anti-mouse (Sigma-Aldrich, A4416) and HRP conjugated goat anti-rabbit (Sigma-Aldrich, A6154) were used as secondary antibodies. Proteins were detected by chemiluminescence with Immobilon Western chemiluminescent HRP substrate (Millipore, WBKLS0100).
Wound healing assay and cell tracking
Cells were seeded into a 24 well plate and grown up to 100% confluency. A scratch was applied using a pipette tip. The cells were washed twice with PBS to remove floating debris. To inhibit cell division, DMEM without FBS was used. Cell migration was monitored by transmission microscopy with a Nikon Ti Eclipse inverted widefield fluorescence microscope (Nikon Instruments), and cell migration rate was determined by plotting the scratch area as a function of time. By fitting a linear trend line to this plot, the slope of the curve can be estimated, and by dividing the slope by 2 times the length (l) of the wound (as cells are migrating of both edges of the wound toward each other) the cell migration rate was calculated.64
The wound healing assay was complemented with individual cell tracking, therefore nuclei were stained with Hoechst 33342 (ThermoFisher Scientific, H3570) and time-lapse images, with a temporal resolution of 10 min, were acquired. Image analysis is described below.
Cell adhesion assay
A 96 well plate was coated with bovine collagen type I (10µg/ml in PBS) (VWR, 392-2502), stored overnight at 4°C, and rinsed. Remaining protein binding sites were blocked with BSA (1% in PBS), incubated for 30 min at room temperature and rinsed. In the meantime cells were detached with 2 mM EDTA (in PBS) and counted. 20,000 cells per 96 well plate were seeded and incubated for 60 min at 37°C and 5% CO2 humidified atmosphere. Coated wells without cells were used as background control. The wells were 5 times thoroughly washed with PBS and fixed with 96% ethanol for 10 min at room temperature. The cells were stained with crystal violet (0.1% in 10% ethanol) and incubated for 30 min at room temperature. The wells were thoroughly washed with demineralized water to remove excess stain, and acetic acid (10% in demineralized water) was added and incubated for 20 min at room temperature on a shaker. Absorbance was measured at 595 nm with a spectrophotometer (Tecan Infinite 200 Pro, Männedorf, Switzerland). Cell adhesion was registered as absorbance corrected for background.
Traction force microscopy
Polyacrylamide gels (0.1% bis and 5% acrylamide; 70 µm thick) containing 1:50 volume of carboxylate-modified fluorescence latex beads (0.2 µm Fluospheres, Molecular Probes, Eugene, OR) were fabricated on 25-mm diameter glass coverslips.65 The Young's modulus of the gel was estimated to be 15 kPa using Dynamic Mechanical Analysis (Mettler Toledo, Switzerland). Collagen-coated PDMS stamps were allowed to react with the activated gel for 1 h at 37°C to create collagen-coated adhesive islands. After removal of the excess of collagen by washing with PBS, unprinted areas of the gels were passivated with a bovine serum albumin solution overnight. Cells (5000/ml) were seeded on the gel and incubated till they were completely spread. Fluorescence images of the gel containing fluorescent beads immediately beneath the patterned cells were taken during cell detachment with trypsin. The change of the position of the fluorescence beads were measured in Matlab software using an algorithm described previously.66 This yielded the discretized displacement field between 2 consecutive frames. The calculated displacements were summed up to determine the overall 2-dimensional displacement field. The traction field was then calculated from the displacement field by solving the inverse of the Boussinesq solution from the displacement field on the surface of an elastic halfspace to obtain the traction field when the mechanical properties of the gel are known. The Poisson ratio of the gel was assumed to be close to 0.5. The interior of the cell was subdivided into 64 µm2 squares to approximate the discretized localization of contractile forces.
Image analysis
Image processing was performed in Fiji (http://fiji.sc), a packaged version of ImageJ freeware.67 The focal adhesion points were quantified by means of a custom-designed image processing pipeline,68 which is essentially based on a high-content analysis workflow described before20 and is available upon request. In brief, the analysis consists of a few image preprocessing steps, followed by hierarchical segmentation of nuclei, cells, and focal adhesion points (FAs) to allow region-specific analysis of objects. Nuclear regions of interest (ROIs) are segmented in the DAPI channel after filtering with a Gaussian kernel of small radius (Σ = 3), automatic thresholding according to Otsu's algorithm and watershed-based separation. Cellular boundaries are then delineated by conditional region growing from the nuclear seeds restricted by a Voronoi tesselation. Finally, FAs are specifically enhanced in the FA channel by means of a Laplacian operator and binarized using the Triangle autothresholding algorithm. The resulting ROIs were used for analyzing shape (area and circularity) and intensity metrics of objects larger than a predefined size (>5 pixels) on the original image.
Stress fiber thickness was quantified in microscopic images of phalloidin-stained cells by applying a fast Fourier transformation, low frequency filtering, inverse transformation and Isodata autothresholding, after which fluorescence intensity and area per stress fiber was calculated per cell.
Cell mobility was determined by tracking nuclei from Hoechst 33342 counterstained individual cells through time using a dedicated script (trackRuptures.ijm; available upon request).69 In this analysis, nuclei are deteced using a Laplacian of Gaussian blob detector, binarized using an automatic threshold algorithm and touching nuclei are separated using a conditional watershed algorithm. Once nuclei have been detected in all time points, they are connected through time based on a nearest neighbor algorithm, which is confined by a maximum displacement. If for a given nucleus, no corresponding neighbor is found in the next time point, potential candidates are sought in the closest subsequent time point. After, this automatic procedure, the operator can manually check and correct tracks.
Statistical analyses
Data analysis and visualization was performed in R statistical freeware (http://www.r-project.org). Standard statistical methods were employed, including the Shapiro-Wilk Normality Test to assess normality of the data; Levene's test to assess homoscedasticity; Student's t-test, ANOVA, and the Kruskal-Wallis rank sum test to assess differences between the group means; and Tukey (after ANOVA) and Dunnett type (After Kruskal-Wallis) post-hoc tests to assess significance for each group. We also used non-parametric contrast-based multiple comparison tests and Wilcoxon tests.70 Significance levels were indicated as follows: p < 0.05 (*), p < 0.01 (**), and p < 0.001 (***). For graphics and annotation, the R program was expanded with the ggplot2 package.71
Supplementary Material
Abbreviations
- CDDO-me
2-Cyano-3,12-dioxo-oleana-1,9(11)-dien-28-oic acid methyl ester or bardoxolone methyl
- DCM
dilated cardiomyopathy
- FA
focal adhesion
- GO
gene ontology
- HGPS
Hutchinson-Gilford progeria syndrome
- LMNAkd
LMNA knockdown
- MEFs
mouse embryonic fibroblasts
- NHDF
normal human dermal fibroblasts
- NTkd
non-targeting knockdown
- RD
restrictive dermopathy
- SILAC
stable isotope labeling of amino acids in cell culture
- STAT3kd
STAT3 knockdown
- TFM
Traction force microscopy
Disclosure of potential conflicts of interest
No potential conflict of interest was reported by the authors.
Acknowledgments
We acknowledge the nanobody lab of Prof. Dr. Jan Gettemans for sharing the antibodies directed against FSCN1, ACTR2 and ACTR3. Dr. Pieter Rondou of the Center for Medical Genetics is acknowledged for sharing the antibodies directed against vinculin and STAT3. At last Renate De Smedt is acknowledged for helping with the western blot analysis of vinculin.
Funding
This research was financially supported by the University of Antwerp (TTBOF/29267 to WDV), the Special Research Fund of Ghent University (project BOF/11267/09), NB-Photonics (Project code 01-MR0110), FRIA-FNRS (Grant to DM)) and by the Netherlands Science Organization (NWO-VIDI 917.10.364 to KW).
References
- [1].Broers JL, Ramaekers FC, Bonne G, Yaou RB, Hutchison CJ. Nuclear lamins: laminopathies and their role in premature ageing. Physiol Rev 2006; 86:967-1008; PMID:16816143; https://doi.org/ 10.1152/physrev.00047.2005 [DOI] [PubMed] [Google Scholar]
- [2].Plasilova M, Chattopadhyay C, Ghosh A, Wenzel F, Demougin P, Noppen C, Schaub N, Szinnai G, Terracciano L, Heinimann K. Discordant gene expression signatures and related phenotypic differences in lamin A- and A/C-related Hutchinson-Gilford progeria syndrome (HGPS). PLoS One 2011; 6:e21433; https://doi.org/ 10.1371/journal.pone.0021433 [DOI] [PMC free article] [PubMed] [Google Scholar]
- [3].Nitta RT, Jameson SA, Kudlow BA, Conlan LA, Kennedy BK. Stabilization of the retinoblastoma protein by A-type nuclear lamins is required for INK4A-mediated cell cycle arrest. Mol Cell Biol 2006; 26:5360-72; PMID:16809772; https://doi.org/ 10.1128/MCB.02464-05 [DOI] [PMC free article] [PubMed] [Google Scholar]
- [4].McCord RP, Nazario-Toole A, Zhang H, Chines PS, Zhan Y, Erdos MR, Collins FS, Dekker J, Cao K. Correlated alterations in genome organization, histone methylation, and DNA-lamin A/C interactions in Hutchinson-Gilford progeria syndrome. Genome Res 2013; 23:260-9; PMID:23152449; https://doi.org/ 10.1101/gr.138032.112 [DOI] [PMC free article] [PubMed] [Google Scholar]
- [5].Maraldi NM, Capanni C, Lattanzi G, Camozzi D, Facchini A, Manzoli FA. SREBP1 interaction with prelamin A forms: a pathogenic mechanism for lipodystrophic laminopathies. Adv Enzyme Regul 2008; 48:209-23; PMID:18155670; https://doi.org/ 10.1016/j.advenzreg.2007.11.003 [DOI] [PubMed] [Google Scholar]
- [6].Wang J, Robinson JF, O'Neil CH, Edwards JY, Williams CM, Huff MW, Pickering JG, Hegele RA. Ankyrin G overexpression in Hutchinson-Gilford progeria syndrome fibroblasts identified through biological filtering of expression profiles. J Hum Genet 2006; 51:934-42; PMID:17033732; https://doi.org/ 10.1007/s10038-006-0042-0 [DOI] [PubMed] [Google Scholar]
- [7].Singh M, Hunt CR, Pandita RK, Kumar R, Yang C-R, Horikoshi N, Bachoo R, Serag S, Story MD, Shay JW, et al.. Lamin A/C depletion enhances DNA damage-induced stalled replication fork arrest. Mol Cell Biol 2013; 33:1210-22; PMID:23319047; https://doi.org/ 10.1128/MCB.01676-12 [DOI] [PMC free article] [PubMed] [Google Scholar]
- [8].Rivera-Torres J, Acín-Perez R, Cabezas-Sánchez P, Osorio FG, Gonzalez-Gómez C, Megias D, Cámara C, López-Otín C, Enríquez JA, Luque-García JL, et al.. Identification of mitochondrial dysfunction in hutchinson-gilford progeria syndrome through use of stable isotope labelling with amino acids in cell culture. J Proteomics 2013; 91:466-77.; PMID:23969228 [DOI] [PubMed] [Google Scholar]
- [9].Mateos J, Landeira-Abia A, Fafián-Labora JA, Fernández-Pernas P, Lesende-Rodríguez I, Fernández-Puente P, Fernández-Moreno M, Delmiro A, Martín MA, Blanco FJ, et al.. iTRAQ-based analysis of progerin expression reveals mitochondrial dysfunction, reactive oxygen species accumulation and altered proteostasis. Stem Cell Res Ther 2015; 6:119; PMID:26066325; https://doi.org/ 10.1186/s13287-015-0110-5 [DOI] [PMC free article] [PubMed] [Google Scholar]
- [10].Magagnotti C, Bachi A, Zerbini G, Fattore E, Fermo I, Riba M, Previtali SC, Ferrari M, Andolfo A, Benedetti S. Protein profiling reveals energy metabolism and cytoskeletal protein alterations in LMNA mutation carriers. Biochim Biophys Acta 2012; 1822:970-9; PMID:22326558; https://doi.org/ 10.1016/j.bbadis.2012.01.014 [DOI] [PubMed] [Google Scholar]
- [11].Peinado JR, Quirós PM, Pulido MR, Mariño G, Martínez-Chantar ML, Vázquez-Martínez R, Freije JMP, López-Otín C, Malagón MM. Proteomic profiling of adipose tissue from Zmpste24-/- mice, a model of lipodystrophy and premature aging, reveals major changes in mitochondrial function and vimentin processing. Mol Cell Proteomics 2011; 10:M111.008094; PMID:21828285; https://doi.org/ 10.1074/mcp.M111.008094 [DOI] [PMC free article] [PubMed] [Google Scholar]
- [12].Liu P-Q, Tan S, Mendel MC, Murrills RJ, Bhat BM, Schlag B, Samuel R, Matteo JJ, de la Rosa R, Howes K, et al.. Isogenic human cell lines for drug discovery: Regulation of target gene expression by engineered zinc-finger protein transcription factors. J Biomol Screen 2005; 10:304-13; PMID:15964931; https://doi.org/ 10.1177/1087057104272663 [DOI] [PubMed] [Google Scholar]
- [13].Burkhardt AM, Zlotnik A. Translating translational research: mouse models of human disease. Cell Mol Immunol 2013; 10:373-4; PMID:23934028; https://doi.org/ 10.1038/cmi.2013.19 [DOI] [PMC free article] [PubMed] [Google Scholar]
- [14].Mak IW, Evaniew N, Ghert M. Lost in translation: animal models and clinical trials in cancer treatment. Am J Transl Res 2014; 6:114-8; PMID:24489990 [PMC free article] [PubMed] [Google Scholar]
- [15].Sieprath T, Corne TD, Nooteboom M, Grootaert C, Rajkovic A, Buysschaert B, Robijns J, Broers JL, Ramaekers FC, Koopman WJ, Willems PHGM, De Vos WH.. Sustained accumulation of prelamin A and depletion of lamin A/C both cause oxidative stress and mitochondrial dysfunction but induce different cell fates. Nucleus 2015; 6:1-11; PMID:25644654 [DOI] [PMC free article] [PubMed] [Google Scholar]
- [16].Sullivan T, Escalante-Alcalde D, Bhatt H, Anver M, Bhat N, Nagashima K, Stewart CL, Burke B. Loss of A-type lamin expression compromises nuclear envelope integrity leading to muscular dystrophy. J Cell Biol 1999; 147:913-9; PMID:10579712; https://doi.org/ 10.1083/jcb.147.5.913 [DOI] [PMC free article] [PubMed] [Google Scholar]
- [17].Lu JT, Muchir A, Nagy PL, Worman HJ. LMNA cardiomyopathy: cell biology and genetics meet clinical medicine. Dis Model Mech 2011; 4:562-8; PMID:21810905; https://doi.org/ 10.1242/dmm.006346 [DOI] [PMC free article] [PubMed] [Google Scholar]
- [18].Argenzio E, Margadant C, Leyton-Puig D, Janssen H, Jalink K, Sonnenberg A, Moolenaar WH. CLIC4 regulates cell adhesion and beta1 integrin trafficking. J Cell Sci 2014; 127:5189-203; PMID:25344254; https://doi.org/ 10.1242/jcs.150623 [DOI] [PubMed] [Google Scholar]
- [19].Berryman MA, Goldenring JR. CLIC4 is enriched at Cell-Cell junctions and colocalizes with AKAP350 at the centrosome and midbody of cultured mammalian cells. Cell Motil Cytoskeleton 2003; 56:159-72; PMID:14569596; https://doi.org/ 10.1002/cm.10141 [DOI] [PubMed] [Google Scholar]
- [20].De Vos WH, Van Neste L, Dieriks B, Joss GH, Van Oostveldt P. High content image cytometry in the context of subnuclear organization. Cytometry A 2010; 77:64-75; PMID:19821512 [DOI] [PubMed] [Google Scholar]
- [21].Dang I, Gorelik R, Sousa-Blin C, Derivery E, Guérin C, Linkner J, Nemethova M, Dumortier JG, Giger FA, Chipysheva TA, et al.. Inhibitory signalling to the Arp2/3 complex steers cell migration. Nature 2013; 503(7475):281-4 [DOI] [PubMed] [Google Scholar]
- [22].Hwang JH, Smith CA, Salhia B, Rutka JT. The role of fascin in the migration and invasiveness of malignant glioma cells. Neoplasia 2008; 10:149-59; PMID:18283337; https://doi.org/ 10.1593/neo.07909 [DOI] [PMC free article] [PubMed] [Google Scholar]
- [23].Kim DH, Wirtz D. Focal adhesion size uniquely predicts cell migration. FASEB J 2013; 27:1351-61; PMID:23254340; https://doi.org/ 10.1096/fj.12-220160 [DOI] [PMC free article] [PubMed] [Google Scholar]
- [24].Snyder M, Huang XY, Zhang JJ. Signal transducers and activators of transcription 3 (STAT3) directly regulates cytokine-induced fascin expression and is required for breast cancer cell migration. J Biol Chem 2011; 286:38886-93; PMID:21937440; https://doi.org/ 10.1074/jbc.M111.286245 [DOI] [PMC free article] [PubMed] [Google Scholar]
- [25].Snyder M, Huang J, Huang X-Y, Zhang JJ A signal transducer and activator of transcription 3·Nuclear Factor кB (Stat3·NFкB) complex is necessary for the expression of fascin in metastatic breast cancer cells in response to interleukin (IL)-6 and tumor necrosis factor (TNF)-α. Journal of Biol Chem 2014; 289:30082-89. [DOI] [PMC free article] [PubMed] [Google Scholar]
- [26].Debidda M, Wang L, Zang H, Poli V, Zheng Y. A role of STAT3 in Rho GTPase-regulated cell migration and proliferation. J Biol Chem 2005; 280:17275-85; PMID:15705584; https://doi.org/ 10.1074/jbc.M413187200 [DOI] [PubMed] [Google Scholar]
- [27].Lin Z-Q, Kondo T, Ishida Y, Takayasu T, Mukaida N. Essential involvement of IL-6 in the skin wound-healing process as evidenced by delayed wound healing in IL-6-deficient mice. J Leukoc Biol 2003; 73:713-21; PMID:12773503; https://doi.org/ 10.1189/jlb.0802397 [DOI] [PubMed] [Google Scholar]
- [28].Schratt G, Philippar U, Berger J, Schwarz H, Heidenreich O, Nordheim A. Serum response factor is crucial for actin cytoskeletal organization and focal adhesion assembly in embryonic stem cells. J Cell Biol 2002; 156:737-50; PMID:11839767; https://doi.org/ 10.1083/jcb.200106008 [DOI] [PMC free article] [PubMed] [Google Scholar]
- [29].Selvaraj A, Prywes R. Expression profiling of serum inducible genes identifies a subset of SRF target genes that are MKL dependent. BMC Mol Biol 2004; 5:13; PMID:15329155; https://doi.org/ 10.1186/1471-2199-5-13 [DOI] [PMC free article] [PubMed] [Google Scholar]
- [30].Schwartz B, Marks M, Wittler L, Werber M, Währisch S, Nordheim A, Herrmann BG, Grote P. SRF is essential for mesodermal cell migration during elongation of the embryonic body axis. Mech Dev 2014; 133:23-35; PMID:25020278; https://doi.org/ 10.1016/j.mod.2014.07.001 [DOI] [PubMed] [Google Scholar]
- [31].Ho CY, Jaalouk DE, Vartiainen MK, Lammerding J. Lamin A/C and emerin regulate MKL1-SRF activity by modulating actin dynamics. Nature 2013; 497:507-11; PMID:23644458; https://doi.org/ 10.1038/nature12105 [DOI] [PMC free article] [PubMed] [Google Scholar]
- [32].Mullins RD, Heuser JA, Pollard TD. The interaction of Arp2/3 complex with actin: nucleation, high affinity pointed end capping, and formation of branching networks of filaments. Proc Natl Acad Sci U S A 1998; 95:6181-6; PMID:9600938; https://doi.org/ 10.1073/pnas.95.11.6181 [DOI] [PMC free article] [PubMed] [Google Scholar]
- [33].Chorev DS, Moscovitz O, Geiger B, Sharon M. Regulation of focal adhesion formation by a vinculin-Arp2/3 hybrid complex. Nat Commun 2014; 5:3758; PMID:24781749; https://doi.org/ 10.1038/ncomms4758 [DOI] [PubMed] [Google Scholar]
- [34].Elkhatib N, Neu MB, Zensen C, Schmoller KM, Louvard D, Bausch AR, Betz T, Vignjevic DM. Fascin plays a role in stress fiber organization and focal adhesion disassembly. Curr Biol 2014; 24:1492-9; PMID:24930964; https://doi.org/ 10.1016/j.cub.2014.05.023 [DOI] [PubMed] [Google Scholar]
- [35].Bertrand AT, Ziaei S, Ehret C, Duchemin H, Mamchaoui K, Bigot A, Mayer M, Quijano-Roy S, Desguerre I, Lainé J, et al.. Cellular microenvironments reveal defective mechanosensing responses and elevated YAP signaling in LMNA-mutated muscle precursors. J Cell Sci 2014; 127:2873-84; PMID:24806962; https://doi.org/ 10.1242/jcs.144907 [DOI] [PubMed] [Google Scholar]
- [36].Hale CM, Shrestha AL, Khatau SB, Stewart-Hutchinson PJ, Hernandez L, Stewart CL, Hodzic D, Wirtz D. Dysfunctional connections between the nucleus and the actin and microtubule networks in laminopathic models. Biophys J 2008; 95:5462-75; PMID:18790843; https://doi.org/ 10.1529/biophysj.108.139428 [DOI] [PMC free article] [PubMed] [Google Scholar]
- [37].Lammerding J, Schulze PC, Takahashi T, Kozlov S, Sullivan T, Kamm RD, Stewart CL, Lee RT. Lamin A/C deficiency causes defective nuclear mechanics and mechanotransduction. J Clin Invest 2004; 113:370-8; https://doi.org/ 10.1172/JCI200419670 [DOI] [PMC free article] [PubMed] [Google Scholar]
- [38].Chen CY, Chi YH, Mutalif RA, Starost MF, Myers TG, Anderson SA, Stewart CL, Jeang KT. Accumulation of the inner nuclear envelope protein Sun1 is pathogenic in progeric and dystrophic laminopathies. Cell 2012; 149:565-77; PMID:22541428; https://doi.org/ 10.1016/j.cell.2012.01.059 [DOI] [PMC free article] [PubMed] [Google Scholar]
- [39].Soiné JRD, Brand CA, Stricker J, Oakes PW, Gardel ML, Schwarz US. Model-based traction force microscopy reveals differential tension in cellular actin bundles. PLoS Comput Biol 2015; 11:1-16 [DOI] [PMC free article] [PubMed] [Google Scholar]
- [40].Beningo KA, Dembo M, Kaverina I, Small JV, Wang YL. Nascent focal adhesions are responsible for the generation of strong propulsive forces in migrating fibroblasts. J Cell Biol 2001; 153:881-7; PMID:11352946; https://doi.org/ 10.1083/jcb.153.4.881 [DOI] [PMC free article] [PubMed] [Google Scholar]
- [41].Stricker J, Aratyn-Schaus Y, Oakes PW, Gardel ML. Spatiotemporal constraints on the force-dependent growth of focal adhesions. Biophys J 2011; 100:2883-93; PMID:21689521; https://doi.org/ 10.1016/j.bpj.2011.05.023 [DOI] [PMC free article] [PubMed] [Google Scholar]
- [42].Chancellor TJ, Lee J, Thodeti CK, Lele T. Actomyosin tension exerted on the nucleus through nesprin-1 connections influences endothelial cell adhesion, migration, and cyclic strain-induced reorientation. Biophys J 2010; 99:115-23; PMID:20655839; https://doi.org/ 10.1016/j.bpj.2010.04.011 [DOI] [PMC free article] [PubMed] [Google Scholar]
- [43].Kuo J, Lin J, Staddon JM, Hosoya H, Chen R. Uncoordinated regulation of stress fibers and focal adhesions by DAP kinase. J Cell Sci 2003; 116:4777-90; PMID:14600263; https://doi.org/ 10.1242/jcs.00794 [DOI] [PubMed] [Google Scholar]
- [44].Houle F, Poirier A, Dumaresq J, Huot J. DAP kinase mediates the phosphorylation of tropomyosin-1 downstream of the ERK pathway, which regulates the formation of stress fibers in response to oxidative stress. J Cell Sci 2007; 120:3666-77; https://doi.org/ 10.1242/jcs.003251 [DOI] [PubMed] [Google Scholar]
- [45].Pekovic V, Gibbs-Seymour I, Markiewicz E, Alzoghaibi F, Benham AM, Edwards R, Wenhert M, von Zglinicki T, Hutchison CJ. Conserved cysteine residues in the mammalian lamin A tail are essential for cellular responses to ROS generation. Aging Cell 2011; 10:1067-79; PMID:21951640; https://doi.org/ 10.1111/j.1474-9726.2011.00750.x [DOI] [PubMed] [Google Scholar]
- [46].Lee JSH, Hale CM, Panorchan P, Khatau SB, George JP, Tseng Y, Stewart CL, Hodzic D, Wirtz D. Nuclear lamin A/C deficiency induces defects in cell mechanics, polarization, and migration. Biophys J 2007; 93:2542-52; PMID:17631533; https://doi.org/ 10.1529/biophysj.106.102426 [DOI] [PMC free article] [PubMed] [Google Scholar]
- [47].Foster CR, Robson JL, Simon WJ, Twigg J, Cruikshank D, Wilson RG, Hutchison CJ. The role of Lamin A in cytoskeleton organization in colorectal cancer cells: a proteomic investigation. Nucleus 2011; 2:434-43; PMID:21983087; https://doi.org/ 10.4161/nucl.2.5.17775 [DOI] [PMC free article] [PubMed] [Google Scholar]
- [48].Schaller MD. FAK and paxillin: Regulators of N-cadherin adhesion and inhibitors of cell migration? J Cell Biol 2004; 166:157-9; PMID:15263014; https://doi.org/ 10.1083/jcb.200406151 [DOI] [PMC free article] [PubMed] [Google Scholar]
- [49].Salgia R, Li J, Ewaniuk DS, Wang Y, Sattler M, Chen W, Richards W, Pisick E, Shapiro GI, Rollins BJ, et al.. Expression of the focal adhesion protein paxillin in lung cancer and its relation to cell motility. 1999; 18(1):67-77 [DOI] [PubMed] [Google Scholar]
- [50].Mierke CT. The role of vinculin in the regulation of the mechanical properties of cells. Cell Biochem Biophys 2009; 53:115-26; PMID:19350419; https://doi.org/ 10.1007/s12013-009-9047-6 [DOI] [PubMed] [Google Scholar]
- [51].Houben F, Willems CHMP, Declercq ILJ, Hochstenbach K, Kamps MA, Snoeckx LHEH, Ramaekers FCS, Broers JLV. Disturbed nuclear orientation and cellular migration in A-type lamin deficient cells. Biochim Biophys Acta - Mol Cell Res 2009; 1793:312-24; https://doi.org/ 10.1016/j.bbamcr.2008.10.003 [DOI] [PubMed] [Google Scholar]
- [52].To C, Shilton BH, Di Guglielmo GM. Synthetic triterpenoids target the Arp2/3 complex and inhibit branched actin polymerization. J Biol Chem 2010; 285:27944-57; PMID:20566646; https://doi.org/ 10.1074/jbc.M110.103036 [DOI] [PMC free article] [PubMed] [Google Scholar]
- [53].Swift J, Ivanovska IL, Buxboim A, Harada T, Dave PC, Dingal P, Pinter J, Pajerowski JD, Spinler KR, Shin JW, et al.. Nuclear Lamin-A scales with tissue stiffness and enhances matrix-directed differentiation. 2013; 341:1240104; PMID:23990565 [DOI] [PMC free article] [PubMed] [Google Scholar]
- [54].Emerson LJ, Holt MR, Wheeler MA, Wehnert M, Parsons M, Ellis JA. Defects in cell spreading and ERK1/2 activation in fibroblasts with lamin A/C mutations. Biochim Biophys Acta - Mol Basis Dis 2009; 1792:810-21; https://doi.org/ 10.1016/j.bbadis.2009.05.007 [DOI] [PubMed] [Google Scholar]
- [55].Veith C, Marsh LM, Wygrecka M, Rutschmann K, Seeger W, Weissmann N, Kwapiszewska G. Paxillin regulates pulmonary arterial smooth muscle cell function in pulmonary hypertension. Am J Pathol 2012; 181:1621-33; PMID:22959909; https://doi.org/ 10.1016/j.ajpath.2012.07.026 [DOI] [PubMed] [Google Scholar]
- [56].Wade R, Bohl J, Vande Pol S. Paxillin null embryonic stem cells are impaired in cell spreading and tyrosine phosphorylation of focal adhesion kinase. Oncogene 2002; 21:96-107; PMID:11791180; https://doi.org/ 10.1038/sj.onc.1205013 [DOI] [PubMed] [Google Scholar]
- [57].Khatau SB, Bloom RJ, Bajpai S, Razafsky D, Zang S, Giri A, Wu P-H, Marchand J, Celedon A, Hale CM, et al.. The distinct roles of the nucleus and nucleus-cytoskeleton connections in three-dimensional cell migration. Sci Rep 2012; 2:488; PMID:22761994; https://doi.org/ 10.1038/srep00488 [DOI] [PMC free article] [PubMed] [Google Scholar]
- [58].Krause M, Wolf K. Cancer cell migration in 3d tissue: Negotiating space by proteolysis and nuclear deformability. Cell Adhes Migr 2015; 9:357-66; https://doi.org/ 10.1080/19336918.2015.1061173 [DOI] [PMC free article] [PubMed] [Google Scholar]
- [59].Cox J, Mann M. MaxQuant enables high peptide identification rates, individualized p.p.b.-range mass accuracies and proteome-wide protein quantification. Nat Biotechnol 2008; 26:1367-72; PMID:19029910; https://doi.org/ 10.1038/nbt.1511 [DOI] [PubMed] [Google Scholar]
- [60].Perkins DN, Pappin DJC, Creasy DM, Cottrell JS. Probability-based protein identification by searching sequence databases using mass spectrometry data. Electrophoresis 1999; 20:3351-567; https://doi.org/ 10.1002/(SICI)1522-2683(19991201)20:18%3c3551::AID-ELPS3551%3e3.0.CO;2-2 [DOI] [PubMed] [Google Scholar]
- [61].Mi H, Poudel S, Muruganujan A, Casagrande JT, Thomas PD. PANTHER version 10: expanded protein families and functions, and analysis tools. Nucleic Acids Res 2016; 44:D336-42; PMID:26578592; https://doi.org/ 10.1093/nar/gkv1194 [DOI] [PMC free article] [PubMed] [Google Scholar]
- [62].Eden E, Navon R, Steinfeld I, Lipson D, Yakhini Z. GOrilla: a tool for discovery and visualization of enriched GO terms in ranked gene lists. BMC Bioinformatics 2009; 10:48; PMID:19192299; https://doi.org/ 10.1186/1471-2105-10-48 [DOI] [PMC free article] [PubMed] [Google Scholar]
- [63].Livak KJ, Schmittgen TD. Analysis of relative gene expression data using real-time quantitative PCR and the 2-ddCT method. Methods 2001; 25:402-8; PMID:11846609; https://doi.org/ 10.1006/meth.2001.1262 [DOI] [PubMed] [Google Scholar]
- [64].Jonkman JEN, Cathcart JA, Xu F, Bartolini ME, Amon JE, Stevens KM, Colarusso P. An introduction to the wound healing assay using live-cell microscopy. Cell Adh Migr 2015; 8:440-51; https://doi.org/ 10.4161/cam.36224 [DOI] [PMC free article] [PubMed] [Google Scholar]
- [65].Grevesse T, Versaevel M, Circelli G, Desprez S, Gabriele S. A simple route to functionalize polyacrylamide hydrogels for the independent tuning of mechanotransduction cues. Lab Chip 2013; 13:777-80; PMID:23334710; https://doi.org/ 10.1039/c2lc41168g [DOI] [PubMed] [Google Scholar]
- [66].Versaevel M, Grevesse T, Gabriele S. Spatial coordination between cell and nuclear shape within micropatterned endothelial cells. Nat Commun 2012; 3:671; PMID:22334074; https://doi.org/ 10.1038/ncomms1668 [DOI] [PubMed] [Google Scholar]
- [67].Schindelin J, Arganda-Carreras I, Frise E, Kaynig V, Longair M, Pietzsch T, Preibisch S, Rueden C, Saalfeld S, Schmid B, et al.. Fiji: an open-source platform for biological-image analysis. Nat Methods 2012; 9:676-82; PMID:22743772; https://doi.org/ 10.1038/nmeth.2019 [DOI] [PMC free article] [PubMed] [Google Scholar]
- [68].Walle E, Van De Nieuwenhove I, Van Vanderleyden E, Declercq H, Gellynck K, Schaubroeck D, Ottevaere H, Thienpont H, Vos WH, De Cornelissen M, et al.. Polydopamine–Gelatin as universal cell-interactive coating for methacrylate-based medical device packaging materials: When surface chemistry overrules substrate bulk properties. Biomacromolecules 2016; 17:56-68; PMID:26568299; https://doi.org/ 10.1021/acs.biomac.5b01094 [DOI] [PubMed] [Google Scholar]
- [69].Robijns J, Molenberghs F, Sieprath T, Corne TDJ, Verschuuren M, De Vos WH. In silico synchronization reveals regulators of nuclear ruptures in lamin A/C deficient model cells. Sci Rep 2016; 6:30325; PMID:27461848; https://doi.org/ 10.1038/srep30325 [DOI] [PMC free article] [PubMed] [Google Scholar]
- [70].Hollander M, Wolfe DA. Nonparametric statistical methods. New York (NY): John Wiley & Sons; 1973. [Google Scholar]
- [71].Wickham H. ggplot2: Elegant Graphics for Data Analysis. New York (NY): Springer New York; 2009. [Google Scholar]
Associated Data
This section collects any data citations, data availability statements, or supplementary materials included in this article.