

ABSTRACT
The impact of prenatal smoke exposure (PSE) on DNA methylation has been demonstrated in blood samples from children of smoking mothers, but evidence for sex-dependent smoke-induced effects is limited. As the identified differentially methylated genes can be associated with developmental processes, and insulin-like growth factors (IGFs) play a critical role in prenatal tissue growth, we hypothesized that PSE induces fetal programming of Igf1r and Igf1. Using a mouse model of smoking during pregnancy, we show that PSE alters promoter methylation of Igf1r and Igf1 and deregulates their gene expression in lung and liver of fetal (E17.5) and neonatal (D3) mouse offspring. By further comparing female versus male, lung versus liver, or fetal versus neonatal time point, our results demonstrate that CpG site-specific aberrant methylation patterns sex-dependently vary per organ and time point. Moreover, PSE reduces gene expression of Igf1r and Igf1, dependent on organ, sex, and offspring's age. Our results indicate that PSE may be a source of organ-specific rather than general systemic fetal programming. This is exemplified here by gene promoter methylation and mRNA levels of Igf1r and Igf1, together with a sex- and organ-specific naturally established correlation of both parameters that is affected by prenatal smoke exposure. Moreover, the comparison of fetuses with neonates suggests a CpG site-dependent reversibility/persistence of PSE-induced differential methylation patterns.
KEYWORDS: DNA methylation, epigenetics, liver, lung, mouse, prenatal, pyrosequencing
Introduction
Smoking during pregnancy influences fetal development and may compromise the offspring's health during childhood, but also later in life. These effects were shown in epidemiology (for a review, see [1]) and in vivo experiments (see, for example, [2,3]); however, the impact of prenatal smoke exposure (PSE) on the actual developmental mechanisms and signaling pathways are not yet fully understood. Although respiratory effects are the primarily investigated consequences in literature, maternal smoking during pregnancy has also been causally associated with adverse cardiovascular and metabolic outcomes in the offspring (reviewed in [4]).
The fetal origins of disease hypothesis [5,6] links the impact of environmental factors, epigenetic regulation, and prenatal development, emphasizing the susceptibility of rapidly proliferating tissues to fetal programming. Modified DNA methylation and PSE were previously linked in infant blood samples (e.g., [7,8]); some methylation marks are persistent and can be detected later in life [9]. Smoking-associated aberrant DNA methylation patterns seem to be greater in girls than in boys [10], but the cumulative effects of smoke exposure and offspring's sex on CpG site-specific methylation was rarely investigated. Nevertheless, using a mouse model we previously showed sex-dependent and CpG site-specific loss of Igf1r promoter methylation together with reduced mRNA levels of Igf1r and Igf1 in lungs of prenatally smoke-exposed offspring at thirty days after birth [11]. Given that parenchymal degeneration of the liver after PSE has been described before [12], negatively affected hepatic methylation and gene expression appear to be likely, and a growing body of evidence suggests that cigarette smoke may impact incidence, severity, and clinical course of chronic liver diseases [13].
Insulin-like growth factors (IGFs) play an important role in pre- and post-natal development in the mouse [14]. The binding of IGF1 activates insulin-like growth factor 1 receptor (IGF1R), which is coupled to important intracellular second messenger pathways. In vivo knockout studies emphasized the function of Igf1r, as its deletion alone or in combination with Igf1 caused severe developmental restrictions with abnormalities in lung development and immediate postnatal death [15–17].
Although few studies were attained in serum samples of human neonates (e.g., [18]), the effect of prenatal smoke exposure on the IGFs and their receptors in different organs at early developmental stages is very limited.
We hypothesized that the negative effect of prenatal smoke exposure on DNA methylation and mRNA levels of Igf1r and Igf1 at 30 days of age is also detectable at earlier stages, and that these alterations are not only sex- but also organ-specific. To test these hypotheses, lung and liver of prenatally smoke-exposed fetal (E17.5) and three-day-old (D3) offspring were collected for the assessment of promoter methylation patterns as well as mRNA levels of Igf1r and Igf1. In a second step, we aimed to compare the effect of prenatal smoke exposure in female versus male offspring, followed by similar but sex-dependent comparisons in lung versus liver. We continued this study by comparing the obtained results from fetuses versus neonates to evaluate if sex- and organ-dependent smoke-induced alterations are affected during the first days after birth. These analyses were followed by nonparametric correlation analyses to identify possible links between PSE-induced differential methylation status and mRNA levels. A link between the two parameters would indicate biological relevance.
Results
PSE leads to sex-dependent hypomethylation at the Igf1r promoter in lung but hypermethylation in the liver
Lung
General hypomethylation was detected in fetal lung at eight CpG sites (CpG-255, P value = 0.03; CpG-246, P = 0.03; CpG-233, P = 0.001; CpG-223, P = 0.02; CpG-215, P = 0.04; CpG-209, P = 0.04; CpG-206, P = 0.004; CpG-201, P = 0.05; Supplementary Figure 1A). No significant changes were observed in neonatal lung when both sexes were analyzed together (Supplementary Figure 1).
Hypomethylation in fetal lung in female mice was observed at nine CpG sites [CpG-272 (P = 0.04), CpG-255 (P = 0.02), CpG-252 (P = 0.01), CpG-249 (P = 0.03), CpG-246 (P = 0.02), CpG-238 (P = 0.04), CpG-233 (P = 0.01), CpG-223 (P = 0.04), CpG-206 (P = 0.03); Supplementary Figure 2a], whereas only two CpG sites were hypomethylated in males [CpG-215 (P = 0.05), CpG-206 (P = 0.01); Supplementary Figure 2A].
In neonatal lung, CpG-246 and CpG-166 were hypomethylated in male offspring (P = 0.05 and P = 0.03, respectively; Supplementary Figure 2B), whereas no differences were found in female mice (Supplementary Figure 2b). Of note, male and female neonates showed differential baseline methylation at CpG-215 (P = 0.04), CpG-206 (P = 0.03), and CpG-166 (P = 0.03) after PSE (data not shown). Lung of fetal mice did not show distinct baseline methylation but CpG-272 (P = 0.02), CpG-252 (P = 0.01), and CpG-194 (P = 0.05) presented divergent methylation status (data not shown).
Liver
Contrasting the observations in fetal lung, Igf1r in fetal liver was hypermethylated at three CpG sites after PSE (CpG-215, P = 0.05; CpG-206, P = 0.05; CpG-166, P = 0.04; Figure S1C). In neonatal liver only CpG-17 was hypomethylated (P = 0.03; Figure S1D).
Sex-dependent analysis of Igf1r promoter methylation in fetal liver uncovered hypermethylation at CpG-194 (P = 0.05) and CpG-166 (P = 0.04) as well as hypomethylation at CpG-17 (P = 0.01) in male fetuses (Supplementary Figure 2C), but no effect in females (Supplementary Figure 2c).
While no significant effects were seen in male and female neonates (Supplementary Figure 2D, d), differential baseline methylation was found for CpG-215 (P = 0.02) in neonates and CpG-17 (P = 0.03) in fetuses. PSE caused a significant differential response in male and female fetuses at CpG-252 (P = 0.04), and CpG-230 (P = 0.03).
Organ-specific Igf1r promoter methylation signature is abolished after PSE
The differential PSE response in lung and liver of both fetuses and neonates prompted us to further compare the methylation status per organ and per time point in a sex-dependent way. Figure 1 depicts these comparisons.
Figure 1.
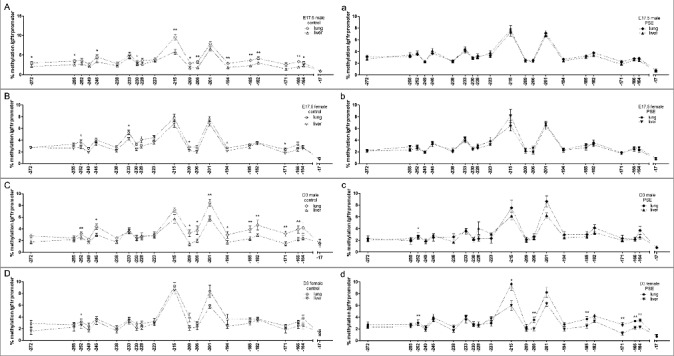
Sex-dependent organ comparison of Igf1r promoter methylation status per time point. (A-D) CpG site-specific comparison of Igfr1 promoter methylation in fetal (A, B: n = 12 fetuses for each group) and neonatal (C, D) lung and liver of male (A, C: n = 11) and female (B, D: n = 12) control offspring. (a-d) CpG site specific comparison of Igf1r promoter methylation in fetal (a, b: n = 12 fetuses for each group) and neonatal (c, d) lung and liver of male (a, c: n = 11) and female (b, d: n = 8) PSE offspring. CpG site annotations are relative to ATG start codon. Data are presented per sex, organ, and group as mean ± SEM. If not stated otherwise, the comparison of displayed groups was not significant. P values * ≤0.05, ** ≤0.01 (Mann-Whitney U-test). Open symbols: control group, closed symbols: PSE group.
E17.5 offspring
A total of 12 CpG sites was found with higher baseline methylation in lung than in liver in the group of male control offspring (CpG-272, P = 0.02; CpG-255, P = 0.05; CpG-246, P = 0.03; CpG-230, P = 0.03; CpG-215, P = 0.003; CpG-209, P = 0.04; CpG-206, P = 0.003; CpG-194, P = 0.01; CpG-185, P = 0.003; CpG-182, P = 0.007; CpG-166, P = 0.002; CpG-164, P = 0.03; Figure 1A). Similarly, five CpG sites showed different baseline methylation in lung and liver of female offspring (CpG-252, P = 0.02; CpG-233, P = 0.05; CpG-209, P = 0.03; CpG-194, P = 0.04; CpG-171, P = 0.04; Figure 1B).
These findings are contrasted by the analysis of Igf1r promoter methylation in lung and liver after prenatal smoke exposure. Here, the described differences in baseline methylation were no longer found and organ-specific methylation was not detected (Figure 1a, b).
D3 offspring
Similar to the findings in fetuses, a total of 10 CpG sites showed higher baseline methylation in lung than in liver of male control offspring (CpG-252, P = 0.01; CpG-246, P = 0.04; CpG-209, P = 0.02; CpG-206, P = 0.03; CpG-201, P = 0.005, CpG-194, P = 0.02; CpG-185, P = 0.02; CpG-182, P = 0.009; CpG-171, P = 0.005; CpG-166, P = 0.007; Figure 1C). CpG-252 was the only site with significantly higher baseline methylation in lung of female neonates when compared to their liver (P = 0.03; Figure 1D).
Diverging from these observations, PSE induced higher methylation status of seven CpG sites in lung when compared to liver of female neonates (CpG-252, P = 0.01; CpG-215, P = 0.03; CpG-206, P = 0.003; CpG-185, P = 0.02; CpG-171, P = 0.003; CpG-166, P = 0.008; CpG-164, P = 0.01; Figure 1d). Notably, in male neonates, only CpG-252 could still be seen with significantly higher methylation in lung than in liver after prenatal smoke exposure (P = 0.02; Figure 1c).
Status quo of natural Igf1r methylation pattern is sex- and organ-specifically disrupted by PSE
Following up on the described differences between lung and liver, we asked if baseline methylation in both organs of male and female offspring was constant throughout the experimental time frame. Likewise, we examined if the PSE-induced alterations at fetal age remained until postnatal day three. The results are shown in Figure 2.
Figure 2.
Sex-dependent time point comparison of Igf1r promoter methylation status in lung and liver. (A-D) CpG site-specific comparison of Igf1r promoter methylation per time point in lung (A, B) and liver (C, D) of male (A, C) and female (B, D) control offspring (n = 12 for each fetal group; neonates: n = 11 male, n = 8 female). (a-d) CpG site-specific comparison of Igf1 promoter methylation per time point in lung (a, b) and liver (c, d) of male (a, c) and female (c, d) PSE offspring (n = 12 for each group; neonates: n = 11 males, n = 12 females). CpG site annotations are relative to ATG start codon. Data are presented per sex, organ, and group as mean ± SEM. If not stated otherwise, the comparison of displayed groups was not significant. P values: * ≤0.05, ** ≤0.01 (Mann-Whitney U-test). Open symbols: control group, closed symbols: PSE group.
Lung
Higher baseline methylation was seen at CpG-233 in both male (P = 0.02; Figure 2A) and female (P = 0.01; Figure 2B) fetuses when compared to neonates. Moreover, methylation at CpG-164 was significantly increased in female neonates (P = 0.04; Figure 2B).
After PSE, higher methylation of five CpG sites was found in female neonates: CpG-215 (P = 0.04), CpG-206 (P = 0.008), CpG-171 (P = 0.04), CpG-166 (P = 0.05), and CpG-164 (P = 0.03; Figure 2b), but male offspring appeared unaffected.
Liver
While no time point differences were found in male control mice (Figure 2C), CpG-233 was found with higher baseline methylation in female fetuses when compared to three-day-old animals (P = 0.05; Figure 2D). These observations were inverted in PSE mice. Here, three CpG sites were found with higher methylation in male fetuses when compared to male neonates (CpG-255, P = 0.05; CpG-252, P = 0.05; CpG-246, P = 0.01; Figure 2c), while no significant differences were detected in female offspring (Figure 2d).
PSE leads to hypermethylation of the Igf1 promoter in liver, but not in lung, and imposes a potentially heavier burden on female offspring
Similar to the data obtained for Igf1r, we also conducted a comparative analysis of Igf1 promoter methylation in both organs of male and female offspring.
While only one CpG site was detected with hypomethylation after PSE in fetal lung (CpG-1341, P = 0.02; Supplementary Figure 3A), and Igf1 promoter methylation in neonatal lung appeared to be unaffected (Supplementary Figure 3B), PSE effect on Igf1 methylation pattern in liver was inverted. Here, hypermethylation was found at five CpG sites (CpG-1509, P = 0.006; CpG-1465, P = 0.04; CpG-1430, P = 0.008; CpG-1254, P<0.0001; CpG-1212, P = 0.04; Supplementary Figure 3C). Similarly, in neonatal liver, five CpG sites were hypermethylated after PSE (CpG-1509, P = 0.002; CpG-1430, P = 0.01; CpG-1357, P = 0.02; CpG-1254, P = 0.007; CpG-1212, P = 0.01; Figure S3D). PSE-induced hypomethylation in fetal lung was found only for female offspring at CpG-1341 (P = 0.006) and CpG-1212 (P = 0.01; Figure S3a), while fetal lung of male offspring together with neonatal lung of both sexes appeared to be unaffected by PSE (Supplementary Figure 4A, B, b).
Hypermethylation in fetal liver was mainly seen in male offspring at five CpG sites (CpG-1509, P = 0.02; CpG-1430, P = 0.02; CpG-1254, P = 0.0004; CpG-1212, P = 0.02; and CpG-1180, P = 0.02; Figure S4C); two of those sites were retrieved in female offspring (CpG-1430, P = 0.05; CpG-1254, P = 0.04; Supplementary Figure 4c). Moreover, differential baseline methylation was found for CpG-1254 (P = 0.04). Hypomethylation in neonatal liver was significant in female offspring at CpG-1509 (P = 0.02; Supplementary Figure 4d).
Specificity of Igf1 methylation pattern per sex, organ, and time point is modified after PSE
When comparing the baseline methylation levels of lung and liver in male and female offspring, organ-specific promoter methylation patterns were found. Within these, sex-specific variations were seen.
At fetal stage, methylation status at CpG-1465 (P = 0.03) was significantly different in female but not in male offspring (Figure 3A, B). The remaining significant organ-specific differential methylation at CpG-1509, CpG-1357, CpG-1254, CpG-1212, and CpG-1180 was detectable in both male and female offspring (all P<0.0001, except CpG-1180, female: P = 0.001, male: P = 0.05).
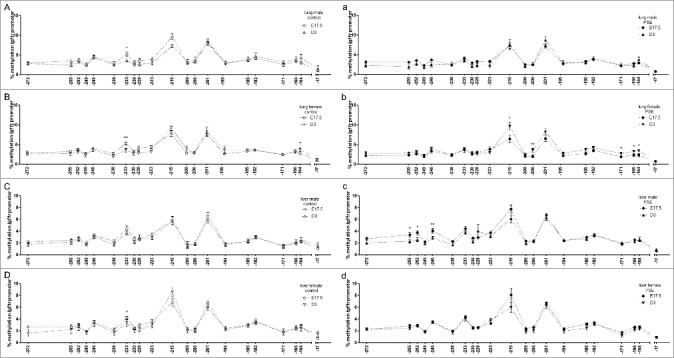
Figure 3.
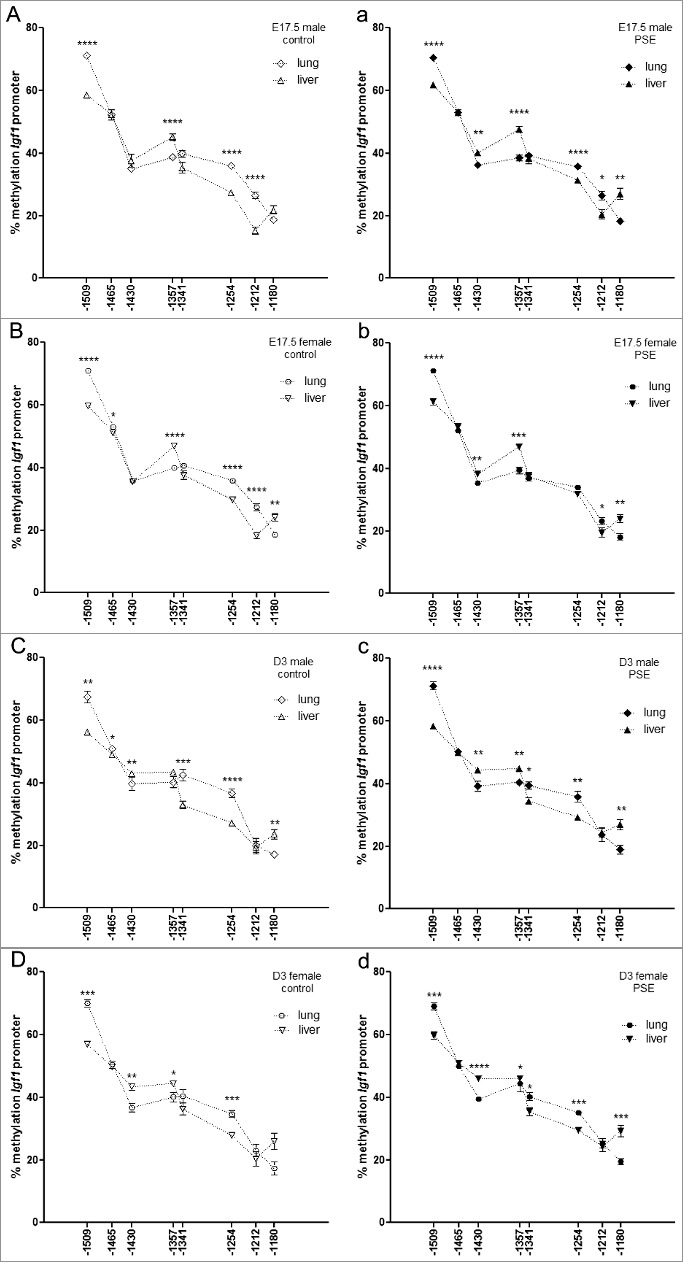
Sex-dependent organ comparison of Igf1 promoter methylation status per time point. (A-D) CpG site-specific comparison of Igf1 promoter methylation in fetal (A, B; n = 12 fetuses for each group) and neonatal (C, D) lung and liver of male (A, C: n = 11) and female (B, D: n = 12) control offspring. (a-d) CpG site-specific comparison of Igf1 promoter methylation in fetal (a, b: n = 12 fetuses for each group) and neonatal (c, d) lungs and liver of male (a, c: n = 11) and female (b, d: n = 8) PSE offspring. CpG site annotations are relative to ATG start codon. Data are presented per sex, organ, and group as mean ± SEM. If not stated otherwise, the comparison of displayed groups was not significant. P values: * ≤0.05, ** ≤0.01, *** ≤0.001, **** ≤0.0001 (Mann-Whitney U-test). Open symbols: control group, closed symbols: PSE group.
At neonatal stage, sex differences were found for CpG-1456 (P = 0.01), CpG-1341 (P = 0.008), and CpG-1180 (P = 0.003) in male (Figure 3C) and CpG-1357 (P = 0.03) in female offspring (Figure 3D). The remaining significant organ-specific differential methylation at CpG-1509 (male/female: P = 0.001/0.0009), CpG-1430 (male/female: P = 0.01/0.003) and CpG-1254 (male/female: P≤0.0001/0.0006) was detectable for both male and female offspring.
In light of these observations, it is extremely interesting that PSE disrupts the described sex-specific differences at both time points. Differential methylation in fetal female offspring at CpG-1465 and CpG-1254 was lost after PSE. This caused loss of sex-differences at CpG-1465 and induction at CpG-1254, as in male fetuses differential methylation status, remained after PSE (Figure 3a, b). Notably, methylation status of CpG-1430 in organ comparison of males and females is now significantly different (male/female, P = 0.002/0.006) and at CpG-1180 more pronounced (P = 0.002) in male fetuses.
Differential baseline methylation status at CpG-1465 in male neonates was lost after PSE but induced at CpG-1357 (P = 0.002), which, in both cases, caused loss of sex-differences in organ comparison. Similarly, also in female neonates, sex-differences were lost after PSE-induced differential organ-specific methylation at CpG-1341 (P = 0.02) and CpG-1180 (P = 0.0007; Figure 3c,d). The significant organ differences found at other CpG sites remained unaffected by PSE (CpG-1509, male/female: P≤0.0001/0.0005; CpG-1430, male/female: P = 0.004/<0.0001; CpG-1357, female: P = 0.02; CpG-1341, male: P = 0.01; CpG-1254, male/female: P = 0.007/0.0002; CpG-1180, male: P = 0.003).
Similar to the findings from the organ comparison experiment, the time point comparison also revealed a naturally established but sex-dependent change in methylation at the Igf1 promoter. These patterns are disrupted after PSE and Figure 4 presents an overview.
Figure 4.
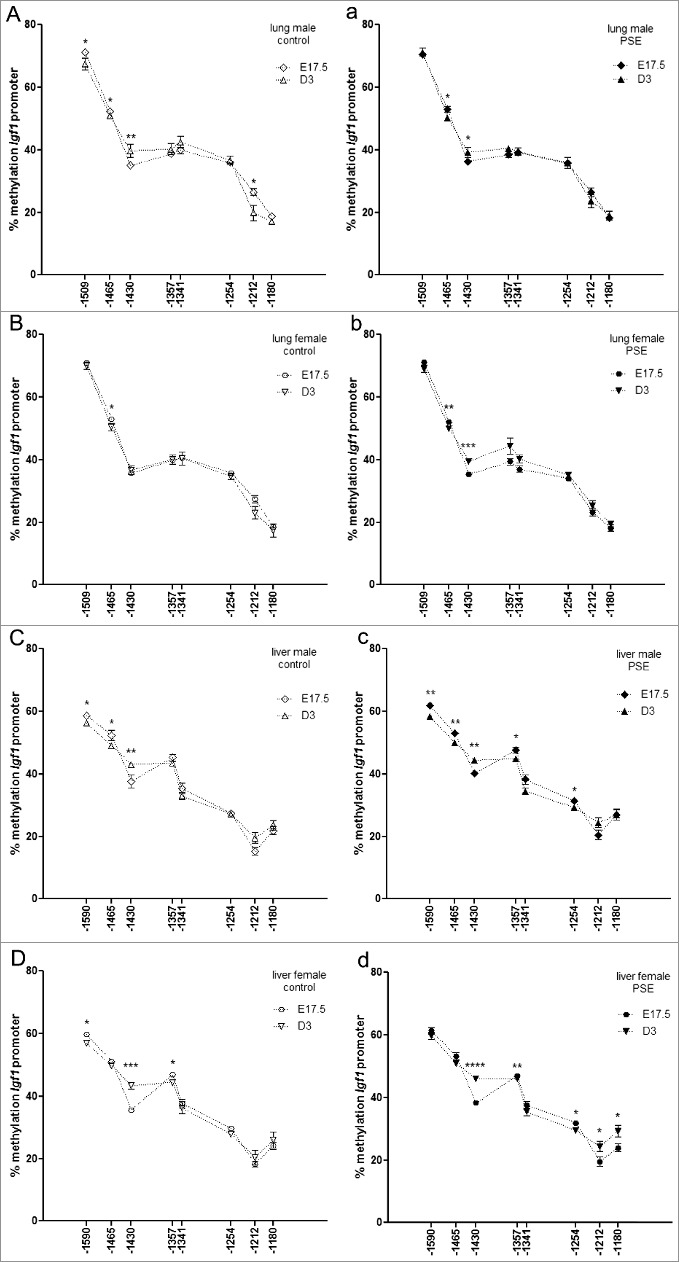
Sex-dependent time point comparison of Igf1 promoter methylation status per time point. (A-D) CpG site-specific comparison of Igf1 promoter methylation per time point in lung (A, B) and liver (C, D) of male (A, C) and female (B, D) control groups (n = 12 for each fetal group; neonates: n = 11 male, n = 8 female). (a-d) CpG site-specific comparison of Igf1 promoter methylation per time point in lung (a, b) and liver (c, d) of male (a, c) and female (c, d) PSE groups (n = 12 for each group; neonates: n = 11 males, n = 12 females). CpG site annotations are relative to ATG start codon. Data are presented per sex, organ, and group as mean ± SEM. If not stated otherwise, the comparison of displayed groups was not significant. P values: * ≤0.05, ** ≤0.01, *** ≤0.001, **** ≤0.0001 (Mann-Whitney U-test). Open symbols: control group, closed symbols: PSE group.
Baseline methylation in lung of male offspring shows time point differences at four CpG sites (CpG-1509, P = 0.05; CpG-1465, P = 0.03; CpG-1430, P = 0.01; CpG-1212, P = 0.05; Figure 4A), of which only one could be retrieved in female mice (CpG-1465, P = 0.02; Figure 4B). PSE caused loss of time point differences in male mice at CpG-1509 and CpG-1212, but the remaining two sites were unaffected (CpG-1465, P = 0.05; CpG-1430, P = 0.03; Figure 4a). This is contrasted by the induction of time point differences in female offspring at CpG-1430 (P = 0.0008) and enhanced differential methylation at CpG-1465 (P = 0.01; Figure 4b).
Differential baseline methylation at CpG-1509 (P = 0.05), CpG-1465 (P = 0.04), and CpG-1430 (P = 0.004) was observed when comparing fetal and neonatal liver from male offspring (Figure 4C). While CpG-1509 (P = 0.03) and CpG-1430 (P = 0.0002) were also found in females, CpG-1465 was not, and CpG-1357 (P = 0.04; Figure 4D) was observed instead. In contrast to the observations in male lung, PSE induced differential methylation at CpG-1357 (P = 0.05) and CpG-1254 (P = 0.03; Figure 4c) in male liver, whereas time point differences in female was lost at CpG-1509 but induced at CpG-1254 (P = 0.02), CpG-1212 (P = 0.05), and CpG-1180 (P = 0.04; Figure 4d).
What is the (biological) relevance of the PSE-induced change of Igf1r and Igf1 promoter methylation?
In addition to the observed drift in promoter methylation patterns of Igf1r and Igf1, we sought to determine the biological relevance of the described changes. DNA methylation is one of several epigenetic modifications that may influence/affect the complex process of gene transcription, which involves several regulatory steps. We therefore considered the presence (or absence) of correlation between promoter methylation and mRNA levels of our target genes as a surrogate of a possible link.
Igf1r
Within all analyzed offspring, we found a negative correlation between Igf1r CpG-215 methylation status and Igf1r mRNA levels in fetal lung after PSE (r = 0.46, P<0.05; Table 1). Moreover, PSE induced correlations at CpG-272 (r = −0.88, P<0.001), CpG-252 (r = −0.66, P<0.05), CpG-246 (r = −0.65, P<0.05), and CpG-223 (r = 0.62, P<0.05; Table 1) in the lung of male, but not of female, fetuses.
Table 1.
Correlation between Igf1r mRNA concentration and Igf1r promoter methylation in fetal and neonatal lung
| E17.5 lung | |||||||||||
|---|---|---|---|---|---|---|---|---|---|---|---|
| Correlation of / with | Igf1r (2−ΔCT) | All | All male | All female | All control | All PSE | Male control | Male PSE | Female control | Female PSE | |
| Igf1r promoter methylation [%] | CG-272 | r | -0.07 | -0.53 | -0.02 | -0.02 | -0.08 | -0.11 | -0.88 | -0.01 | 0.29 |
| P value | ns | <0.05 | ns | ns | ns | ns | <0.001 | ns | ns | ||
| CG-255 | r | -0.20 | -0.30 | -0.23 | -0.15 | -0.08 | -0.23 | -0.45 | -0.11 | 0.02 | |
| P value | ns | ns | ns | ns | ns | ns | ns | ns | ns | ||
| CG-252 | r | -0.21 | -0.45 | -0.15 | -0.20 | -0.07 | -0.36 | -0.66 | -0.07 | 0.17 | |
| P value | ns | <0.05 | ns | ns | ns | ns | <0.05 | ns | ns | ||
| CG-249 | r | -0.09 | -0.10 | -0.11 | -0.04 | 0.07 | 0.16 | -0.46 | -0.10 | 0.32 | |
| P value | ns | ns | ns | ns | ns | ns | ns | ns | ns | ||
| CG-246 | r | -0.13 | -0.28 | -0.07 | -0.10 | 0.00 | -0.08 | -0.65 | -0.21 | 0.20 | |
| P value | ns | ns | ns | ns | ns | ns | <0.05 | ns | ns | ||
| CG-238 | r | -0.18 | -0.11 | -0.23 | -0.09 | -0.20 | 0.15 | -0.38 | -0.21 | 0.03 | |
| P value | ns | ns | ns | ns | ns | ns | ns | ns | ns | ||
| CG-233 | r | -0.18 | -0.16 | -0.19 | -0.17 | 0.09 | 0.02 | -0.23 | -0.29 | 0.38 | |
| P value | ns | ns | ns | ns | ns | ns | ns | ns | ns | ||
| CG-230 | r | -0.11 | -0.06 | -0.14 | -0.11 | 0.04 | 0.21 | -0.44 | -0.21 | 0.30 | |
| P value | ns | ns | ns | ns | ns | ns | ns | ns | ns | ||
| CG-228 | r | -0.09 | -0.01 | -0.11 | -0.12 | 0.12 | 0.21 | -0.19 | -0.20 | 0.41 | |
| P value | ns | ns | ns | ns | ns | ns | ns | ns | ns | ||
| CG-223 | r | -0.05 | -0.45 | 0.19 | -0.18 | 0.12 | -0.19 | -0.62 | -0.03 | 0.52 | |
| P value | ns | <0.05 | ns | ns | ns | ns | <0.05 | ns | ns | ||
| CG-215 | r | -0.20 | -0.32 | -0.10 | 0.29 | -0.46 | 0.06 | -0.48 | 0.58 | -0.37 | |
| P value | ns | ns | ns | ns | <0.05 | ns | ns | ns | ns | ||
| CG-209 | r | -0.09 | -0.25 | -0.05 | -0.09 | 0.09 | -0.33 | -0.02 | 0.03 | 0.11 | |
| P value | ns | ns | ns | ns | ns | ns | ns | ns | ns | ||
| CG-206 | r | -0.12 | -0.26 | -0.12 | -0.10 | 0.09 | -0.14 | -0.31 | -0.24 | 0.21 | |
| P value | ns | ns | ns | ns | ns | ns | ns | ns | ns | ||
| CG-201 | r | -0.05 | -0.18 | -0.02 | -0.07 | 0.10 | -0.14 | -0.12 | -0.10 | 0.21 | |
| P value | ns | ns | ns | ns | ns | ns | ns | ns | ns | ||
| CG-194 | r | -0.02 | -0.29 | 0.08 | -0.07 | 0.11 | -0.32 | -0.21 | -0.03 | 0.25 | |
| P value | ns | ns | ns | ns | ns | ns | ns | ns | ns | ||
| CG-185 | r | -0.01 | -0.12 | -0.05 | 0.06 | 0.10 | -0.19 | 0.17 | 0.09 | 0.04 | |
| P value | ns | ns | ns | ns | ns | ns | ns | ns | ns | ||
| CG-182 | r | -0.09 | -0.09 | 0.15 | -0.06 | 0.25 | -0.07 | -0.04 | -0.33 | 0.41 | |
| P value | ns | ns | ns | ns | ns | ns | ns | ns | ns | ||
| CG-171 | r | -0.16 | -0.24 | -0.18 | -0.24 | 0.10 | -0.23 | -0.29 | -0.45 | 0.31 | |
| P value | ns | ns | ns | ns | ns | ns | ns | ns | ns | ||
| CG-166 | r | -0.21 | -0.32 | -0.21 | -0.19 | -0.03 | -0.26 | -0.23 | -0.22 | 0.01 | |
| P value | ns | ns | ns | ns | ns | ns | ns | ns | ns | ||
| CG-164 | r | -0.05 | -0.23 | 0.01 | -0.11 | 0.07 | -0.45 | -0.07 | 0.09 | 0.10 | |
| P value | ns | ns | ns | ns | ns | ns | ns | ns | ns | ||
| CG-17 | r | -0.19 | -0.24 | -0.20 | -0.08 | -0.27 | -0.04 | -036 | -0.15 | -0.24 | |
| P value | ns | ns | ns | ns | ns | ns | ns | ns | ns | ||
| Correlation of / with | Igf1r (2−ΔCT) | D3 lung | |||||||||
| |
All |
All male |
All female |
All control |
All PSE |
Male control |
Male PSE |
Female control |
Female PSE |
||
| Igf1r promoter methylation [%] | CG-272 | r | 0.08 | 0.28 | -0.13 | -0.23 | 0.27 | -0.05 | 0.69 | -0.51 | 0.03 |
| P value | ns | ns | ns | ns | ns | ns | <0.05 | ns | ns | ||
| CG-255 | r | 0.08 | 0.22 | -0.22 | -0.24 | 0.28 | -0.02 | 0.41 | -0.65 | 0.20 | |
| P value | ns | ns | ns | ns | ns | ns | ns | ns | ns | ||
| CG-252 | r | 0.12 | 0.30 | -0.10 | -0.35 | 0.40 | -0.11 | 0.80 | -0.76 | 0.17 | |
| P value | ns | ns | ns | ns | ns | ns | <0.01 | ns | ns | ||
| CG-249 | r | 0.02 | 0.32 | -0.30 | -0.40 | 0.32 | -0.08 | 0.64 | -0.81 | 0.02 | |
| P value | ns | ns | ns | ns | ns | ns | <0.05 | ns | ns | ||
| CG-246 | r | 0.23 | 0.62 | -0.15 | 0.37 | 0.20 | 0.70 | 0.64 | -0.37 | -0.07 | |
| P value | ns | <0.001 | ns | ns | ns | <0.05 | <0.05 | ns | ns | ||
| CG-238 | r | -0.08 | 0.09 | -0.23 | -0.42 | 0.17 | -0.01 | 0.25 | -0.89 | 0.13 | |
| P value | ns | ns | ns | ns | ns | ns | ns | <0.01 | ns | ||
| CG-233 | r | 0.00 | 0.03 | -0.02 | -0.35 | 0.25 | -0.27 | 0.46 | -0.50 | 0.17 | |
| P value | ns | ns | ns | ns | ns | ns | ns | ns | ns | ||
| CG-230 | r | 0.03 | 0.17 | -0.19 | -0.31 | 0.31 | -0.11 | 0.56 | -0.80 | 0.13 | |
| P value | ns | ns | ns | ns | ns | ns | ns | ns | ns | ||
| CG-228 | r | 0.17 | 0.26 | 0.04 | -0.19 | 0.47 | 0.07 | 0.56 | -0.88 | 0.40 | |
| P value | ns | ns | ns | ns | <0.05 | ns | ns | <0.01 | ns | ||
| CG-223 | r | 0.17 | 0.31 | -0.06 | -0.23 | 0.47 | 0.04 | 0.63 | -0.86 | 0.34 | |
| P value | ns | ns | ns | ns | <0.05 | ns | <0.05 | <0.05 | ns | ||
| CG-215 | r | -0.12 | 0.05 | -0.30 | 0.01 | -0.22 | -0.06 | 0.02 | 0.02 | -0.41 | |
| P value | ns | ns | ns | ns | ns | ns | ns | ns | ns | ||
| CG-209 | r | 0.08 | 0.12 | 0.05 | -0.24 | 0.24 | -0.02 | 0.12 | -0.67 | 0.31 | |
| P value | ns | ns | ns | ns | ns | ns | ns | ns | ns | ||
| CG-206 | r | -0.20 | -0.09 | -0.39 | -0.23 | -0.25 | -0.15 | -0.27 | -0.72 | -0.28 | |
| P value | ns | ns | 0.08 | ns | ns | ns | ns | ns | ns | ||
| CG-201 | r | -0.15 | -0.22 | -0.06 | 0.17 | -0.44 | 0.25 | -0.72 | 0.05 | -0.20 | |
| P value | ns | ns | ns | ns | <0.05 | ns | <0.05 | ns | ns | ||
| CG-194 | r | -0.21 | -0.23 | -0.19 | -0.22 | -0.32 | -0.07 | -0.54 | -0.49 | -0.11 | |
| P value | ns | ns | ns | ns | ns | ns | ns | ns | ns | ||
| CG-185 | r | -0.04 | -0.07 | -0.01 | -0.18 | 0.00 | -0.13 | -0.20 | -0.34 | 0.14 | |
| P value | ns | ns | ns | ns | ns | ns | ns | ns | ns | ||
| CG-182 | r | -0.21 | -0.17 | -0.35 | -0.13 | -0.36 | -0.06 | -0.55 | -0.57 | -0.23 | |
| P value | ns | ns | ns | ns | ns | ns | ns | ns | ns | ||
| CG-171 | r | -0.02 | -0.01 | -0.09 | -0.06 | -0.07 | 0.10 | -0.26 | -0.60 | 0.11 | |
| P value | ns | ns | ns | ns | ns | ns | ns | ns | ns | ||
| CG-166 | r | 0.07 | 0.11 | -0.06 | -0.13 | 0.13 | -0.05 | 0.04 | -0.53 | 0.27 | |
| P value | ns | ns | ns | ns | ns | ns | ns | ns | ns | ||
| CG-164 | r | -0.21 | -0.20 | -0.27 | -0.24 | -0.27 | -0.09 | -0.54 | -0.78 | 0.07 | |
| P value | ns | ns | ns | ns | ns | ns | ns | ns | ns | ||
| CG-17 | r | -0.01 | -0.12 | 0.34 | -0.08 | -0.20 | -0.23 | -0.01 | 0.54 | -0.33 | |
| P value | ns | ns | ns | ns | ns | ns | ns | ns | ns | ||
ns: non significant
A sex-independent correlation was found for CpG-228 (r = 0.47, P<0.05), CpG-223 (r = 0.47, P<0.05), and CpG-201 (r = −0.44, P<0.05; Table 1) after PSE in neonatal lung, whereas a sex-dependent discrimination of subgroups revealed associations at CpG-246 (r = 0.74, P<0.01) in male control mice and at CpG-272 (r = 0.69, P<0.05), CpG-252 (r = 0.80, P<0.01), CpG-249 (r = 0.64, P<0.05), CpG-246 (r = 0.64, P<0.05), CpG-223 (r = 0.63, P<0.05), and CpG-201 (r = −0.72, P<0.05; Table 1) in male PSE offspring. Taking both male subgroups together, methylation at CpG-246 and Igf1r mRNA levels in neonatal lung correlated strongly (r = 0.62, P<0.001; Table 1).
These observations are contrasted by the findings in lung of female neonates. Here, inverse correlations were seen exclusively in control mice for CpG-238 (r = −0.89, P<0.01), CpG-228 (r = −0.88, P<0.01), and CpG-223 (r = −0.86, P<0.05; Table 1), which were disrupted after PSE. The described opposite correlations (positive vs. inverse) in male and female may offset each other and hence may result in a lack of general correlations.
In fetal liver, correlation was seen for CpG-17 in female offspring (r = 0.52, P<0.05; Table 2). Moreover, a sex-independent correlation was found after PSE at CpG-17 (r = 0.48, P<0.05; Table 2). The PSE-induced effect was only seen in male offspring, as four CpG sites were found with correlations after PSE CpG-233 (r = 0.64, P<0.05), CpG-215 (r = 0.74, P<0.01), CpG-209 (r = 0.82, P≤0.01), and CpG-185 (r = 0.62, P≤0.05; Table 2).
Table 2.
Correlation between Igf1r mRNA concentration and Igf1r promoter methylation in fetal and neonatal liver
| Correlation of / with | Igf1r (2−ΔCT) | E17.5 liver | |||||||||
|---|---|---|---|---|---|---|---|---|---|---|---|
| All | All male | All female | All control | All PSE | Male control | Male PSE | Female control | Female PSE | |||
| Igf1r promoter methylation [%] | CG-272 | r | -0.10 | -0.05 | 0.05 | -0.12 | 0.17 | 0.03 | 0.59 | 0.24 | 0.07 |
| P value | ns | ns | ns | ns | ns | ns | ns | ns | ns | ||
| CG-255 | r | 0.25 | 0.11 | 0.17 | 0.23 | 0.22 | 0.46 | 0.57 | 0.16 | 0.14 | |
| P value | ns | ns | ns | ns | ns | ns | ns | ns | ns | ||
| CG-252 | r | 0.26 | 0.01 | 0.25 | 0.27 | 0.10 | 0.35 | 0.49 | 0.27 | 0.16 | |
| P value | ns | ns | ns | ns | ns | ns | ns | ns | ns | ||
| CG-249 | r | 0.04 | 0.07 | -0.03 | 0.06 | 0.11 | 0.11 | 0.41 | -0.06 | 0.02 | |
| P value | ns | ns | ns | ns | ns | ns | ns | ns | ns | ||
| CG-246 | r | 0.08 | 0.04 | 0.12 | 0.11 | 0.22 | 0.18 | 0.54 | 0.10 | 0.08 | |
| P value | ns | ns | ns | ns | ns | ns | ns | ns | ns | ||
| CG-238 | r | 0.10 | 0.05 | 0.15 | 0.03 | 0.27 | -0.10 | 0.43 | 0.12 | 0.33 | |
| P value | ns | ns | ns | ns | ns | ns | ns | ns | ns | ||
| CG-233 | r | 0.29 | 0.32 | 0.24 | 0.28 | 0.36 | 0.27 | 0.64 | 0.32 | 0.09 | |
| P value | ns | ns | ns | ns | ns | ns | <0.05 | ns | ns | ||
| CG-230 | r | 0.02 | 0.05 | -0.07 | 0.02 | 0.08 | 0.03 | 0.48 | -0.09 | -0.09 | |
| P value | ns | ns | ns | ns | ns | ns | ns | ns | ns | ||
| CG-228 | r | -0.16 | -0.17 | -0.14 | -0.20 | -0.06 | -0.16 | 0.09 | -0.13 | -0.05 | |
| P value | ns | ns | ns | ns | ns | ns | ns | ns | ns | ||
| CG-223 | r | 0.12 | 0.08 | 0.18 | 0.14 | 0.13 | 0.25 | 0.16 | 0.12 | 0.54 | |
| P value | ns | ns | ns | ns | ns | ns | ns | ns | ns | ||
| CG-215 | r | 0.03 | -0.11 | 0.17 | -0.03 | 0.28 | -0.18 | 0.74 | 0.26 | 0.08 | |
| P value | ns | ns | ns | ns | ns | ns | <0.01 | ns | ns | ||
| CG-209 | r | -0.09 | -0.32 | 0.27 | -0.21 | 0.35 | -0.42 | 0.82 | 0.29 | 0.26 | |
| P value | ns | ns | ns | ns | ns | ns | <0.01 | ns | ns | ||
| CG-206 | r | -0.06 | -0.08 | -0.03 | -0.18 | 0.25 | -0.13 | 0.38 | -0.10 | -0.04 | |
| P value | ns | ns | ns | ns | ns | ns | ns | ns | ns | ||
| CG-201 | r | 0.27 | 0.32 | 0.14 | 0.20 | 0.22 | 0.41 | 0.47 | 0.08 | 0.40 | |
| P value | ns | ns | ns | ns | ns | ns | ns | ns | ns | ||
| CG-194 | r | -0.04 | -0.20 | 0.18 | -0.12 | 0.28 | -0.10 | 0.41 | 0.06 | 0.40 | |
| P value | ns | ns | ns | ns | ns | ns | ns | ns | ns | ||
| CG-185 | r | -0.06 | -0.08 | 0.00 | -0.08 | 0.15 | -0.06 | 0.62 | 0.11 | -0.41 | |
| P value | ns | ns | ns | ns | ns | ns | <0.05 | ns | ns | ||
| CG-182 | r | 0.01 | 0.06 | -0.01 | -0.12 | 0.26 | 0.04 | 0.40 | -0.05 | 0.16 | |
| P value | ns | ns | ns | ns | ns | ns | ns | ns | ns | ||
| CG-171 | r | -0.04 | -0.08 | 0.02 | -0.20 | 0.37 | -0.09 | 0.38 | -0.19 | 0.47 | |
| P value | ns | ns | ns | ns | ns | ns | ns | ns | ns | ||
| CG-166 | r | -0.01 | -0.17 | 0.20 | -0.12 | 0.38 | -0.14 | 0.50 | 0.07 | 0.46 | |
| P value | ns | ns | ns | ns | ns | ns | ns | ns | ns | ||
| CG-164 | r | -0.06 | 0.14 | -0.17 | -0.15 | 0.19 | 0.11 | 0.45 | -0.17 | -0.14 | |
| P value | ns | ns | ns | ns | ns | ns | ns | ns | ns | ||
| CG-17 | r | 0.33 | 0.17 | 0.52 | 0.24 | 0.48 | -0.26 | 0.20 | 0.50 | 0.43 | |
| P value | ns | ns | <0.05 | ns | <0.05 | ns | ns | ns | ns | ||
| Correlation of / with | Igf1r (2−ΔCT) | D3 liver | |||||||||
| |
all |
all male |
all female |
all control |
all PSE |
male control |
male PSE |
female control |
female PSE |
||
| Igf1r promoter methylation [%] | CG-272 | r | 0.05 | 0.01 | 0.12 | 0.18 | 0.42 | -0.20 | 0.32 | 0.51 | 0.36 |
| P value | ns | ns | ns | ns | ns | ns | ns | ns | ns | ||
| CG-255 | r | 0.08 | 0.01 | 0.30 | 0.25 | 0.18 | -0.13 | 0.08 | 0.61 | 0.40 | |
| P value | ns | ns | ns | ns | ns | ns | ns | ns | ns | ||
| CG-252 | r | 0.07 | -0.02 | 0.20 | 0.00 | 0.28 | -0.34 | 0.20 | 0.39 | 0.44 | |
| P value | ns | ns | ns | ns | ns | ns | ns | ns | ns | ||
| CG-249 | r | -0.01 | -0.01 | -0.02 | 0.02 | 0.24 | -0.19 | 0.23 | 0.26 | 0.23 | |
| P value | ns | ns | ns | ns | ns | ns | ns | ns | ns | ||
| CG-246 | r | 0.17 | 0.10 | 0.26 | 0.11 | 0.36 | -0.28 | 0.37 | 0.50 | 0.29 | |
| P value | ns | ns | ns | ns | ns | ns | ns | ns | ns | ||
| CG-238 | r | 0.08 | 0.09 | 0.08 | 0.25 | 0.12 | -0.13 | 0.28 | 0.63 | -0.10 | |
| P value | ns | ns | ns | ns | ns | ns | ns | ns | ns | ||
| CG-233 | r | -0.13 | -0.32 | 0.12 | -0.12 | 0.02 | -0.68 | -0.33 | 0.52 | 0.22 | |
| P value | ns | ns | ns | ns | ns | <0.05 | ns | ns | ns | ||
| CG-230 | r | -0.08 | -0.07 | -0.10 | -0.14 | 0.23 | -0.45 | 0.32 | 0.35 | 0.03 | |
| P value | ns | ns | ns | ns | ns | ns | ns | ns | ns | ||
| CG-228 | r | -0.21 | -0.31 | -0.03 | -0.23 | 0.09 | -0.59 | 0.12 | 0.32 | 0.14 | |
| P value | ns | ns | ns | ns | ns | ns | ns | ns | ns | ||
| CG-223 | r | -0.17 | -0.26 | -0.13 | -0.10 | 0.10 | -0.25 | 0.02 | 0.12 | 0.10 | |
| P value | ns | ns | ns | ns | ns | ns | ns | ns | ns | ||
| CG-215 | r | 0.08 | -0.23 | 0.49 | -0.07 | 0.08 | -0.37 | -0.06 | 0.46 | 0.21 | |
| P value | ns | ns | <0.05 | ns | ns | ns | ns | ns | ns | ||
| CG-209 | r | -0.16 | -0.32 | -0.15 | 0.05 | -0.12 | -0.38 | -0.05 | 0.61 | -0.25 | |
| P value | ns | ns | ns | ns | ns | ns | ns | ns | ns | ||
| CG-206 | r | -0.09 | -0.15 | -0.01 | -0.13 | -0.06 | -0.14 | 0.19 | 0.48 | -0.30 | |
| P value | ns | ns | ns | ns | ns | ns | ns | ns | ns | ||
| CG-201 | r | -0.07 | -0.11 | -0.01 | -0.27 | 0.21 | -0.55 | 0.40 | 0.18 | 0.00 | |
| P value | ns | ns | ns | ns | ns | ns | ns | ns | ns | ||
| CG-194 | r | -0.21 | -0.38 | 0.08 | 0.09 | -0.20 | -0.05 | -0.22 | 0.42 | -0.13 | |
| P value | ns | ns | ns | ns | ns | ns | ns | ns | ns | ||
| CG-185 | r | 0.11 | -0.10 | 0.41 | 0.08 | 0.20 | -0.26 | 0.20 | 0.74 | 0.23 | |
| P value | ns | ns | ns | ns | ns | ns | ns | ns | ns | ||
| CG-182 | r | 0.13 | -0.05 | 0.36 | 0.28 | 0.32 | 0.05 | 0.20 | 0.66 | 0.52 | |
| P value | ns | ns | ns | ns | ns | ns | ns | ns | ns | ||
| CG-171 | r | -0.14 | -0.28 | -0.08 | 0.12 | -0.17 | -0.12 | -0.04 | 0.50 | -0.26 | |
| P value | ns | ns | ns | ns | ns | ns | ns | ns | ns | ||
| CG-166 | r | -0.01 | -0.07 | 0.09 | 0.12 | 0.02 | -0.10 | 0.11 | 0.50 | -0.12 | |
| P value | ns | ns | ns | ns | ns | ns | ns | ns | ns | ||
| CG-164 | r | 0.11 | 0.11 | 0.12 | 0.21 | 0.19 | -0.02 | 0.30 | 0.60 | -0.05 | |
| P value | ns | ns | ns | ns | ns | ns | ns | ns | ns | ||
| CG-17 | r | 0.14 | 0.17 | 0.11 | -0.14 | -0.05 | 0.07 | -0.21 | -0.30 | 0.17 | |
| P value | ns | ns | ns | ns | ns | ns | ns | ns | ns | ||
Igf1
In fetal lung, PSE-induced correlation was found only at CpG-1180 (r = 0.51, P<0.05; Table 3) in male and female neonates. Instead, in neonatal lung, PSE induced correlation at CpG-1254 (r = 0.68, P<0.05; Table 3) in males only, whereas an inverse correlation after PSE was found in females at CpG-1212 (r = 0.68, P<0.05; Table 3). The correlation between methylation at CpG-1341 and Igf1 mRNA levels appeared to be sex-dependent: male control offspring showed positive correlation (r = 0.67, P<0.05) but female controls showed inverse correlation (r = −0.73, P<0.05; Table 3).
Table 3.
Correlation between Igf1 mRNA concentration and Igf1 promoter methylation in fetal and neonatal lung and liver
| Correlation of / with | Igf1 (2−ΔCT) | E17.5 lung | |||||||||
|---|---|---|---|---|---|---|---|---|---|---|---|
| All | All male | All female | All control | All PSE | Male control | Male PSE | Female control | Female PSE | |||
| Igf1 promoter methylation [%] | CG-1509 | r | 0.03 | -0.04 | 0.07 | 0.07 | -0.03 | 0.04 | -0.09 | 0.07 | 0.03 |
| P value | ns | ns | ns | ns | ns | ns | ns | ns | ns | ||
| CG-1465 | r | -0.06 | 0.17 | -0.33 | -0.24 | 0.10 | 0.05 | 0.20 | -0.25 | -0.33 | |
| P value | ns | ns | ns | ns | ns | ns | ns | ns | ns | ||
| CG-1430 | r | 0.07 | 0.01 | 0.13 | 0.06 | 0.06 | 0.30 | -0.13 | 0.13 | 0.22 | |
| P value | ns | ns | ns | ns | ns | ns | ns | ns | ns | ||
| CG-1357 | r | -0.03 | 0.17 | -0.08 | -0.27 | 0.19 | -0.19 | 0.31 | -0.18 | 0.12 | |
| P value | ns | ns | ns | ns | ns | ns | ns | ns | ns | ||
| CG-1341 | r | -0.04 | 0.05 | -0.13 | -0.06 | -0.01 | 0.00 | 0.03 | 0.04 | -0.14 | |
| P value | ns | ns | ns | ns | ns | ns | ns | ns | ns | ||
| CG-1254 | r | 0.03 | 0.25 | -0.30 | -0.25 | 0.16 | 0.20 | 0.28 | -0.40 | 0.02 | |
| P value | ns | ns | ns | ns | ns | ns | ns | ns | ns | ||
| CG-1212 | r | 0.01 | 0.38 | -0.34 | -0.32 | 0.32 | 0.30 | 0.44 | -0.23 | 0.07 | |
| P value | ns | ns | ns | ns | ns | ns | ns | ns | ns | ||
| CG-1180 | r | -0.03 | 0.21 | -0.19 | -0.41 | 0.51 | -0.25 | 0.52 | -0.51 | 0.31 | |
| P value | ns | ns | ns | ns | <0.05 | ns | ns | ns | ns | ||
| Correlation of / with | Igf1 (2−ΔCT) | D3 lung | |||||||||
| |
All |
All male |
All female |
All control |
All PSE |
Male control |
Male PSE |
Female control |
Female PSE |
||
| Igf1 promoter methylation [%] | CG-1509 | r | 0.09 | 0.01 | 0.19 | 0.14 | 0.21 | 0.21 | 0.05 | -0.30 | 0.40 |
| P value | ns | ns | ns | ns | ns | ns | ns | ns | ns | ||
| CG-1465 | r | -0.10 | 0.21 | -0.34 | -0.23 | -0.07 | 0.10 | 0.31 | -0.52 | -0.31 | |
| P value | ns | ns | ns | ns | ns | ns | ns | ns | ns | ||
| CG-1430 | r | 0.14 | 0.35 | -0.09 | 0.30 | 0.02 | 0.36 | 0.34 | 0.53 | -0.35 | |
| P value | ns | ns | ns | ns | ns | ns | ns | ns | ns | ||
| CG-1357 | r | -0.02 | 0.04 | -0.09 | -0.06 | 0.12 | 0.06 | -0.15 | -0.19 | 0.11 | |
| P value | ns | ns | ns | ns | ns | ns | ns | ns | ns | ||
| CG-1341 | r | -0.06 | 0.52 | -0.47 | 0.02 | -0.35 | 0.67 | -0.26 | -0.73 | -0.44 | |
| P value | ns | ns | <0.05 | ns | ns | <0.05 | ns | <0.05 | ns | ||
| CG-1254 | r | 0.21 | 0.37 | 0.12 | 0.14 | 0.39 | 0.27 | 0.68 | 0.12 | 0.23 | |
| P value | ns | ns | ns | ns | ns | ns | <0.05 | ns | ns | ||
| CG-1212 | r | -0.16 | -0.11 | -0.34 | 0.14 | -0.36 | 0.07 | -0.21 | 0.10 | -0.68 | |
| P value | ns | ns | ns | ns | ns | ns | ns | ns | <0.05 | ||
| CG-1180 | r | -0.06 | 0.01 | -0.14 | 0.40 | -0.44 | 0.50 | -0.32 | 0.40 | -0.39 | |
| P value | ns | ns | ns | ns | <0.05 | ns | ns | ns | ns | ||
| Correlation of / with | Igf1 (2−ΔCT) | E17.5 liver | |||||||||
| |
All |
All male |
All female |
All control |
All PSE |
Male control |
Male PSE |
Female control |
Female PSE |
||
| Igf1 promoter methylation [%] | CG-1509 | r | -0.34 | -0.47 | -0.02 | -0.32 | -0.05 | -0.28 | -0.35 | -0.29 | 0.14 |
| P value | <0.05 | <0.05 | ns | ns | ns | ns | ns | ns | ns | ||
| CG-1465 | r | -0.01 | -0.14 | 0.15 | 0.01 | 0.04 | -0.07 | -0.30 | 0.08 | 0.16 | |
| P value | ns | ns | ns | ns | ns | ns | ns | ns | ns | ||
| CG-1430 | r | -0.39 | -0.59 | -0.12 | -0.55 | -0.16 | -0.41 | -0.49 | -0.51 | 0.24 | |
| P value | <0.05 | <0.05 | ns | <0.001 | ns | ns | ns | ns | ns | ||
| CG-1357 | r | 0.02 | -0.15 | 0.34 | -0.19 | 0.35 | -0.39 | 0.45 | 0.29 | 0.49 | |
| P value | ns | ns | ns | ns | ns | ns | ns | ns | ns | ||
| CG-1341 | r | 0.04 | -0.09 | 0.25 | -0.20 | 0.35 | -0.29 | 0.46 | 0.06 | 0.45 | |
| P value | ns | ns | ns | ns | ns | ns | ns | ns | ns | ||
| CG-1254 | r | -0.17 | -0.47 | 0.16 | -0.38 | 0.28 | -0.14 | -0.32 | -0.44 | 0.51 | |
| P value | ns | <0.05 | ns | ns | ns | ns | ns | ns | ns | ||
| CG-1212 | r | -0.17 | -0.28 | -0.01 | -0.27 | -0.02 | 0.00 | -0.11 | -0.28 | 0.14 | |
| P value | ns | ns | ns | ns | ns | ns | ns | ns | ns | ||
| CG-1180 | r | -0.12 | -0.17 | -0.05 | -0.15 | -0.02 | 0.10 | -0.02 | -0.29 | 0.11 | |
| P value | ns | ns | ns | ns | ns | ns | ns | ns | ns | ||
| Correlation of / with | Igf1 (2−ΔCT) | D3 liver | |||||||||
| |
All |
All male |
All female |
All control |
All PSE |
Male control |
Male PSE |
Female control |
Female PSE |
||
| Igf1 promoter methylation [%] | CG-1509 | r | -0.22 | 0.25 | 0.47 | 0.27 | -0.22 | 0.50 | -0.13 | -0.31 | -0.30 |
| P value | ns | ns | <0.05 | ns | ns | ns | ns | ns | ns | ||
| CG-1465 | r | -0.07 | -0.06 | -0.23 | 0.28 | -0.10 | 0.00 | 0.11 | 0.37 | -0.38 | |
| P value | ns | ns | ns | ns | ns | ns | ns | ns | ns | ||
| CG-1430 | r | -0.60 | -0.53 | -0.52 | -0.55 | -0.37 | -0.52 | -0.40 | -0.65 | -0.11 | |
| P value | <0.001 | <0.05 | <0.05 | <0.01 | ns | ns | ns | ns | ns | ||
| CG-1357 | r | -0.48 | -0.23 | -0.38 | -0.17 | -0.16 | -0.10 | 0.01 | -0.25 | -0.36 | |
| P value | ns | ns | ns | ns | ns | ns | ns | ns | ns | ||
| CG-1341 | r | -0.05 | 0.03 | -0.18 | -0.01 | -0.17 | 0.34 | -0.08 | -0.20 | -0.26 | |
| P value | ns | ns | ns | ns | ns | ns | ns | ns | ns | ||
| CG-1254 | r | -0.80 | -0.73 | -0.89 | -0.75 | -0.63 | -0.69 | -0.62 | -0.95 | -0.73 | |
| P value | < 0.0001 | <0.001 | <0.001 | < 0.001 | <0.01 | ns | ns | <0.05 | <0.05 | ||
| CG-1212 | r | -0.52 | -0.49 | -0.65 | -0.49 | -0.29 | -0.42 | -0.30 | -0.57 | -0.28 | |
| P value | <0.01 | <0.05 | <0.05 | ns | ns | ns | ns | ns | ns | ||
| CG-1180 | r | -0.52 | -0.57 | -0.47 | -0.52 | -0.41 | -0.50 | -0.48 | -0.60 | -0.19 | |
| P value | <0.001 | <0.05 | <0.05 | <0.05 | ns | ns | ns | ns | ns | ||
ns: non significant
A general correlation between Igf1 mRNA levels and methylation was seen in fetal liver at CpG-1509 (r = −0.34, P<0.05) and CpG-1430 (r = −0.39, P<0.05), which was also found in control mice (r = −0.55, P<0.05) but was disrupted after PSE. Sex-dependent correlations at CpG-1509 (r = −0.47, P<0.05), CpG-1430 (r = −0.59, P<0.05), and CpG-1254 (r = −0.47, P≤0.05) were seen in male but not in female mice.
Correlations in neonatal liver were found in all offspring for CpG-1430 (r = −0.60, P≤0.001), CpG-1254 (r = −0.80, P<0.0001), CpG-1212 (r = −0.52, P<0.01), and CpG-1180 (r = −0.52, P<0.001; Table 3). All of these were also detected when discriminating between male and female mice. While the correlation for CpG-1254 was strongest and found within both exposure groups, correlations for CpG-1430 (r = −0.55, P<0.01; Table 3) and CpG-1180 (r = −0.52, P<0.05; Table 3) were found sex-independently in control but not in PSE groups.
Moderate PSE-effect on Igf1r and Igf1 gene expression
Hepatic mRNA levels of Igf1r and Igf1 were sex-dependently affected at fetal stage (Igf1r, male: P = 0.01, female: P value non significant; Supplementary Figure 5D, Igf1, male, P = 0.04, female, P value non significant; Supplementary Figure 5M). Here, Igf1r mRNA levels also showed differential PSE response (P = 0.01; Supplementary Figure 5D) in male and female fetuses and reduced gene expression at three days after birth (male: P = 0.01, female: P = 0.03; Supplementary Figure 5E). A general smoke effect was found for Igf1r mRNA in fetal lung (P = 0.03; Supplementary Figure 5I), while no effect was seen in neonatal lung.
In neonatal liver, the Igf1 mRNA levels were decreased in PSE males and females (P = 0.08 in each group; Supplementary Figure 5N), which resulted in a general and sex-independent reduction (P = 0.01; Supplementary Figure 5R).
Divergent mRNA expression levels of Igf1r and Igf1 were higher in lung when compared to liver (Igf1r: Supplementary Figure 5G, H; Igf1: Supplementary Figure 5P,Q). Noteworthy in this context are the higher mRNA levels of Igf1r and Igf1 in fetal and neonatal lung when compared to liver as well as the increase of Igf1 expression in liver when comparing fetuses and neonates (Supplementary Figure 5O), together with a constant/stable Igf1 expression in lung Supplementary Figure 5L).
Igf1r and Igf1 gene expression correlate in lung and liver of fetuses and neonates
Expression levels of Igf1r and Igf1 correlated strongly in lung and liver of both fetuses and neonates. A summary of the correlation analysis per time point and organ can be found in Table 4. For the lung, PSE did not have a large effect on the correlation of Igf1 and Igf1r. However, for the liver, the discrimination upon sex and exposure type revealed a sex-dependent effect of PSE on the Igf1r-Igf1 relation. While the correlation in liver of male (r = 0.92, P<0.0001) and female (r = 0.82, P≤0.01) fetuses, as well as female neonates (r = 0.83, P<0.05), was disrupted after PSE, the opposite occurred in male neonatal liver, where PSE induced a strong correlation (r = 0.91, P<0.001), which was not present in male control neonates.
Table 4.
Correlation between Igf1r and Igf1 mRNA concentration in fetal and neonatal lung and liver
| Correlation of Igf1r with Igf1 | All | All |
All |
Male |
Female |
||||||
|---|---|---|---|---|---|---|---|---|---|---|---|
| Male | Female | Control | PSE | Control | PSE | Control | PSE | ||||
| Lung | Fetal | r | 0.67 | 0.71 | 0.77 | 0.87 | 0.72 | 0.69 | 0.79 | 0.87 | 0.58 |
| P value | < 0.0001 | <0.001 | <0.001 | < 0.0001 | <0.001 | <0.05 | <0.01 | <0.001 | <0.05 | ||
| D3 | r | 0.85 | 0.78 | 0.87 | 0.80 | 0.81 | 0.76 | 0.78 | 0.76 | 0.86 | |
| P value | < 0.0001 | <0.001 | <0.001 | <0.001 | 0.001 | <0.05 | <0.01 | <0.05 | <0.001 | ||
| Liver | Fetal | r | 0.60 | 0.74 | 0.60 | 0.81 | 0.51 | 0.92 | 0.52 | 0.82 | 0.47 |
| P value | < 0.0001 | < 0.0001 | <0.01 | < 0.0001 | <0.05 | <0.0001 | ns | <0.01 | ns | ||
| D3 | r | 0.71 | 0.83 | 0.78 | 0.67 | 0.68 | 0.55 | 0.91 | 0.83 | 0.47 | |
| P value | < 0.0001 | <0.001 | <0.0001 | <0.001 | <0.001 | ns | <0.001 | <0.05 | ns | ||
Discussion
Global methylation changes due to prenatal smoke exposure (PSE) were described and, by now, validated in human infant blood samples (e.g., [7]), but analysis in organs such as lung or liver has been rarely done. As yet, it was concluded that epigenetic responses to environmental in utero exposures are tissue-specific [19], and that each tissue has a unique epigenetic signature that likely reflects differential tissue functions [20]. In the present study, we described organ-specific rather than general systemic fetal programming of Igf1r and Igf1 as a result of PSE, which additionally caused sex-dependent and CpG site-specific aberrant promoter methylation patterns. Sexually dimorphic methylation patterns of several gene promoters were described in the liver of male and female mice [21,22] and sex differences in male mice were conserved during aging, while sex differences in females were lost [23]. Moreover, the influence of, for example nanoparticles or maternal dietary content (methyl donor rich vs. poor) on gene promoter methylation in lung of mouse offspring was previously demonstrated [24,25], but no other studies analyzed the effect of PSE on methylation patterns of our target genes in murine lung and liver at two time points. The comparison of fetal and neonatal methylation patterns revealed differences that highlight the severity of PSE. We can relate the described alterations in organ-specific methylation signatures of Igf1r and Igf1 in male and female mice to an additional smoking of 20 cigarettes. This may suggest that late-term PSE can still induce fetal programming. This effect was predominantly seen for Igf1r in female lung and for Igf1 in female liver.
We also found organ-specific Igf1r and Igf1 gene expression with higher levels in lung than in liver. This indicates their organ-specific production and suggests local regulation. Our findings are in accordance with those that found that deletion of hepatic Igf1 in mice leaves its local production in other tissues unaffected [26]. When comparing fetuses and neonates, we observed an increase of hepatic Igf1 expression accompanied by simultaneous increase of Igf1r. Together with the stable amount of Igf1 in lung, this may indicate the onset of a hepatic secretory function, as Igf1 gene expression was shown to gradually increase from fetal day 18 onwards [27] to postnatal age [26], thus establishing its role in postnatal development. PSE seems to interfere with these observations, considering the reduced Igf1 mRNA levels in neonatal lung.
We also showed that PSE affects gene expression primarily in male offspring. The predominant impact was observed in liver. Various in vivo studies on organ-specific Igf1 gene expression showed its dependence on steroid hormone actions (e.g., [28,29]). Sexually dimorphic responses to PSE were described in human fetal liver and suggest that, dependent on sex, different pathways may be affected but may converge in the same disease outcome [30,31]. Interestingly, sex-specific methylation patterns were also affected by testosterone in selected organs, which in turn influenced gene expression [32]. These findings match our observation of higher baseline Igf1 gene expression in lung of male fetuses for the reasons discussed above. Albeit the moderate effect of PSE on Igf1r and Igf1 gene expression, strong correlations in both organs suggest a mutual regulation. Igf1 mediates its effects by exclusively interacting with Igf1r [14], which suggests a feedback loop [33] in lung and liver at both analyzed time points. A high susceptibility to smoke-induced deregulation appears reasonable and is suggested by the disturbance of the described correlations by PSE.
Until now, no technique is available to evaluate the extent of how changes in mRNA levels are related to, influenced, or maybe even caused by aberrant methylation of a gene promoter under physiological circumstances. Nevertheless, PSE-induced differential DNA methylation correlated with deranged gene expression along signature pathways [34]. Here, we described disrupted or induced correlations between promoter methylation and mRNA levels for both Igf1r and Igf1. The divergent CpG site-specific methylation status after PSE suggests a contribution to disturbed gene expression. The findings in liver, especially three days after birth, match the general association of hyper-/hypo-methylation and gene silencing/activation. Hypermethylation mainly in liver of male fetuses, combined with the inverse correlations at three CpG sites in males but not in females could explain the sex-dependent reduction of Igf1 mRNA levels in male mice. The results obtained for the lung can only partially explain the general smoke effect on Igf1r mRNA in fetal lung and the lack of PSE-response in neonatal lung by a link between mRNA levels and promoter methylation. However, it may indicate that organ-specific expression of genes may be regulated differently. Our data together with the correlation analysis suggest that DNA methylation and gene expression in lung and liver of mouse fetuses and neonates may be linked, dependent on the location of the CpG site, but also dependent on the offspring's sex.
In light of these observations, it is important to note that the physical occurrence of DNA methylation in the context of gene sequence may play a role in its regulation or reflect its effect in transcription. The level of gene expression is in general inversely correlated with DNA methylation in promoter regions whereas methylation in the body of genes has been correlated with increased transcription [35]. While the described associations between complete (de)methylation and a gene ‘being switched on or off’ account for large differences in methylation levels, a new paradigm focuses on small DNA methylation changes. Those are often caused by environmental influences, at limited genomic regions or CpG site specific, and during period of epigenetic sensitivity (see for a review [36]). Following this model, these small methylation differences, similar to our findings, often reach only 1–5% but are sufficient to disturb the “fine-tuning” of a gene methylation signature and thereby become the hallmark of non-malignant disorders. These small methylation changes are also found in analyses of newborns born to smoking mothers [37,38] and were described, for example, for allergic asthma in adults and children [39]. It needs to be stressed, however, that it is currently unknown how large the biological consequences of these small but consistent differences are.
The organ-specific findings stress the limited significance of analyses in blood-derived (human) samples regarding the display of the possible smoking-associated effects in the fetus itself. It appears that those assessments may not necessarily represent the actual outcome of PSE in the offspring. Given that a similarly designed experimental approach in humans would be unethical, the here-described data indicate the absolute necessity for fundamental (in vivo) research on functional epigenetic links. They further indicate the need of longitudinal studies for a more accurate display of developmental and health consequences due to pregnancy smoking. Although we evaluated the methylation states of Igf1r and Igf1 gene promoters, subsequent analyses should include other putative regulatory regions and, for example, equally important changes on the chromatin level as suggested by Bauer et al. [40] In addition, in future studies it seems necessary to differentiate more precisely between different cell types within one organ, to reach the basic level of epigenetic regulation. This would, on the long run, allow identifying cell-specific methylation effects vs. more systemic changes. Ultimately, this would then allow a more mechanistic interpretation of the human data obtained with blood cells only. Regarding the magnitude of the described differences, in particular when comparing fetuses and neonates, the reader should note that both time points mark an interval of a few days. During this time frame both organs are still developing and undergo extensive structural changes immediately after birth. Thus, time point differences due to a diverse cellular composition (e.g., proportion of cell types, number of cells, differentiation status) should be taken into account, as they may be a potential confounder within this comparison.
Conclusion
Taking together, our data show that PSE influences DNA methylation patterns of Igfr1 and Igf1 promoter regions in liver and lung. It further disturbs, directly or indirectly, mRNA levels of these insulin growth factor network members in both organs. The described effects are, at specific time points, sex-dependent and are distinct when comparing lung and liver. We conclude that the adverse outcomes of prenatal smoke exposure are organ-specific, rather than systemic, as one might expect (given the indirect exposure). Additionally, the impact of PSE on DNA methylation status and mRNA levels differs when comparing fetuses and neonates. This suggests varying persistence of PSE-induced alterations. Our study emphasizes the possibility of a sex-dependent response to PSE and may serve to identify possible new epigenetic targets to further elucidate fetal programming due to smoking during pregnancy and its biological consequence.
Material and Methods
Animals and smoke exposure
A total of 48 female and 48 male C57BL/6J mice were obtained from Harlan (Horst, The Netherlands) at 6 weeks of age, housed under standard conditions with food and water provided ad libitum and at a 12 hour light/dark cycle. The experimental setup was approved by the local committee on animal experimentation (DEC6589 B & C; University of Groningen, Groningen, The Netherlands) and under strict governmental and international guidelines on animal experimentation.
Mainstream cigarette smoke was generated by using Teague10 (Tobacco and Health Research Institute of the University of Kentucky, Lexington, KY, USA). Over a period of 7 days, randomly selected primiparous female mice were adjusted to cigarette smoke by stepwise increasing the number of smoked cigarettes (3R4 cigarettes; 2.45 mg nicotine/cigarette) from 2 to 5 per smoking session. At adjustment day 5 after the end of the second smoking session, all female mice were injected with PMSG (1.25 i.u.) to stimulate ovulation and, at day 7, with hCG (1.25 i.u.) to induce ovulation, and housed on a 1:1 mating ratio with males overnight. Mating was confirmed by the presence of vaginal plug the following morning.
Female mice were exposed to two air or whole body smoking sessions per day, 7 days per week throughout gestation and housed in groups. After delivery, dams and their offspring were no longer exposed to cigarette smoke and housed individually.
Each 12 male and 12 female fetuses of 5 smoke-exposed and 4 control dams were collected at embryonic stage 17.5 (E17.5) and dams were euthanized under anesthesia. A total of 42 pups randomly selected from 9 smoke-exposed (11 male, 8 female) and 10 control (11 male, 12 female) dams were euthanized at postnatal day 3 (D3) for collection of lung and liver. The material was immediately frozen in liquid nitrogen and stored at -80°C until further use.
Determination of genetic sex of mice
DNA from the tail of E17.5 and D3 mice was obtained by SDS denaturation, high salt extraction, and precipitation. The amplification reaction was adopted from Lambert et al. [41] and performed using two primer sets that are specific for the genes Sry (forward: 5'-TGGTCCCGTGGTGAGAGGC-‘3, reverse: 5′-TATGTGATGGCATGTGGGTTCC-'3) and IL3 (forward: 5′-GGGACTCCAAGCTTCAATCA-'3, reverse: 5′-TGGAGGAGGAAGAAAA GCAA-'3).
Isolation of DNA and mRNA
DNA and mRNA were isolated using the AllPrep DNA/RNA Mini Kit (Qiagen, Cat No. 80204), according to the manufacturer's protocol.
Pyrosequencing-based bisulfite PCR analysis
For the assessment of promoter methylation levels of Igf1r and Igf1, bisulfite sequencing primers were designed using PyroMark assay design software (version 2.0, Qiagen). Selection of CpG sites was based on manual identification of CpG dinucleotides, using ENSEMBL genome web browser (Ensembl 83: Dec 2015) and transcript location for the identification of gene promoter regions. Analysis of mouse Igf1r gene (ENSMUSG 00000005533) was done using transcript Igf1r-001 (ENSMUST00000005671). Mouse Igf1 (ENSMUSG00000020053) has eight transcripts. In this study, we focused on transcript Igf-005 (ENSMUST00000122386), as previously discussed [11].
Extracted genomic DNA from lung and liver (500 ng) was converted with sodium bisulfite (EZ DNA Methylation-Direct™, Zymo Research, Cat. No. D5021), following the manufacturer's instructions. In short, bisulfite conversion was carried out in the dark at 98°C for 10 minutes and 64°C for 3.5 hours followed by desulphonation of the converted DNA. Gene amplification was done using HotStarTaq® MasterMix Kit (Qiagen, Cat. No. 203443). Further specifications on amplification conditions and primer sequences are listed in Table 5. Amplification conditions: 95°C for 15 min, 94°C for 30 s, 59°C for 30 s, 72°C for 30 s, 40 cycles in a reaction volume of 25 μL. To assess DNA methylation levels of Igf1 and Igf1r promoter methylation, bisulfite sequencing was performed on the PyroMarkQ24 (Qiagen) instrument. Relative levels of methylation at each CpG site were analyzed with PyroMark Q24 2.0.6 software.
Table 5.
Bisulfite amplification (F/R) and sequencing (S) primers
| Gene | Targeted CpG site position |
Sequences 5’ – 3’ |
|---|---|---|
| Igf1 | 1509-1430 Amplicon length [bp] 209 |
F: AGAGGGTTGGAAAGAGTTTAAG R: AAACCAAACTTACCTCAATCTCTTAC S1: AGGTTTTTATTTATGGGG S2: GTATTTTTAAATTTTTTTGAGA Sequence to analyze: S1: TAGYGTAAAGAGGTAGTGTAGAGTTTTTAATTGGTTTTTGTTTTTATYGATGTGTTAGTATTTTTAAATTTTTTTGAGA S2: GTTYGAGAGAGTAAGAGATTGAGGTAAGT |
| 1357–1254 Amplicon length [bp] 212 |
F: AGAGTAAGAGATTGAGGTAAGTT R: TTACCACAAAAAATAAAATTCTAATCTTC S1: GGGAAAGTATATTTGGAG S2: TTATTGAGAAATAGGTATAAAT Sequence to analyze: S1: AGATATTYGTGGAAAGTATGTAGYGTTTAATTTGGGTTTTTGTAATTTTTTTTTATAATTTATTTTTTTATTTATTGTTTTTGAAAGATTATTGAGAAATAGGTATAAAT S2: YGTATTAATAGAAGATTAGAATTTTA |
|
| 1212–1180 Amplicon length [bp] 250 |
F: TTGGAGAGATATTAGTGGAAAGTATGTAG R: AATTATAATATCATTCAAATCCCTCAACT S: AGAATTTTATTTTTTGTGGTAAAG Sequence to analyze: GYGAGTTTATATATTATAAATAGTAGAAGTAGTYGGTTTGAATTATGTTGTTAGTTATT |
|
| Gene |
Targeted CpG site position |
Sequences 5’ – 3’ |
| Igf1r | 272-164 Amplicon length [bp] 327 |
F: GGGGATTTTTTTTAGGAGTTAGATTTTA R: ATTTTCCTCCTTCTTCTACATCT S1: TTA TTT GGG ACG AAA TTT S2: GATAAGGAGGGTGG S3: GGAGTYGGGAAGT Sequence to analyze: S1: TTTTTATTTTYGTTTAAAAATAAGAGYGTAGGYGAYGATTTTYGGAAAGYGGYGTGGATAAGGAGGGTGG S2: YGYGGGGYGGTTTTTTAGYGTYGGTAGTAGYGGTTTAYGGGGYGGYGGAGTYGGGAAGT S3: YGGGGYGYGTYGGGGYGGGTTGTYGGYGTYGTYGGTTTTTATTTGTAAAYGTAGAGATGTAGAAGAAGGAGGAAA |
| 17 Amplicon length [bp] 120 |
F: AGTGAGGATTGAGTTGGAGATTT R: CCTCCCAAACCAAACTTCATTCCTTTTAT S: ATTTTTGAGAAAAGGGAATT Sequence to analyze: TYGTTTTAAATAAAAGGAATGAAGTTT |
mRNA expression analysis
Quantitative PCR for mRNA levels was performed using TaqMan® Fast Advanced Master Mix (Thermo Fisher Scientific, Cat. No. 4444964) with commercially available primers for target genes Igf1r (Applied Biosystems, Mm00802831_m1) and Igf1 (Applied Biosystems, Mm00439560_m1). Detection of amplification reactions were performed using Step One Plus RealTime PCR System (Applied Biosystems) with cycling conditions as follows: 95°C for 20 s, 40 cycles of 95°C for 1 s, 60°C for 20 s. Reactions were performed in triplicate and normalized to housekeeping gene Gapdh (Applied Biosystems, Mm99999915_g1).
In fetal lung, we excluded 3 out of 48 data points for Igf1, and 1 out of 48 for Igf1r; in fetal liver, we excluded 1 out of 48 for Igf1, and 3 out of 48 for Igf1r; in neonatal lung, we excluded 1 out of 42 data points for Igf1, 2 out of 42 for Igf1r mRNA levels; in neonatal liver, we excluded 5 out of 42 data points for each Igf1 and Igf1r due to large differences between target and housekeeping gene.
Calculations and statistical methods
Relative gene expression (2−ΔCt method) as well as mean percent methylation and standard error of the mean (SEM) were calculated in Microsoft® Office Excel 2003. DNA methylation data and mRNA levels were tested for normal distribution of residuals (IBM® SPSS® version 22 release 22.0.0.1). As only around half of the data set was normally distributed, we decided not to analyze upon factor interaction of the offspring's sex and the type of exposure but evaluate all analyzed parameters in the subgroups via two-tailed Mann-Whitney U-test. A correlation of both percent methylation and target gene mRNA levels in fetal and neonatal lung and liver was assessed using nonparametric Spearman correlation test. P values ≤0.05 were considered significant. Since our comparative analysis approach was hypothesis driven, and in order to present the reader all the results, we did not adjust our significance levels for multiple testing, as suggested by ref. [42].
Authors' contributions
KFM performed the mouse experiment. KFM and RNVS collected data. KFM, MNH, and TP critically discussed results. KFM wrote the manuscript and prepared the figures. MNH and TP provided project leadership. MNH and LK drafted the grant proposal. All authors read, helped with revising, and approved the final manuscript.
Abbreviations
- D3
Time point at three days after birth
- E17.5
Time point at embryonic stage 17.5
- GAPDH
Glyceraldehyde 3-phosphate dehydrogenase
- IGF
Insulin-like growth factor
- IGF1R
Insulin-like growth factor1 receptor
- PSE
Prenatal Smoke Exposure
Funding Statement
This work was supported by the Lung Foundation Netherlands under grant LF3.2.11.013. KFM, MNH and LK are participants of COST (Cooperation in Science and Technology) Action BM1201.
Disclosure of interest
The authors report no conflict of interest.
References
- [1].Banderali G, Martelli A, Landi M, et al. Short and long-term health effects of parental tobacco smoking during pregnancy and lactation: a descriptive review. J Transl Med. 2015;13:327. doi: 10.1186/s12967-015-0690-y. [DOI] [PMC free article] [PubMed] [Google Scholar]
- [2].Blacquière MJ, Timens W, van den Berg A, et al. Maternal smoking during pregnancy decreases Wnt signalling in neonatal mice. Thorax. 2010;65(6):553–554. doi: 10.1136/thx.2009.120154. [DOI] [PubMed] [Google Scholar]
- [3].Neal RE, Chen J, Webb C, et al. Developmental cigarette smoke exposure II: Hepatic proteome profiles in 6 months old adult offspring. Reprod Toxicol. 2016;65:414–424. doi: 10.1016/j.reprotox.2016.06.009. [DOI] [PMC free article] [PubMed] [Google Scholar]
- [4].Bakker H, Jaddoe VW. Cardiovascular and metabolic influences of fetal smoke exposure. Eur J Epidemiol. 2011;26(10):763–770. doi: 10.1007/s10654-011-9621-2. [DOI] [PMC free article] [PubMed] [Google Scholar]
- [5].Barker DJ. The fetal and infant origins of disease. Eur J Clin Invest. 1995;25(7):457–463. doi: 10.1111/j.1365-2362.1995.tb01730.x. PMID:7556362. [DOI] [PubMed] [Google Scholar]
- [6].Gillman MW. Developmental origins of health and disease. New Engl J Med. 2005;353(17):1848–1850. doi: 10.1056/NEJMe058187. [DOI] [PMC free article] [PubMed] [Google Scholar]
- [7].Breton CV, Siegmund KD, Joubert BR, et al. Asthma BRIDGE consortium. Prenatal tobacco smoke exposure is associated with childhood DNA CpG methylation. PLoS One. 2014;9(6):e99716. doi: 10.1371/journal.pone.0099716. [DOI] [PMC free article] [PubMed] [Google Scholar]
- [8].Joubert BR, Håberg SE, Nilsen RM, et al. 450K epigenome-wide scan identifies differential DNA methylation in newborns related to maternal smoking during pregnancy. Environ Health Perspect. 2012;120(10):1425–1431. doi: 10.1289/ehp.1205412. [DOI] [PMC free article] [PubMed] [Google Scholar]
- [9].Richmond RC, Simpkin AJ, Woodward G, et al. Prenatal exposure to maternal smoking and offspring DNA methylation across the lifecourse: findings from the Avon Longitudinal Study of Parents and Children (ALSPAC). Hum Mol Genet. 2015;24(8):2201–2217. doi: 10.1093/hmg/ddu739. [DOI] [PMC free article] [PubMed] [Google Scholar]
- [10].Bouwland-Both MI, van Mil NH, Tolhoek CP, et al. Prenatal parental tobacco smoking, gene specific DNA methylation, and newborns size: the Generation R study. Clin Epigenetics. 2015;7:83. doi: 10.1186/s13148-015-0115-z. [DOI] [PMC free article] [PubMed] [Google Scholar]
- [11].Meyer KF, Krauss-Etschmann S, Kooistra W, et al. Prenatal exposure to tobacco smoke sex dependently influences methylation and mRNA levels of the Igf axis in lungs of mouse offspring. Am J Physiol Lung Cell Mol Physiol. 2017;312(4):L542–L555. doi: 10.1152/ajplung.00271.2016. [DOI] [PubMed] [Google Scholar]
- [12].Balansky R, Ganchev G, Iltcheva M, et al. Differential carcinogenicity of cigarette smoke in mice exposed either transplacentally, early in life or in adulthood. Int J Cancer. 2012;130(5):1001–1010. doi: 10.1002/ijc.26103. [DOI] [PubMed] [Google Scholar]
- [13].Whitehead TP, Robinson D, Allaway SL. The effects of cigarette smoking and alcohol consumption on serum liver enzyme activities: a dose-related study in men. Ann Clin Biochem. 1996;33:530–535. doi: 10.1177/000456329603300607. [DOI] [PubMed] [Google Scholar]
- [14].Louvi A, Accili D, Efstratiadis A. Growth-promoting interaction of IGF-II with the insulin receptor during mouse embryonic development. Dev Biol. 1997;189:33–48. doi: 10.1006/dbio.1997.8666. [DOI] [PubMed] [Google Scholar]
- [15].Epaud R, Aubey F, Xu J, et al. Knockout of insulin-like growth factor-1 receptor impairs distal lung morphogenesis. PLoS One. 2012;7(11):e48071. doi: 10.1371/journal.pone.0048071. [DOI] [PMC free article] [PubMed] [Google Scholar]
- [16].Baker J, Liu JP, Robertson EJ, et al. Role of insulin-like growth factors in embryonic and postnatal growth. Cell. 1993;75(1):73–82. doi: 10.1016/S0092-8674(05)80085-6. PMID:8402902. [DOI] [PubMed] [Google Scholar]
- [17].Liu JP, Baker J, Perkins AS, et al. Mice carrying null mutations of the genes encoding insulin-like growth factor I (Igf-1) and type1 IGF receptor (Igf1r). Cell. 1993;75(1):59–72. PMID:8402901. [PubMed] [Google Scholar]
- [18].Pringle PJ, Geary MP, Rodeck CH, et al. The influence of cigarette smoking on antenatal growth, birth size, and the insulin-like growth factor axis. J Clin Endocrinol Metab. 2005;90(5):2556–2562. doi: 10.1210/jc.2004-1674. [DOI] [PubMed] [Google Scholar]
- [19].Novakovic B, Ryan J, Pereira N, et al. Postnatal stability, tissue, and time specific effects of AHRR methylation change in response to maternal smoking in pregnancy. Epigenetics. 2014;9(3):377–386. doi: 10.4161/epi.27248. [DOI] [PMC free article] [PubMed] [Google Scholar]
- [20].Armstrong DA, Lesseur C, Conradt E, et al. Global and gene-specific DNA methylation across multiple tissues in early infancy: implications for children's health research. FASEB J. 2014;28(5):2088–2097. doi: 10.1096/fj.13-238402. [DOI] [PMC free article] [PubMed] [Google Scholar]
- [21].Yokomori N, Moore R, Negishi M. Sexually dimorphic DNA demethylation in the promoter of the Slp (sex-limited protein) gene in mouse liver. Proc Natl Acad Sci U S A. 1995;92(5):1302–1306. doi: 10.1073/pnas.92.5.1302. PMID:7877972. [DOI] [PMC free article] [PubMed] [Google Scholar]
- [22].Yokomori N, Kobayashi R, Moore R, et al. A DNA methylation site in the male-specific P450 (Cyp 2d-9) promoter and binding of the heteromeric transcription factor GABP. Mol Cell Biol. 1995;15(10):5355–5362. doi: 10.1128/MCB.15.10.5355. PMID:7565685. [DOI] [PMC free article] [PubMed] [Google Scholar]
- [23].Takasugi M, Hayakawa K, Arai D, et al. Age- and sex-dependent DNA hypomethylation controlled by growth hormone in mouse liver. Mech Ageing Dev. 2013;134(7-8):331–337. doi: 10.1016/j.mad.2013.05.003. [DOI] [PubMed] [Google Scholar]
- [24].Tabish AM, Poels K, Byun HM, et al. Changes in DNA methylation in mouse lungs after a single intra-tracheal administration of nanomaterials. PLoS One. 2017;12(1):e0169886. doi: 10.1371/journal.pone.0169886. [DOI] [PMC free article] [PubMed] [Google Scholar]
- [25].Boon K, Tomfohr JK, Bailey NW, et al. Evaluating genome-wide DNA methylation changes in mice by methylation specific digital karyotyping. BMC Genomics. 2008;9:598. doi: 10.1186/1471-2164-9-598. [DOI] [PMC free article] [PubMed] [Google Scholar]
- [26].Butler AA, LeRoith D. Minireview: tissue-specific versus generalized gene targeting of the Igf1 and Igf1r genes and their roles in insulin-like growth factor physiology. Endocrinology. 2001;142(5):1685–1688. doi: 10.1210/endo.142.5.8148. [DOI] [PubMed] [Google Scholar]
- [27].Kikuchi K, Bichell DP, Rotwein P. Chromatin changes accompany the developmental activation of insulin-like growth factor I gene transcription. J Biol Chem. 1992;267(30):21505–21511. PMID:1400462. [PubMed] [Google Scholar]
- [28].Ohtsuki T, Otsuki M, Murakami Y, et al. Alternative leader-exon usage in mouse IGF-I mRNA variants: class 1 and class 2 IGF-I mRNAs. Zool. Sci. 2007;24(3):241–247. doi: 10.2108/zsj.24.241. [DOI] [PubMed] [Google Scholar]
- [29].Hogg K, Wood C, McNeilly AS, et al. The in utero programming effect of increased maternal androgens and a direct fetal intervention on liver and metabolic function in adult sheep. PLoS One. 2011;6(9):e24877. doi: 10.1371/journal.pone.0024877. [DOI] [PMC free article] [PubMed] [Google Scholar]
- [30].Filis P, Nagrath N, Fraser M, et al. Maternal smoking dysregulates protein expression in second trimester human fetal livers in a sex-specific manner. J Clin Endocrinol Metab. 2015;100(6):E861–E870. doi: 10.1210/jc.2014-3941. [DOI] [PMC free article] [PubMed] [Google Scholar]
- [31].O'Shaughnessy PJ, Monteiro A, Bhattacharya S, et al. Steroidogenic enzyme expression in the human fetal liver and potential role in the endocrinology of pregnancy. Mol Hum Reprod. 2013;19(3):177–187. doi: 10.1093/molehr/gas059. [DOI] [PubMed] [Google Scholar]
- [32].Reizel Y, Spiro A, Sabag O, et al. Gender-specific postnatal demethylation and establishment of epigenetic memory. Genes Dev. 2015;29(9):923–933. doi: 10.1101/gad.259309.115. [DOI] [PMC free article] [PubMed] [Google Scholar]
- [33].Moreno-Barriuso N, López-Malpartida AV, de Pablo F, et al. Alterations in alveolar epithelium differentiation and vasculogenesis in lungs of LIF/IGF-I double deficient embryos. Dev Dyn. 2006;235(8):2040–2050. doi: 10.1002/dvdy.20842. [DOI] [PubMed] [Google Scholar]
- [34].Suter M, Ma J, Harris A, et al. Maternal tobacco use modestly alters correlated epigenome-wide placental DNA methylation and gene expression. Epigenetics. 2011;6(11):1284–1294. doi: 10.4161/epi.6.11.17819. [DOI] [PMC free article] [PubMed] [Google Scholar]
- [35].Laurent L, Wong E, Li G, et al. Dynamic changes in the human methylome during differentiation. Genome Res. 2010;20(3):320–331. doi: 10.1101/gr.101907.109. [DOI] [PMC free article] [PubMed] [Google Scholar]
- [36].Leenen FAD, Muller CP, Turner JD. DNA methylation: conducting the orchestra from exposure to phenotype? Clin Epigenetics. 2016;8:92. doi: 10.1186/s13148-016-0256-8. [DOI] [PMC free article] [PubMed] [Google Scholar]
- [37].Küpers LK, Xu X, Jankipersadsing SA, et al. DNA methylation mediates the effect of maternal smoking during pregnancy on birth weight of the offspring. Int J Epidemiol. 2015;44(4):1224–1237. doi: 10.1093/ije/dyv048. [DOI] [PMC free article] [PubMed] [Google Scholar]
- [38].Murphy SK, Adigun A, Huang Z, et al. Gender-specific methylation differences in relation to prenatal exposure to cigarette smoke. Gene. 2012;494(1):36–43. doi: 10.1016/j.gene.2011.11.062. [DOI] [PMC free article] [PubMed] [Google Scholar]
- [39].Reinius LE, Gref A, Sääf A, et al. DNA methylation in the Neuropeptide S Receptor 1 (NPSR1) promoter in relation to asthma and environmental factors. PLoS One. 2013;8(1):e53877. doi: 10.1371/journal.pone.0053877. [DOI] [PMC free article] [PubMed] [Google Scholar]
- [40].Bauer T, Trump S, Ishaque N, et al. Environment-induced epigenetic reprogramming in genomic regulatory elements in smoking mothers and their children. Mol Syst Biol. 2016;12(3):861. doi: 10.15252/msb.20156520. [DOI] [PMC free article] [PubMed] [Google Scholar]
- [41].Lambert JF, Benoit BO, Colvin GA, et al. Quick sex determination of mouse fetuses. J Neurosci Methods. 2000;95(2):127–132. doi: 10.1016/S0165-0270(99)00157-0. PMID:10752483. [DOI] [PubMed] [Google Scholar]
- [42].McDonald JH. Multiple Comparisons. 3rd ed. Baltimore, Maryland: Sparky House Publishing; 2014. Handbook of Biological Statistics. p. 254–260. [Google Scholar]