

Abstract
BACKGROUND & AIMS
Process of care–based measures are used commonly to assess the quality of medical care provided to patients with chronic hepatitis C virus (HCV) infection. However, the links between these processes and patient outcomes are not clear.
METHODS
We conducted a large retrospective cohort study of 34,749 patients with HCV infection identified from the national Veterans Administration HCV Clinical Case Registry between 2003 and 2006. We examined the relationship between meeting process–based measures of HCV care (categorized into pretreatment, preventive or comorbid care, and treatment monitoring domains) and antiviral treatment-related outcomes. For each domain, we defined optimum care as receipt of all indicated care processes in that domain. Study end points were rates of antiviral treatment, treatment completion, and sustained virologic response (SVR), adjusted for patient demographics, comorbidities, use of health services, and intrafacility clustering.
RESULTS
Patients who received optimum pretreatment care were significantly more likely to receive antiviral treatment (odds ratio [OR], 3.2; 95% confidence interval [CI], 2.9–3.5), complete treatment (OR, 1.26; 95% CI, 1.13–1.43), and achieve an SVR (OR, 1.29; 95% CI, 1.01–1.65), than those with suboptimum pretreatment care. Optimum preventive or comorbidity care also independently was associated with receipt of antiviral treatment (OR, 1.36; 95% CI, 1.23–1.51), but not with completion of treatment or SVR. Optimum treatment monitoring was associated with a nonsignificant trend toward achieving an SVR (OR, 1.22; 95% CI, 0.95–1.56).
CONCLUSIONS
Optimum care for HCV infection—particularly the care delivered before treatment—is associated with increased rates of treatment and SVR. These data could be used to guide clinical policy as newer, more-effective treatments become available.
Keywords: Quality of Care, Performance, Chronic Liver Disease, Indicator
Chronic hepatitis C virus (HCV) infection is a common condition affecting 1.3% of the US population.1,2 Beginning in the 1990s, randomized trials of interferon and ribavirin showed improvement in achieving viral eradication in patients with HCV,3–8 and subsequent trials of direct-acting antivirals (DAAs) have proven even more successful.9,10 Several professional societies have published protocols for the care of HCV patients, with recommendations covering the diagnostic workup, prevention and treatment of common comorbidities, and initiation and monitoring of antiviral therapy.11,12 Despite these well-disseminated guidelines, data suggest that systematic deficiencies in HCV care exist.13–15 Moreover, the relationship between following such recommendations and improved clinical outcomes in the real-world settings outside of clinical trials is not known.
As with other conditions, quality of HCV care can be quantified using process-based measures (eg, confirming viremia, testing HCV genotype) or outcome-based measures of care (eg, sustained virologic response [SVR], mortality).16 Both are common elements in performance measurement sets. Process measures (PMs) have the advantage of requiring less risk adjustment because properly constructed specifications narrowly define the clinical circumstances for indicated care. Moreover, PMs are more directly under provider or system control, and thus are more direct targets for quality improvement efforts.16 However, to be a meaningful measure of quality, a process-of-care measure should be related to patient outcomes (ie, have predictive validity for the desired outcome).17 This relationship can be based on underlying trials or expert opinion. In HCV, trials do underlie many accepted standards (such as use of antiviral therapy and determining genotype before therapy), usually among highly selected populations, whereas others rely more on expert opinion (such as vaccination for hepatitis A and hepatitis B). Remarkably few studies empirically link process indicators to outcomes,18,19 and none have done so in HCV.
We evaluated the relationship between adherence to a broad set of process-based measures in HCV and 3 subsequent HCV-specific end points: receipt of antiviral treatment, completion of antiviral treatment, and the clinical outcome associated with improved survival—SVR. Evaluating this process-outcome link is particularly important with the changing landscape of treatment in HCV. If process of care independently predicts treatment end points in HCV, then it would suggest that efforts targeted at improving the broader sweep of health care quality might be the key to fulfilling the promise of the new agents in clinical practice.
Methods
Process-of-Care Measures
We measured process-based quality of care delivered to patients with HCV using 20 explicit PMs. A 9-member multidisciplinary expert panel derived these PMs using the RAND/University of California Los Angeles Appropriateness Method.20 This method has been widely used to develop a process-based measure of health care quality in other areas of medicine and has been shown to have content, construct, and predictive validity.21–25 Details of the HCV panel process and its results are described elsewhere.26 The PMs covered 3 domains of care. Seven PMs measured pretreatment care that precedes antiviral treatment in HCV (confirmation of HCV viremia, evaluation by HCV specialists, HCV genotype testing, liver biopsy in genotype 1 patients, and ruling out hepatitis B, autoimmune, and iron overload–related liver diseases); 7 PMs measured prevention-related and management of comorbid conditions–related care (human immunodeficiency virus testing, hepatitis A and B serology testing and vaccination if negative serology, treatment of depression, and treatment of substance use disorder); and 6 PMs measured treatment monitoring–related care (testing viral load before, at week 12, at week 24, at week 48 [for genotype 1], reducing ribavirin dose for anemia during antiviral treatment, and not prescribing growth-stimulating factors for leukopenia during antiviral treatment). Supplementary Table 1 contains the list of measures used in our study.
Data Source
We identified our study cohort from the Veterans Administration HCV Clinical Case Registry.27 This database contains health care use and clinical data for more than 300,000 patients with HCV. Data elements include demographics, all laboratory tests with results, outpatient and inpatient pharmacy data, and inpatient and outpatient use in the form of International Classification of Diseases, 9th revision and Current Procedural Terminology codes.
Study Cohort
Our study cohort comprised patients who had their first positive HCV laboratory test (antibody, polymerase chain reaction, or genotype) after December 2002 and had at least 2 years of follow-up evaluation before December 2006. Patients had to be older than 18 years at the time of HCV diagnosis, eligible for at least one of the HCV PMs, and have active viremia to be included in this analysis.
We applied the HCV PMs to our study cohort. For each PM, we developed specifications for measurement based on a combination of sources (International Classification of Diseases, 9th revision codes, Current Procedural Terminology codes, laboratory data, and so forth) in the database. For each subject, we determined if she/he was eligible for the process specified in each PM (Supplementary Table 1). We then determined if she/he received the care recommended by the PM. Supplementary Table 1 also contains the operational definition, number of eligible patients, and the pass rate for each measure.
Definition of Study Variables
Hepatitis C virus process measures and aggregate scores
We calculated each PM rate as the percentage of patients who received the care indicated by the PM out of all eligible patients. We then calculated 3 domain-specific HCV process scores; each as the percentage of recommended HCV PMs in each domain that an eligible patient received. Thus, each patient had a pretreatment care domain score, preventive/comorbid-related care domain score, and, in patients who received antiviral treatment, a treatment monitoring care domain score. For each patient and each domain, we then created an indicator for whether a patient received all recommended care in the domain for which she/he was eligible (optimum care) for each.
Study end points (outcomes)
We examined 3 sequential end points: receipt of antiviral treatment, completion of antiviral treatment, and SVR.
We defined antiviral treatment as at least one filled prescription of interferon. For patients who received multiple courses of treatment, we examined only their first course for this analysis.
We defined treatment duration by calculating the cumulative days of supply of interferon prescriptions as previously defined.28 Because patients in the clinical setting may have a shorter treatment course, we defined patients who completed at least 80% of expected treatment duration to have completed therapy as done in a previous study (ie, 38.4 weeks for genotypes 1 or 4 and 19.2 weeks for genotypes 2 or 3).29
We defined SVR as all RNA tests being negative after treatment completion with one being recorded at least 12 weeks after treatment completion.28
Statistical Analysis
We first examined the bivariate associations between meeting individual PMs and each of the study end points. We then conducted bivariate followed by multivariable logistic regression analyses to examine the overall domain effect on study outcomes.
In the first multivariable regression model, receipt of antiviral treatment was the dependent variable and the primary regressors were pretreatment and preventive/comorbid care optimum care indicators. This model was applied to patients who were eligible for at least one HCV PM. In the second regression model, treatment completion was the dependent variable and the main regressors were the same as described earlier. This model was applied only to those patients who started antiviral treatment before July 2005 (this ensured that all patients had more than 24 weeks of follow-up evaluation after their treatment course to allow ascertainment of treatment completion and SVR). In the third model, SVR was the dependent variable and the main regressors included 3 domains of HCV care. The third regression model was applied only to those patients who completed antiviral treatment.
We added the following covariates in the regression models: demographic characteristics (age, race), use of health care (number of medical visits per quarter), HCV genotype, diagnosis of cirrhosis, comorbid depression, drug or alcohol use, and presence of medical comorbidity that constituted potential contraindications to antiviral treatment on the basis of the American Association for the Study of Liver Disease guidelines. These included severe heart failure, chronic pulmonary obstructive disease, active coronary artery disease, severe hypertension or diabetes, and renal failure, as previously described.30
To take into account the fact that patients seen in the same facility tend to receive similar care, we assigned each patient a regular facility where she/he was seen most frequently, and adjusted the covariance matrix for intrafacility correlation using the generalized estimating equation method.
The results of these multivariable models are presented as odds ratios (OR) along with 95% confidence intervals (CIs). All analyses were conducted using SAS (version 9.2; SAS Institute, Cary, NC).
Sensitivity analyses
We conducted several sensitivity analyses. First, it is plausible that physicians may provide better care to patients who are likely to have better outcomes based on their baseline characteristics. This selection bias would result in higher care (particularly that occurring pretreatment) being related to higher rate of treatment. To address this, we reconstructed the treatment initiation model after excluding from our overall nationwide sample patients who met any of the treatment exclusions based on the contraindications specified in the American Association for the Study of Liver Disease guidelines.31 We used administrative and clinical data to define the presence of exclusions, as previously described.30 Because this approach might have missed several factors that could preclude treatment, such as patient’s noninterest in treatment and physicians’ assessment of the risk/benefit ratio associated with antiviral treatment for a given patient, we used data from a structured chart review of a random sample of 571 HCV viremic patients receiving care at 4 large Veteran’s Affairs (VA) facilities. For patients who did not meet PMs, we determined if the nonadherence was related to possibly justifiable exceptions including providers’ perception of patients’ comorbidities, patients’ refusal, or receipt of care outside the VA. Using the chart review data, we recalculated the PM rates (and domain scores) by excluding patients with these possible exceptions from the PMs, and re-ran the treatment initiation models. Last, we changed the specifications of several PMs to determine if the alternative definitions would impact our results. These included removing patients with cirrhosis from the liver biopsy PM, reconstructing the depression PM to include only patients who developed depression while on antiviral treatment, extending the time frame for human immunodeficiency virus testing PM, and restricting the time frame for confirmation of HCV viremia PM.
Results
Demographics and Clinical Characteristics
We identified 34,749 patients who were eligible for inclusion in the study cohort (Table 1). Their mean age was 52.9 years (standard deviation, 9.1 y); 97% were male, 49% were white, and 26% were African Americans. Most of the patients had 3 or more visits to the VA per quarter. Approximately half of the patients had HCV genotype 1, 13% had HCV genotypes 2 or 3, and most of the remaining patients did not receive an HCV genotype test. Twelve percent had cirrhosis and 25.9% had depression. Each patient was, on average, eligible for 4.8 pretreatment, 2.7 treatment, and 5.2 prevention or comorbid condition care measures. Of the patients analyzed, 6224 received antiviral treatment. Of the patients who started antiviral treatment, 49% completed treatment and 32% had SVR.
Table 1.
Characteristics of 34,749 Patients With Chronic HCV Infection Who Were Eligible for at Least One Process-of-Care Measure
| Variables | Distribution, % (n) |
|---|---|
| Demographics | |
| Age, y | |
| <45 | 13.6 (4715) |
| 46–55 | 61.1 (21,223) |
| 56–65 | 20.2 (7024) |
| >65 | 5.1 (1787) |
| Male | 96.6 (33,579) |
| Race | |
| White | 49.2 (17,085) |
| African American | 26.1 (9060) |
| Other race | 1.3 (347) |
| Unknown | 23.45 (8150) |
| Health care use | |
| Visits per quarter | |
| <3 | 44.1 (15,334) |
| ≥3 | 55.9 (19,415) |
| Follow-up period, y (mean, SD) | 3.6 (0.9) |
| Clinical characteristics, % | |
| HCV genotype | |
| 1 or 4 | 51.1 (17,746) |
| 2 or 3 | 13.4 (4646) |
| Unknown | 35.6 (12,357) |
| Cirrhosisa | 12.4 (4308) |
| Depressionb | 25.9 (8991) |
| Drug or alcohol use | 51.48 (17,890) |
| Comorbidityc | 15.7 (5449) |
| Number of PMs for which patients were eligible, mean (SD) | |
| Pretreatment care | 4.8 (2.2) |
| Treatment-related care (if received treatment) | 2.7 (1.2) |
| Prevention-related care | 5.2 (1.2) |
We defined cirrhosis based on the presence of cirrhosis-related International Classification of Diseases, 9th revision (ICD-9) codes (571.2, 571.5) within 1 year of the HCV index date.
Depression was defined on the basis of ICD-9 revision codes for depression (296.2, 296.3, 300.4, 311) within 1 year of the HCV index date. Drug and alcohol use defined on the basis of ICD-9 codes (291.xx, 292.xx, 304.xx, 305.0x, 305.2–305.9, 648.3x, 655.5x, 760.71–760.73, 760.75, 779.5x, 965.0x, 980.0x, V65.42, and 303.xx). In addition, we looked for laboratory evidence of illicit drug use and alcohol use based on blood levels for these agents.
Comorbidity was defined as any of the following: severe hypertension, heart failure, coronary artery disease, poorly controlled diabetes, severe chronic obstructive pulmonary disease, or chronic renal disease.
Overall, 11% (n = 3905) of patients received all indicated pretreatment care and 8% (n = 2798) received all indicated preventive/comorbid condition care. Among those who received antiviral treatment, 37% (n = 2309) received all indicated treatment monitoring care.
Hepatitis C Virus Treatment End Points When Receiving Recommended Care vs Not Receiving Recommended Care by Individual Process Measures
For all the measures in the pretreatment and preventive/comorbid care domains, patients who received recommended care were more likely to initiate treatment, complete treatment, and achieve SVR, although some of these differences were not statistically significant (Table 2). Specifically, patients who met the HCV genotype testing and liver biopsy for genotype 1 HCV measures had higher rates of treatment initiation (30.5% vs 8.6% and 46.3% vs 20%, respectively), treatment completion (49.5% vs 36.9% and 43.8% vs 32.4%, respectively), and SVR (48.4% vs 32.4% and 46% vs 37.2%, respectively) than those who did not meet these measures. Patients meeting the measure of seeing the HCV specialists were more likely to initiate treatment (27% vs 7.8%), and, once started, were more likely to complete treatment (49.8% vs 44.1%) than those who did not. However, there were a few exceptions. Patients who received recommended care for substance use disorders had slightly lower rates of antiviral treatment initiation (13.5% vs 15.2%) and completion (42.0% vs 47.7%) than those who did not. Patients who had the recommended ribavirin dose reduction (to manage treatment-induced anemia) were significantly less likely to complete treatment (52.6% vs 62.3%) and achieve SVR (42.6% vs 54.6%) than those who did not have their ribavirin dose reduced.
Table 2.
HCV Treatment End Points When Receiving Recommended Care vs Not Receiving Recommended Care by Individual PMs
| Process measures | Treatment receipt
|
Treatment completion
|
SVR
|
||||||
|---|---|---|---|---|---|---|---|---|---|
| Eligible patients, n | Treatment initiation if received recommended care, % | Treatment initiation if did not receive recommended care, % | Eligible patients, n | Treatment completion if received recommended care, % | Treatment completion if did not receive recommended care, % | Eligible patients, n | SVR if received recommended care, % | SVR if did not receive recommended care, % | |
| Pretreatment care | |||||||||
| Confirmation of HCV viremia | 31,193 | 17.7 | 9.7 | 4856 | 49.3 | 38.4 | 1443 | 48.5 | 48.9 |
| Specialty evaluation | 34,212 | 27 | 7.8 | 5546 | 49.8 | 44.1 | 1669 | 48.8 | 44.7 |
| Hepatitis B testing | 22,022 | 25.2 | 22.5 | 4930 | 48.8 | 47.7 | 1498 | 48 | 46.6 |
| Autoimmune liver disease testing | 22,022 | 31.4 | 17.4 | 4930 | 49.1 | 47.9 | 1498 | 50.6 | 41.2 |
| Iron overload testing | 22,022 | 28.6 | 15.9 | 4930 | 49.6 | 44.4 | 1498 | 48.3 | 45.5 |
| HCV genotype testing | 21,640 | 30.5 | 8.6 | 4902 | 49.5 | 36.9 | 1492 | 48.4 | 32.4 |
| Liver biopsy in genotype 1 | 13,268 | 46.3 | 20 | 3296 | 43.8 | 40.1 | 884 | 46 | 37.2 |
| Optimum care | 34,749 | 44.6 | 14.5 | 6224 | 57.4 | 46.2 | 1971 | 57.6 | 43.3 |
| Preventive and comorbid condition care | |||||||||
| HIV testing | 34,265 | 22.2 | 16.4 | 5513 | 46.3 | 50 | 1667 | 50.7 | 47.1 |
| Hepatitis A serology testing | 32,881 | 20.4 | 12.8 | 5273 | 49 | 46.9 | 1571 | 49.3 | 44.4 |
| Hepatitis B serology testing | 31,257 | 19.4 | 11.6 | 5020 | 49 | 44.7 | 1485 | 48.6 | 45.7 |
| Hepatitis A vaccination | 26,171 | 27.8 | 13.7 | 4033 | 53.6 | 46.4 | 1228 | 53 | 45.8 |
| Hepatitis B vaccination | 22,863 | 27.2 | 13.3 | 3566 | 52.9 | 45.9 | 1092 | 53.4 | 47.4 |
| Depression care | 13,326 | 20.8 | 21.4 | 2514 | 48.6 | 48.4 | 782 | 52.7 | 45.6 |
| Substance use care | 18,637 | 13.5 | 15.2 | 2479 | 42 | 47.7 | 688 | 51.2 | 46.7 |
| Optimum care | 34,749 | 27.6 | 17.1 | 6224 | 48.5 | 49.5 | 1971 | 48.5 | 48.1 |
| Treatment-related care | |||||||||
| RNA testing before treatment | — | — | — | 5559 | 50.4 | 44.5 | 1674 | 48.2 | 48.7 |
| RNA testing at week 12 | — | — | — | 4363 | 62.6 | 61.2 | 1676 | 50.5 | 44.8 |
| RNA testing at week 24 | — | — | — | — | — | — | 1493 | 48.5 | 45.6 |
| RNA testing at week 48 | — | — | — | — | — | — | 695 | 40.7 | 35 |
| Decreasing ribavirin if anemia | — | — | — | 842 | 52.6 | 62.3 | 321 | 42.6 | 54.6 |
| No growth factors if low neutrophils | — | — | — | 503 | 57.8 | 64.3 | 187 | 50.4 | 46.8 |
| Optimum care | — | — | — | — | — | — | 1971 | 49.2 | 47.7 |
NOTE. Bolded values indicate statistical significance at an α value of .05. RNA testing at weeks 24 and 48 was not applicable for treatment completion because these time points correlated with the cut-off values that we used to ascertain treatment completion.
HIV, human immunodeficiency virus; NA, not applicable.
Table 2 also displays the bivariate associations between domain-specific aggregate score and each of the study end points.
Association Between Process of Hepatitis C Virus Care and Antiviral Treatment Receipt
Patients with optimum pretreatment care had 3.2-fold higher odds of receiving antiviral treatment than those with suboptimum pretreatment care (Figure 1). Independent of pretreatment care, patients receiving optimum preventive and comorbid conditions care had significantly higher (+ 36%) antiviral treatment rates than patients with suboptimum care.
Figure 1.
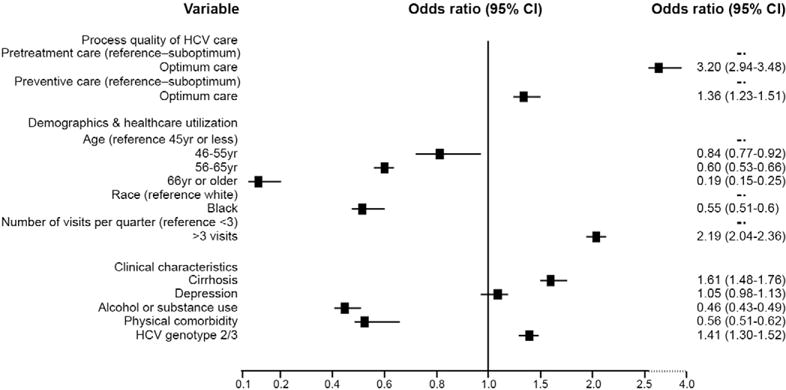
Association of process of HCV care with antiviral treatment receipt: results of multivariable analyses.
Sensitivity analyses with restricting the sample to patients without treatment exclusions did not change the direction or magnitude of association between treatment initiation and pretreatment care (OR, 2.88; 95% CI, 2.57–3.24) or preventive/comorbid care (OR, 1.42; 95% CI, 1.21–1.65), respectively. Similarly, use of PM data derived from medical chart reviews did not change the direction of the effect (OR for pretreatment care and preventive/comorbid care were 1.84 and 2.38, respectively), although the estimates were not statistically significant because of power limitations in this analysis (Supplementary Table 2).
Association Between Process of Hepatitis C Virus Care and Antiviral Treatment Completion
Among all treated patients, we found a significant association between pretreatment care and antiviral treatment completion. The odds of completing treatment were 26% higher in patients who received optimum care pretreatment than those who did not (Figure 2). Optimum preventive and comorbid care was not associated with treatment completion.
Figure 2.
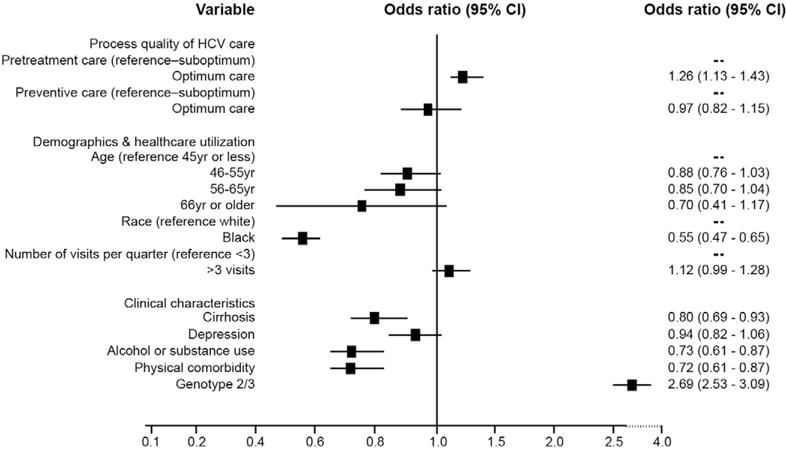
Association of process of HCV care with treatment completion: results of multivariable analyses. This analysis was limited to patients who started antiviral treatment. Treatment start date had to be before July 2005 to allow adequate follow-up evaluation for all patients.
Association Between Process of Hepatitis C Virus Care and Sustained Virologic Response
Patients with optimum pretreatment care had higher odds of achieving SVR than those with suboptimum pretreatment care (OR, 1.30; 95% CI, 1.01–1.66) (Figure 3). Preventive and comorbid conditions care was not associated with SVR in patients who received and completed antiviral treatment. There was also no difference in the SVR between patients receiving optimum vs suboptimum monitoring during treatment. However, given the known strong positive association between ribavirin dose and SVR,32,33 we removed the ribavirin dose reduction measure from the treatment monitoring domain and reconstructed the models predicting SVR. With this, the odds of achieving SVR were 22% higher for patients who received optimum treatment monitoring care than those who did not (OR, 1.22; 95% CI, 0.95–1.56), although the estimate was not statistically significant.
Figure 3.
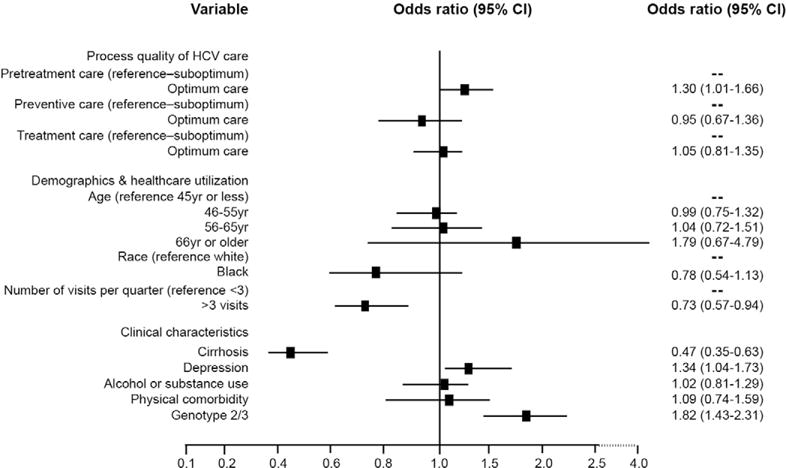
Association of process of HCV care with SVR: results of multivariable analyses. This analysis was limited to patients who completed antiviral treatment.
Changing the specification of the PMs did not change the results (data not shown).
Discussion
We found that better performance on the HCV process-of-care measures was associated with what patients with HCV and their providers care about most: the receipt of potentially curative antiviral treatment and its outcomes. This relationship was most pronounced for the care processes that occurred before antiviral treatment, such as those related to the diagnosis and evaluation of HCV. Specifically, we found that the odds of starting antiviral treatment were 3-fold higher for patients who received optimum pretreatment (ie, diagnosis and evaluation-related) care than those who received suboptimum care. Moreover, among patients who initiated antiviral treatment, the process of care that they received before their treatment strongly predicted completion of the assigned treatment course as well as subsequent SVR. Although we also found a trend toward higher SVR in patients who received better treatment monitoring care, this did not reach statistical significance, suggesting that most of the effect of HCV care process on SVR may indeed be mediated through receipt of, and, when initiated, the completion of, antiviral treatment.
The evidence supporting many PMs included in this analysis, combined with the moderately strong association that we found, and the temporal relationship between the evaluated care and subsequent treatment and outcomes, collectively suggest that we have identified important links in the chain that leads to better HCV outcomes. Some of the PMs—particularly those in the pretreatment care group—may begin a pathway to processes that then improve treatment rates (such as the effect of specialty evaluation on antiviral treatment). Others may not lead directly to treatment outcomes but may be markers of comprehensive medical care or more compliant patients, which in turn is related to better outcomes. This would explain the positive association between comorbid and preventive care and receipt of antiviral treatment. Similarly, this would explain the persistent effect of process of care that patients received before starting treatment on treatment completion and SVR (Figures 2 and 3).
The relationship between individual measures and our study end points sheds light on the underlying mechanisms of the process-outcome link in HCV (Table 2). With few exceptions, we found consistently positive associations between all measures and treatment end points, although some of these associations were stronger than others. Given this strong effect, we considered the possibility of confounding by indication, such as providers’ perceptions of treatment eligibility and patients’ preference for treatment. For example, it is plausible that patients who received a genotype test or those who underwent a liver biopsy did so because they were good candidates for antiviral treatment or because they had strong preference for treatment. Providers’ assessments of patient-specific risk/benefit ratio and patients’ preferences are not documented in the database, and therefore, we could not account for these in this study. In our previous study, we found that a significant proportion of patients had possible exceptions (due to comorbidity, patient refusal, etc) to several measures, which might result in an underestimation of these measures. To address this, we performed 2 separate sensitivity analyses to define more narrowly circumstances of care by excluding patients with potential treatment contraindications and then by limiting the analysis to our chart review subsample with chart-documented data on patient-specific risks and preferences for treatment. The positive association between meeting the PMs and treatment end points remained in these highly selected groups of patients, providing further support to the observed process-outcome link in HCV. Collectively, our data lend support to the validity of the initiatives that motivate quality measurement using these process-based measures for patients with HCV.34
The implications of our data are important to the present and future of HCV management. Two new DAA agents have become available and, when given in combination with pegylated interferon and ribavirin, significantly increase the cure rates in HCV patients in randomized clinical trials.9,10 However, the effectiveness of DAA likely will be offset by new challenges in real-world practice. Advanced physical and mental comorbidity continue to contraindicate the use of DAA. Once treatment is started, there is a greater risk of viral resistance and significantly more frequent and more severe adverse events than combination interferon and ribavirin therapy. Given the independent association between HCV PMs and treatment end points, our data suggest that efforts targeted at improving HCV care—particularly the care delivered before antiviral treatment— might be a way to fulfill the promise of these new agents as they become widely disseminated in routine clinical practice. We also found that after accounting for the pretreatment care, patients with cirrhosis and genotype 2 or 3 HCV infection were more likely to receive treatment. Similarly, as expected, we found that genotype 2/3 infection was the strongest predictor of completion of treatment, likely because of the shorter duration of treatment and the higher rate of response. These data show that factors other than the process of HCV care (such as expected duration of treatment, side effects of medications, and predicted likelihood of response) are important and will likely remain so in deciding who will be treated in the era of DAAs.
Our study had several limitations. Despite being comprehensive, the HCV PM set did not capture all aspects of HCV care. Some examples include counseling regarding alcohol use and care targeting patients with post-traumatic stress disorder and anxiety. Nonetheless, we believe that the measure set addresses critical areas of care in HCV and emulate those targeted by contemporary practice guidelines. Moreover, we could not ascertain patients’ and physicians’ knowledge, attitudes, and perceptions regarding antiviral treatment—data that would need qualitative evaluations. Our cohort included only HCV patients who used the VA, thus potentially limiting the applicability of our results to other systems of care. However, similar reported results for common PMs in other systems13 speak to greater generalizability. It is plausible that the processes of HCV care might have improved significantly since 2006 and these may change further with the introduction of new drugs. However, the association between optimum care and improved outcomes remains relevant. Some of our findings may appear counterintuitive. Patients with treatment-induced anemia who had their ribavirin dose reduced were less likely to achieve SVR than those who did not. Given that dose reductions in ribavirin may affect treatment efficacy, the observed association between ribavirin dose reduction PM and treatment end points is biologically plausible.32,33 Future applications, therefore, might exclude this measure from the HCV set. Patients who received the recommended substance use treatment were less likely to start and complete antiviral treatment than those who did not. Patients who met this measure (ie, referred to specialty mental health) might have more significant problems with substance use, whereas those with milder substance abuse might have been capable of achieving remission without substance abuse referral.
Our data show that when patients receive the recommended HCV care, they get treated and have better responses more often. An important next step is to evaluate whether interventions can be implemented that improve the delivery of these care processes to patients with HCV and whether these improvements lead, as our results suggest, to improvements in outcomes in HCV. Our data also suggest that efforts targeted at improving HCV process quality may be a way to fulfill the promise of the new DAA agents as they become widely disseminated in routine clinical practice.
Supplementary Material
Acknowledgments
The authors are indebted to the Hepatitis C Clinical Case Registry for the data used in this study. Research was performed in part at the St Louis VA Medical Center and St Louis University School of Medicine.
The opinions and assertions contained herein are the sole views of the authors and are not to be construed as official or as reflecting the views of the Department of Veteran Affairs.
Funding
This material is based on work supported by the Health Services Research and Development Service, Office of Research and Development, Department of Veterans Affairs, grant IIR-07-111 (F.K.).
Abbreviations used
- CI
confidence interval
- DAA
directacting antiviral
- HCV
hepatitis C virus
- OR
odds ratio
- PM
process measures
- SVR
sustained virologic response
- VA
Veteran’s Affairs
Footnotes
Supplementary Material
Note: To access the supplementary material accompanying this article, visit the online version of Clinical Gastroenterology and Hepatology at www.cghjournal.org, and at http://dx.doi.org/10.1016/j.cgh.2012.07.015.
Conflicts of interest
The authors disclose no conflicts.
References
- 1.Armstrong GL, Wasley A, Simard EP, et al. The prevalence of hepatitis C virus infection in the United States, 1999 through 2002. Ann Intern Med. 2006;144:705–714. doi: 10.7326/0003-4819-144-10-200605160-00004. [DOI] [PubMed] [Google Scholar]
- 2.Kim WR, Brown RS, Jr, Terrault NA, et al. Burden of liver disease in the United States: summary of a workshop. Hepatology. 2002;36:227–242. doi: 10.1053/jhep.2002.34734. [DOI] [PubMed] [Google Scholar]
- 3.Poynard T, Marcellin P, Lee SS, et al. Randomised trial of interferon alpha2b plus ribavirin for 48 weeks or for 24 weeks versus interferon alpha2b plus placebo for 48 weeks for treatment of chronic infection with hepatitis C virus. International Hepatitis Interventional Therapy Group (IHIT) Lancet. 1998;352:1426–1432. doi: 10.1016/s0140-6736(98)07124-4. [DOI] [PubMed] [Google Scholar]
- 4.Davis GL, Esteban-Mur R, Rustgi V, et al. Interferon alfa-2b alone or in combination with ribavirin for the treatment of relapse of chronic hepatitis C. International Hepatitis Interventional Therapy Group. N Engl J Med. 1998;339:1493–1499. doi: 10.1056/NEJM199811193392102. [DOI] [PubMed] [Google Scholar]
- 5.Fried MW, Shiffman ML, Reddy KR, et al. Peginterferon alfa-2a plus ribavirin for chronic hepatitis C virus infection. N Engl J Med. 2002;347:975–982. doi: 10.1056/NEJMoa020047. [DOI] [PubMed] [Google Scholar]
- 6.Manns MP, McHutchison JG, Gordon SC, et al. Peginterferon alfa-2b plus ribavirin compared with interferon alfa-2b plus ribavirin for initial treatment of chronic hepatitis C: a randomised trial. Lancet. 2001;358:958–965. doi: 10.1016/s0140-6736(01)06102-5. [DOI] [PubMed] [Google Scholar]
- 7.Hadziyannis SJ, Sette H, Jr, Morgan TR, et al. Peginterferon-alpha2a and ribavirin combination therapy in chronic hepatitis C: a randomized study of treatment duration and ribavirin dose. Ann Intern Med. 2004;140:346–355. doi: 10.7326/0003-4819-140-5-200403020-00010. [DOI] [PubMed] [Google Scholar]
- 8.Poynard T, McHutchison J, Manns M, et al. Impact of pegylated interferon alfa-2b and ribavirin on liver fibrosis in patients with chronic hepatitis C. Gastroenterology. 2002;122:1303–1313. doi: 10.1053/gast.2002.33023. [DOI] [PubMed] [Google Scholar]
- 9.Jacobson IM, McHutchison JG, Dusheiko G, et al. ADVANCE study team Telaprevir for previously untreated chronic hepatitis C virus infection. N Engl J Med. 2011;364:2405–2416. doi: 10.1056/NEJMoa1012912. [DOI] [PubMed] [Google Scholar]
- 10.Poordad F, McCone J, Jr, Bacon BR, et al. SPRINT-2 investigators Boceprevir for untreated chronic HCV genotype 1 infection. N Engl J Med. 2011;364:1195–1206. doi: 10.1056/NEJMoa1010494. [DOI] [PMC free article] [PubMed] [Google Scholar]
- 11.Ghany MG, Strader DB, Thomas DL, et al. American Association for the Study of Liver Diseases Diagnosis, management, and treatment of hepatitis C: an update. Hepatology. 2009;49:1335–1374. doi: 10.1002/hep.22759. [DOI] [PMC free article] [PubMed] [Google Scholar]
- 12.Seeff LB, Hoofnagle JH. National Institutes of Health Consensus Development Conference: management of hepatitis C: 2002. Hepatology. 2002;36(Suppl 1):S1–S2. doi: 10.1053/jhep.2002.36992. [DOI] [PubMed] [Google Scholar]
- 13.Kanwal F, Schnitzler MS, Bacon BR, et al. Quality of care in patients with chronic hepatitis C virus infection: a cohort study. Ann Intern Med. 2010;153:231–239. doi: 10.7326/0003-4819-153-4-201008170-00005. [DOI] [PubMed] [Google Scholar]
- 14.Kramer JR, Hachem CY, Kanwal F, et al. Meeting vaccination quality measures for hepatitis A and B virus in patients with chronic hepatitis C infection. Hepatology. 2011;53:42–52. doi: 10.1002/hep.24024. [DOI] [PubMed] [Google Scholar]
- 15.Butt AA, Justice AC, Skanderson M, et al. Rate and predictors of treatment prescription for hepatitis C. Gut. 2007;56:385–389. doi: 10.1136/gut.2006.099150. [DOI] [PMC free article] [PubMed] [Google Scholar]
- 16.McGlynn EA, Asch SM. Developing a clinical performance measure. Am J Prev Med. 1998;14(Suppl):14–21. doi: 10.1016/s0749-3797(97)00032-9. [DOI] [PubMed] [Google Scholar]
- 17.Brook RH, McGlynn EA, Cleary PD. Quality of health care. part 2: measuring quality of care. N Engl J Med. 1996;335:966–970. doi: 10.1056/NEJM199609263351311. [DOI] [PubMed] [Google Scholar]
- 18.Asch SM, McGlynn EA, Hiatt L, et al. Quality of care for hypertension in the United States. BMC Cardiovasc Disord. 2005;5:1. doi: 10.1186/1471-2261-5-1. [DOI] [PMC free article] [PubMed] [Google Scholar]
- 19.Higashi T, Shekelle PG, Adams JL, et al. Quality of care is associated with survival in vulnerable older patients. Ann Intern Med. 2005;143:274–281. doi: 10.7326/0003-4819-143-4-200508160-00008. [DOI] [PubMed] [Google Scholar]
- 20.Fitch K, Bernstein SJ, Aguilar MS. The RAND/UCLA appropriateness method user’s manual. California: RAND; 2001. [Google Scholar]
- 21.McGory ML, Kao KK, Shekelle PG, et al. Developing quality indicators for elderly surgical patients. Ann Surg. 2009;250:338–347. doi: 10.1097/SLA.0b013e3181ae575a. [DOI] [PubMed] [Google Scholar]
- 22.Maggard MA, McGory ML, Shekelle PG, et al. Quality indicators in bariatric surgery: improving quality of care. Surg Obes Relat Dis. 2006;2:423–429. doi: 10.1016/j.soard.2006.05.005. [DOI] [PubMed] [Google Scholar]
- 23.Shekelle PG, MacLean CH, Morton SC, et al. Acove quality indicators. Ann Intern Med. 2001;135:653–667. doi: 10.7326/0003-4819-135-8_part_2-200110161-00004. [DOI] [PubMed] [Google Scholar]
- 24.MacLean CH, Louie R, Leake B, et al. Quality of care for patients with rheumatoid arthritis. JAMA. 2000;284:984–992. doi: 10.1001/jama.284.8.984. [DOI] [PubMed] [Google Scholar]
- 25.Shekelle PG, Chassin MR, Park RE. Assessing the predictive validity of the RAND/UCLA appropriateness method criteria for performing carotid endarterectomy. Int J Technol Assess Health Care. 1998;14:707–727. doi: 10.1017/s0266462300012022. [DOI] [PubMed] [Google Scholar]
- 26.Kanwal F, Hoang T, Kramer J, et al. Performance of process quality measures in hepatitis C. Am J Gastroenterol. 2012 doi: 10.1038/ajg.2012.201. Epub ahead of print. [DOI] [PubMed] [Google Scholar]
- 27.Backus LI, Gavrilov S, Loomis TP, et al. Clinical case registries: simultaneous local and national disease registries for population quality management. J Am Med Inform Assoc. 2009;16:775–783. doi: 10.1197/jamia.M3203. [DOI] [PMC free article] [PubMed] [Google Scholar]
- 28.Backus LI, Boothroyd DB, Phillips BR, et al. Predictors of response of US veterans to treatment for the hepatitis C virus. Hepatology. 2007;46:37–47. doi: 10.1002/hep.21662. [DOI] [PubMed] [Google Scholar]
- 29.Beste LA, Ioannou GN, Larson MS, et al. Predictors of early treatment discontinuation among patients with genotype 1 hepatitis C and implications for viral eradication. Clin Gastroenterol Hepatol. 2010;8:972–978. doi: 10.1016/j.cgh.2010.07.012. [DOI] [PubMed] [Google Scholar]
- 30.Kanwal F, Hoang T, Spiegel BM, et al. Predictors of treatment in patients with chronic hepatitis C infection—role of patient versus nonpatient factors. Hepatology. 2007;46:1741–1749. doi: 10.1002/hep.21927. [DOI] [PubMed] [Google Scholar]
- 31.Strader DB, Wright T, Thomas DL, et al. Diagnosis, management, and treatment of hepatitis C. Hepatology. 2004;39:1147–1171. doi: 10.1002/hep.20119. [DOI] [PubMed] [Google Scholar]
- 32.McHutchison JG, Manns M, Patel K, et al. Adherence to combination therapy enhances sustained response in genotype-1-infected patients with chronic hepatitis C. Gastroenterology. 2002;123:1061–1069. doi: 10.1053/gast.2002.35950. [DOI] [PubMed] [Google Scholar]
- 33.Ferenci P, Fried MW, Shiffman ML, et al. Predicting sustained virological responses in chronic hepatitis C patients treated with peginterferon alfa-2a (40 kD)/ribavirin. J Hepatol. 2005;43:425–433. doi: 10.1016/j.jhep.2005.04.009. [DOI] [PubMed] [Google Scholar]
- 34.Centers for Medicare and Medicaid Services. Medicare Quality Measurement and Reporting Programs. Available: http://www.healthreformgps.org/resources/medicare-quality-measurement-and-reporting-programs/. Accessed: March 2012.
Associated Data
This section collects any data citations, data availability statements, or supplementary materials included in this article.