Figure 1.
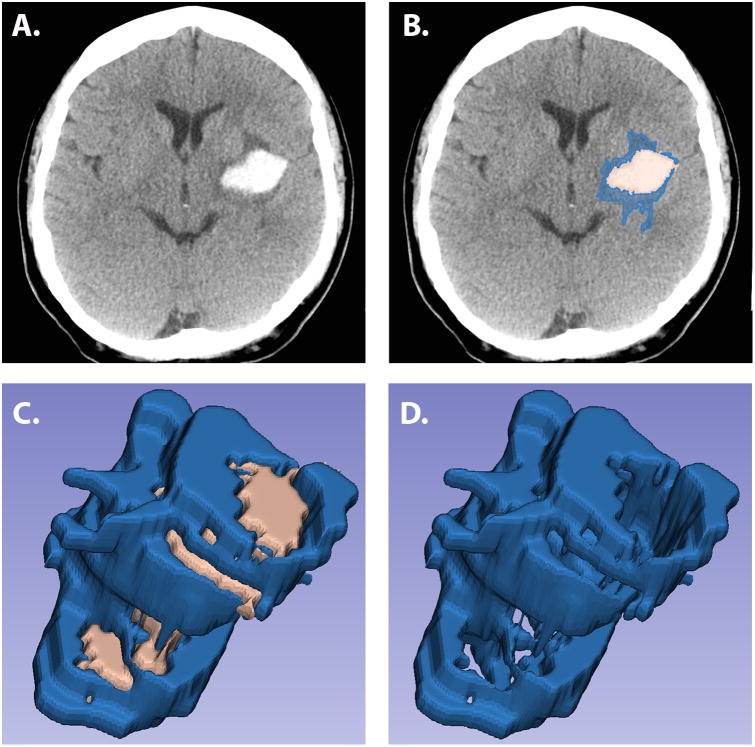
Non-contrast computed tomography scans showing a putaminal hemorrhage (Panel A) with demarcation of the differences in hypodensities (Panel B) and 3-dimensional reconstruction of hematoma and perihematomal volumes (Panel C) and 3-dimensional reconstruction of perihematomal edema only (Panel D).

