

Abstract
Introduction
To quantitatively estimate the impact of different methods for both boost volume delineation and respiratory motion compensation of [18F] FDG PET/CT images on the fidelity of planned non-uniform ‘dose painting’ plans to the prescribed boost dose distribution.
Methods
Six locally advanced non-small cell lung cancer (NSCLC) patients were retrospectively reviewed. To assess the impact of respiratory motion, time-averaged (3D AVG), respiratory phase-gated (4D GATED) and motion-encompassing (4D MIP) PET images were used. The boost volumes were defined using manual contour (MANUAL), fixed threshold (FIXED), and gradient search algorithm (GRADIENT). The dose painting prescription of 60 Gy base dose to the planning target volume and an integral dose of 14 Gy (total 74 Gy) was discretized into 7 treatment-planning substructures and linearly redistributed according to the relative SUV at every voxel in the boost volume. 54 dose painting plan combinations were generated and conformity was evaluated using quality index VQ0.95-1.05, which represents the sum of planned dose voxels within 5% deviation from the prescribed dose. Trends in plan quality and magnitude of achievable dose escalation achievable were recorded.
Results
Different segmentation techniques produced statistically significant variations in maximum planned dose (p<0.02), as well as plan quality between segmentation methods for 4D GATED and 4D MIP PET images (p<0.05). No statistically significant differences in plan quality and maximum dose were observed between motion-compensated PET based plans (p>0.75). Low variability in plan quality was observed for FIXED threshold plans, while MANUAL and GRADIENT plans achieved higher dose with lower plan quality indices.
Conclusions
The dose-painting plans were more sensitive to segmentation of boost volumes than PET motion compensation in this study sample. Careful consideration of boost target delineation and motion compensation strategies should guide the design of NSCLC dose painting trials.
Keywords: Dose painting, NSCLC, PET/CT, respiratory gating, segmentation
Background
An estimated 31% of the patients with locally advanced non-small cell lung cancer (NSCLC) present with loco-regional failure within 5 years after treatment1. The high rate of loco-regional failure is an indicator that standard dosing of 60-66 Gy may not be effective in all patients2,3. One approach to improve tumor local control while respecting normal tissue dose constraints is to boost the dose based on the intra-tumor heterogeneity, which reflects spatial variation in tumor biological characteristics that are correlated to radiation response, such as hypoxia, cell density, proliferation, and perfusion. Molecular images can serve as spatial maps of local tumor recurrence and progression risk, which can then be used to selectively re-distribute boost doses4. There have been ongoing clinical trials on functional image-guided dose escalation, so-called dose painting, but no accepted standards on the design of PET-based dose boosts to date5,6.
Accurate and precise planning and delivery of a dose boost is limited by several sources of uncertainty4. This study attempts to draw attention to two sources of uncertainty in PET-based dose painting of locally advanced NSCLC: namely 1) the segmentation method used to define the boost volume and 2) the respiratory-induced motion within the boost volume. Though PET/CT has been routinely used for defining the radiotherapy target for NSCLC, no consensus has been reached on a suitable method to delineate PET-based boost volumes7. Manual delineation, the most common practice, is highly sensitive to the image display and dependent on individual expertise8 and automatic segmentation methods, have yet to be translated clinically9. To assess the effect of segmentation on PET-based dose painting, we tested three types of segmentation methods to define the boost volume: clinician defined (MANUAL), fixed threshold (FIXED, simple automation), and gradient search (GRADIENT, complex automation)10.
Another consideration is the impact of respiratory motion-induced uncertainties. The effects of motion differ between PET and CT due to increased PET acquisition time at each field-of-view and higher sampling of the respiratory cycle11 and this incongruity can cause mis-registration of the lesion in the two imaging modalities leading to inaccurate attenuation correction of standardized uptake value (SUV)12. This mismatch is reported to be as high as 15 mm in lesions closer to the diaphragm and base of the lung13. Respiratory motion therefore can propagate errors in delineation of the gross tumor volume (GTV) during radiotherapy treatment planning14. To mitigate these errors, motion-encompassing techniques are employed that include slow CT, inhale and exhale breath-hold CT, and four- dimensional (4D) or respiration-correlated CT. The challenge remains that any motion compensation can also introduce residual errors of various magnitudes. For example, phase-matched attenuation correction must ensure similar respiratory motion patterns during PET and CT imaging to avoid phase-sorting artifacts15. Currently, there are no standards or guidelines for motion compensation strategies in lung cancer dose painting clinical trials. To assess the effect of respiratory motion on PET-based dose painting, we planned the boost dose on three different PET acquisitions: 3D time averaged PET (3D AVG), end-exhale respiratory gated 4D PET (4D GATED) and maximum intensity projection 4D PET (4D MIP).
The purpose of this sensitivity study was to quantitatively estimate the variation in FDG PET-based dose painting plan quality from different methods for both boost volume delineation and respiratory motion compensation, which can be used in part to inform on lung cancer dose painting trial designs.
Methods
NSCLC patients
Six patients who previously underwent treatment PET/CT examinations and radiotherapy treatment for locally advanced non-small cell lung cancer between August 2012 and March 2014 and had tumor stages between IIB –IIIB were identified. Although the observational study had a mix of histology and disease stages, we selected patients who had similar characteristics to those enrolled in RTOG 0617. The study was approved by the Institutional Review Board and in compliance with the Health Information Privacy and Portability Act.
PET/CT acquisition and reconstruction
The patients were scanned on a Discovery STE PET/CT scanner (GE Healthcare, Waukesha, WI) 60 minutes post injection of [18F] FDG (fluorodeoxyglucose). The whole body list mode data was retrieved for reconstruction, the free-breathing reconstructions were generated from time-averaged data (3D AVG), and represents the current standard of care for lung cancer treatment planning PET imaging. The 4D GATED images were generated from the end-exhale phase generated from the Real-time Position Management (RPM) (Varian Medical Systems, Palo Alto, CA) timestamps that sorted the data into 5 equal respiratory phases and represents a motion resolved image with improved contrast at the target boundaries. The 4D MIP images were generated from the maximum intensity projection across all 5 respiratory phases and represents a motion-encompassing image that improves target coverage at the expense of normal tissue irradiation during free-breathing delivery. Tumor motion amplitudes were derived (Table 1) as the geometric mean of sample measurements on 4D CT under free-breathing conditions and represent the bulk tumor motion, which may consist of tumor sub-regions with higher or lower motion amplitudes.
Table 1.
Tumor characteristics and dose to the normal structures.
| Patient no | Age (yrs) | Gender | Location | GTV (mL) | PTV (mL) | Tumor Motion Amplitude (cm) | Mean Lung Dose (Gy) | Lung V20 (%) | Max Cord (Gy) | Mean Heart (Gy) | Mean Esophagus (Gy) |
|---|---|---|---|---|---|---|---|---|---|---|---|
| 1 | 66 | M | LUL+MED | 79.8 | 374.5 | 0.52 | 6.9 6.5– 11.4) |
10 8–18) |
26.4 17.9– 36.6) |
1.0 0.9 – 6.8) |
19.4 18.4 – 24.7) |
| 2 | 72 | M | LLL | 8.9 | 44.7 | 0.27 | 4.9 4.8– 5.0) |
6 6–7) |
14.6 9.9– 16.5) |
4.4 4.0– 5.0) |
1.9 1.8 – 2.3) |
| 3 | 52 | F | LLL+MED | 158.8 | 525.6 | 0.75 | 17.1 17.0– 17.2) |
36 36–37) |
38.4 30.5– 42.8) |
9.7 9.2 – 9.9) |
18.9 16.9– 19.2) |
| 4 | 36 | F | RLL+MED | 156.7 | 553.7 | 0.84 | 17.6 17.5– 17.8) |
37 36–38) |
43.4 42.5 – 43.9) |
17.9 16.2– 19.5) |
40.0 39.6 –40.5) |
| 5 | 55 | M | RLL+MED | 252.8 | 795 | 0.51 | 16.8 16.4 –16.8) |
34 31 –35) |
47.4 46.9– 48.9) |
20.7 20.0– 21.3) |
36.2 35.5– 37.4) |
| 6 | 71 | M | RUL+MED | 253.5 | 689.9 | 0.28 | 17.8 17.5– 17.9) |
35 35–36) |
46.9 46.2 –47.5) |
17.4 16.5–18.6) |
38.2 36.7– 38.6) |
The normal dose for each organ is mentioned as median and the interquartile range in brackets. LUL- Left upper lobe, MED – Mediastinum, LLL- Left lower lobe, RLL- Right lower lobe, RUL – Right upper lobe
All PET images were attenuation, random and scatter corrected prior to reconstruction onto a 256×256 image matrix using ordered subset expectation maximization (OSEM) reconstruction algorithm with 28 subsets and 2 iterations. A 6 mm wide Gaussian filter was applied post reconstruction; the resultant images had voxel sizes of 2×2×3mm3.
PET/CT tumor segmentation
The impact of the method to delineate the boost volume on the achievable dose escalation in the treatment plans was investigated. The boost volumes only contained primary tumors and in the case where regional lymph nodes were in close proximity to the primary, the nodal volumes were only required to receive at least the minimum dose of 60 Gy but could have regions of higher dose without restriction. For each patient, the boost volumes were defined using the three different segmentation techniques: clinician defined manual gross tumor volume / gross internal target volume (MANUAL), gradient search algorithm (GRADIENT) and fixed threshold (FIXED) segmentation techniques. The clinician-defined MANUAL boost target volume was contoured to include the gross disease as seen on the 3D whole body PET as well as the planning 4D CT per standard lung cancer treatment planning procedures. The GRADIENT boost volume was defined in MIM 6™ (MIM Software Inc., Cleveland, OH) as the PET uptake in the tumor based on changes in standardized uptake at the tumor border22, 33. The method is operator-dependent to provide a starting point and the methodology is described by Maria Werner-Wasik et al16. To account for operator dependence with the MIM-based gradient search method, five independent realizations of the tumor segmentation were performed and the contour with median volume was finally chosen. The FIXED boost volume was defined by a threshold of 40 percent of the maximum tumor uptake. The boost volumes were all contained within the physician-defined PTV using a fixed margin of 5 mm for setup uncertainty, which was independent of the motion management strategies. The MANUAL clinician-defined boost volumes were transferred from the planning CT to the 3D AVG, 4D GATED and 4D MIP PET images for evaluation.
In all, 9 dose painting plans were generated for each patient (combination of 3 boost volumes × 3 PET images) (Figure 1). The 3D AVG PET/CT was used to generate free-breathing boost plans, the 4D GATED PET/CT was used to generate gated boost plans, and the 4D MIP PET/CT was used to generate motion-encompassing boost plans. Each planning scenario involved dose calculation of the PET-based boost on the appropriate planning CT: phase-averaged cine (4D) CT for free breathing and motion-encompassing PET boosts, and phase-gated 4D CT at end-exhale for gated PET boosts. In all scenarios, a PTV was used to maintain coverage of 60 Gy, which mitigated risk of geographic miss around the boost volumes.
Figure 1.
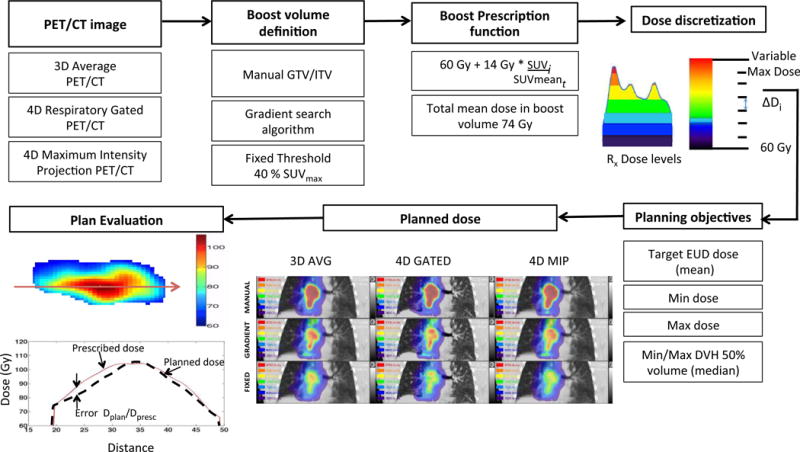
Schematic diagram showing the proposed workflow for inhomogenous dose painting.
Dose painting prescription
The physician defined planning target volume (PTV) remained unchanged and received the standard-of-care dose of 60 Gy in all planning scenarios. The additional boost doses were all planned above the PTV base dose. The boost volume prescriptions consisted of differential dose based on the relative SUV for every combination of motion compensation (3D AVG, 4D GATED, 4D MIP) and target delineation (MANUAL, GRADIENT, FIXED) technique listed in Figure 1. The boost volume dose was defined at every voxel from a linear prescription function. Based on the dose escalation protocols for NSCLC following RTOG 0117 and its phase 3 follow-up RTOG 0617, the mean boost target dose was maintained at 74 Gy17. The prescription function included a base dose of 60 Gy to the PTV supplemented with an integral dose boost of 14 Gy to the boost volume, which was redistributed over each voxel by its magnitude of tracer uptake relative to the mean boost volume uptake. The voxel prescription was constructed using the following function:
where, Di is the total dose redistributed based on the tracer retention at each voxel in the boost volume chosen. The SUVi is used to quantify the tracer uptake at each voxel and SUVmeant represents the average PET uptake in the boost volume.
Since commercial planning systems restrict optimization objectives to structures, the non-uniform voxel-based prescription was converted into a structure-based prescription. The dose in the boost volume was binned into 7 equally spaced substructures using automatic thresholds. Each boost volume with its set of dose level substructures were defined in MIM and exported to the RayStation™ treatment planning system (RaySearch, Stockholm, Sweden). The workflow for binning the dose into substructures and integrating non-uniform dose painting objectives into treatment planning system has been described in detail in prior work18 and is briefly illustrated in Figure 1.
Treatment planning
The planning target volume coverage remained constant at (V60Gy > 95%) in all scenarios and only the boost target dose objectives were defined for each substructure so as to reproduce the voxel-based prescription function. The dose prescription summary statistics in individual substructures were used to define the treatment planning objectives, including mean dose, median dose (D50%) and the minimum and maximum dose, shown schematically in Figure 1. The treatment plan was optimized for volumetric modulated arc therapy (VMAT) delivery with an Elekta Infinity™ (Elekta Inc., Stockholm, Sweden) linear accelerator and Agility™ (Elekta Inc., Stockholm, Sweden) multi-leaf collimator. Collimator angles were set to minimize inter-leaf leakage and oriented with leaf travel direction perpendicular to the longest axis of the boost volume. Leaf travel relative to gantry travel was restricted to 0.9 cm/degree. Angular spacing of 4 degrees was fixed for the optimization. The primary normal tissue objective was a mean lung dose < 20 Gy, along with secondary normal tissue objectives for lung (V20Gy < 35%), spinal cord (max dose < 50 Gy), esophagus (max dose < 66 Gy), and heart (mean dose < 35 Gy), in accordance with RTOG protocols. No dose constraints were placed on unspecified mediastinal tissues outside the PTV and boost target volumes, besides standard VMAT planning ring structures to control dose falloff.
Dose painting plan evaluation
The metric to evaluate the quality of the treatment plans was calculated as the ratio of the planned versus the prescribed dose for the voxel in question (Q (i) = Dplan/Dpresc). A cumulative histogram of the quality indices for the whole target volume was obtained as the quality volume histogram (QVH) and was used to evaluate the overall quality of the generated treatment plan19. The ideal QVH would result in all quality indices equal to 1. The overall conformity of the treatment plan was determined using a quality index VQ0.95-1.05 as described in previous studies by Deveau et al18. The VQ0.95-1.05 is a single value that represents the percentage of all voxels within the boost volume that had less than 5% deviation between the planned and prescribed dose. The root mean squared error Qrms, as defined by Håkansson et al20 is the statistical deviation between the planned and prescribed dose.
Statistical analysis
The difference in the plan quality indices Qrms and VQ0.95-1.05 and the maximum planned dose between the motion compensated PET acquisitions and segmentation methods considered were compared using the non-parametric Friedman test, which evaluates the signed rank differences between the 3 groups of motion compensation and 3 groups of segmentation methods as paired data for each patient and p <0.05 was considered statistically significant. The OAR doses are reported as median and interquartile ranges across all planning scenarios in Table 1. The median and interquartile ranges were reported for each of the parameters in Table 2 and 3. The statistical analysis was performed using SPSS v.20.0 (IBM Corp., Armonk, NY, USA).
Table 2.
Descriptive statistics of dose painting metrics for varying motion compensated PET acquisitions and each segmentation method.
| Segmentation | Parameter | 3D AVG PET | 4D GATED PET | 4D MIP PET | Friedman p | |
|---|---|---|---|---|---|---|
| MANUAL | Qrms | Median | 3.57 | 3.52 | 3.47 | 0.51 |
| (%error) | IQR | 3.08 – 4.45 | 3.12 – 4.51 | 3.10 – 4.06 | ||
| VQ0.95-1.05 | Median | 84.96 | 80.29 | 85.22 | 0.12 | |
| (%vol) | IQR | 79.47 – 87.87 | 73.63 – 84.86 | 81.56 – 87.66 | ||
| Max Dose | Median | 106.55 | 111.09 | 108.98 | 0.51 | |
| (Gy) | IQR | 101.54 – 116.99 | 102.72 – 114.18 | 104.72 – 118.64 | ||
|
| ||||||
| GRADIENT | Qrms | Median | 3.28 | 3.48 | 2.95 | 0.17 |
| (%error) | IQR | 2.45 – 3.76 | 2.89 – 3.93 | 2.31 – 3.57 | ||
| VQ0.95-1.05 | Median | 87.63 | 89.87 | 94.35 | 0.11 | |
| (%vol) | IQR | 79.38 – 96.32 | 85.45 – 92.67 | 90.25 – 97.00 | ||
| Max Dose | Median | 98.25 | 100.7 | 91.34 | 0.61 | |
| (Gy) | IQR | 93.91 – 101.68 | 94.09 – 105.38 | 88.37 – 98.90 | ||
|
| ||||||
| FIXED | Qrms | Median | 2.29 | 2.28 | 2.28 | 1.00 |
| (%error) | IQR | 2.03 – 2.78 | 2.04 – 2.55 | 2.08 – 2.63 | ||
| VQ0.95-1.05 | Median | 97.37 | 97.15 | 97.78 | 0.61 | |
| (%vol) | IQR | 93.89 – 98.85 | 95.52 – 97.96 | 94.66 – 99.57 | ||
| Max Dose | Median | 84.22 | 85.10 | 84.67 | 0.22 | |
| (Gy) | IQR | 82.43 – 84.96 | 83.68 – 89.82 | 82.80 – 86.57 | ||
Table 3.
Descriptive statistics of dose painting metrics for varying segmentation methods and each motion compensated PET acquisition.
| Motion | Parameter | MANUAL | GRADIENT | FIXED | Friedman p | |
|---|---|---|---|---|---|---|
| 3D AVG PET | Qrms (%error) | Median | 3.56 | 3.28 | 2.29 | 0.02 |
| IQR | 3.08 – 4.45 | 2.45 – 3.76 | 2.03 – 2.78 | |||
| VQ0.95–1.05 (%vol) | Median | 83.62 | 87.62 | 97.37 | <0.01 | |
| IQR | 74.57 – 87.87 | 79.38 – 96.32 | 93.89 – 98.85 | |||
| Max Dose (Gy) | Median | 106.55 | 98.25 | 84.22 | <0.01 | |
| IQR | 101.54 – 113.79 | 93.91 – 101.68 | 82.43 – 84.96 | |||
| Boost Volume (ml) | Median | 157.57 | 93.02 | 42.08 | 0.002 | |
| IQR | 62.66–251.5 | 39.61–152.95 | 13.76–69.43 | |||
|
| ||||||
| 4D GATED PET | Qrms (%error) | Median | 3.52 | 3.09 | 2.28 | 0.02 |
| IQR | 3.12 – 4.51 | 2.72 – 3.50 | 2.04 – 3.45 | |||
| VQ0.95–1.05 (%vol) | Median | 83.37 | 89.87 | 97.15 | <0.01 | |
| IQR | 73.63 – 89.25 | 85.45 – 92.67 | 85.2 – 97.96 | |||
| Max Dose (Gy) | Median | 105.62 | 100.7 | 85.10 | <0.01 | |
| IQR | 99.21 – 114.18 | 94.09 – 105.38 | 83.68 – 89.82 | |||
| Boost Volume (ml) | Median | 157.57 | 95.26 | 39.86 | 0.003 | |
| IQR | 62.66–251.5 | 44.35–154.93 | 14.30–65.53 | |||
|
| ||||||
| 4D MIP PET | Qrms (%error) | Median | 3.47 | 2.95 | 2.28 | 0.03 |
| IQR | 3.10 – 4.06 | 2.31 – 3.57 | 2.08 – 2.63 | |||
| VQ0.95–1.05 (%vol) | Median | 84.17 | 94.35 | 97.78 | <0.01 | |
| IQR | 78.6 – 86.55 | 90.25 – 97.00 | 94.66 – 99.57 | |||
| Max Dose (Gy) | Median | 105.83 | 91.34 | 84.67 | <0.01 | |
| IQR | 100.09 – 113.62 | 88.37 – 98.9 | 82.8 – 86.57 | |||
| Boost Volume (ml) | Median | 157.57 | 93.02 | 42.08 | 0.002 | |
| IQR | 62.66–251.5 | 42.43–156.0 | 12.06–71.84 | |||
Results
For the 6 patients, the normal tissue objectives were met in all plan combinations (mean lung dose < 18 Gy, lung V20Gy < 35%, max cord dose < 50 Gy, mean heart dose < 20 Gy), with the exception of a single patient 3D AVG PET manual segmentation plan in which the mean lung dose matched the clinically approved plan (mean lung dose = 21 Gy).
The patient characteristics (age, gender and site) and the dose to the normal structures for each patient are shown in Table 1. The table also reports the GTV size, PTV size, and the motion amplitudes in each tumor.
Figure 2 shows that for a given motion-compensated technique the variability in dose distribution is noticeably high between the segmentation methods. The range of boost dose in MANUAL boost volumes is larger compared to GRADIENT and FIXED boost dose. The variation in the spatial distribution of dose across motion compensation techniques was also evident. In particular, 4D GATED PET produced dose distributions with steeper gradients to more focal FDG avid regions. However, variation due to motion compensation was substantially smaller than the variability of dose redistributed across different boost volume definitions. This trend was noticed in all patients.
Figure 2.
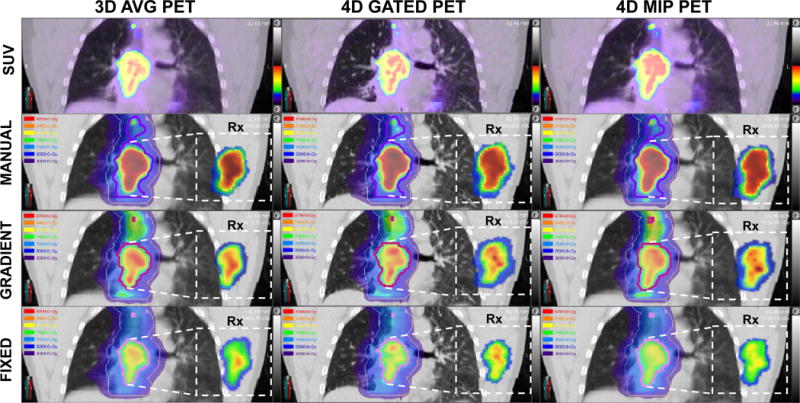
The 9 dose-painting plans for an example patient case. The top row shows the SUV images of motion-averaged (3D AVG) PET, motion-compensated (4D GATED) PET, and motion-encompassing (4D MIP) PET from which the plans were generated. The lower three rows display the dose distribution for the three segmentation methods (MANUAL, GRADIENT, FIXED) used to define the boost volume as a dose wash along with the corresponding dose painting prescription. SUV and dose colorscales display fixed ranges (0-20 SUV, 30-87 Gy) to facilitate visual comparison. The prescribed dose is shown in the inset boxes for the primary boost volume at the native PET resolution, while the corresponding planned dose is overlaid on the planning CT at an equivalent interpolated slice location. Note that the treatment plan includes a base dose to the PTV (khaki contour) as well as dose to FDG PET-avid nodes. Boost volumes for different segmentations methods are displayed as purple contours (MANUAL), magenta contours (GRADIENT), and pink contours (FIXED).
In Figure 3A, for the dose painting plans generated on the 3D AVG PET the plan QVH shows similar dose falloff for all segmentation methods. The median planned dose to the manual GTV boost volume is less than the intended prescribed dose (Dplan/Dpresc < 1). The plan quality deteriorated for the gradient search volume in 4D GATED PET (Figure 3B). There is improved plan quality when for the gradient search and fixed threshold based boost volumes in plans generated on 4D MIP PET (Figure 3C).
Figure 3.
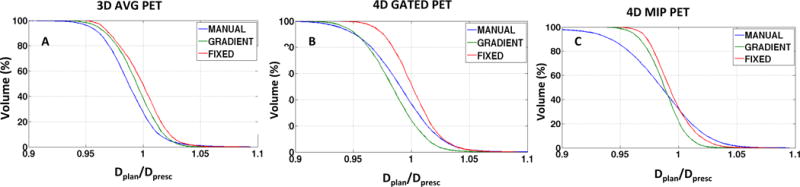
Quality volume histogram (QVH) plots for varying segmentation methods and motion compensated PET acquisitions: A) 3D AVG PET B) 4D GATED PET C) 4D MIP PET for the example case shown in figure 2.
Table 2 shows no significant differences in maximum planned dose or planned quality between motion compensation methods. Table 3 shows there were significant differences in maximum planned dose, boost volumes and plan quality between segmentation methods. For the three segmentation methods, the MANUAL boost target volume was consistently largest (median 158 cm3), followed by GRADIENT boost target volume (median 93 cm3 on 3D AVG PET, median 95 cm3 on 4D GATED PET, median 93 cm3 on 4D MIP PET), and smallest for FIXED boost target volume (median 42 cm3 on 3D AVG PET, median 40 cm3 on 4D GATED PET, median 42 cm3 on 4D MIP PET).
In figure 4 large variations are seen in the plan quality indices Qrms and VQ0.95-1.05 between the segmentation methods when compared across the motion compensation methods. The percentage of volume receiving 95% of the planned dose calculated using the quality index VQ0.95-1.05 (Figure 4B) correspond to ranges 75-89%, 74-89%, and 87-99 % across the motion compensation methods for the MANUAL, GRADIENT and the FIXED boost volumes, respectively. Similarly, large variation is seen in the median maximum planned dose (Figure 4C) achieved in the boost volumes, which for MANUAL, GRADIENT and FIXED segmentation was 106.55 Gy, 98.25 Gy and 84.22 Gy respectively across 3D AVG. A similar trend was also seen with 4D GATED and 4D MIP. The planned dose variation is not as pronounced across the motion compensated PET acquisitions, with medians of the maximum planned dose being 106.55 Gy, 105.62 Gy and 105.83 Gy for 3D AVG PET, 4D GATED and 4D MIP PET using MANUAL segmentation, respectively. The trend holds true for other segmentation methods.
Figure 4.
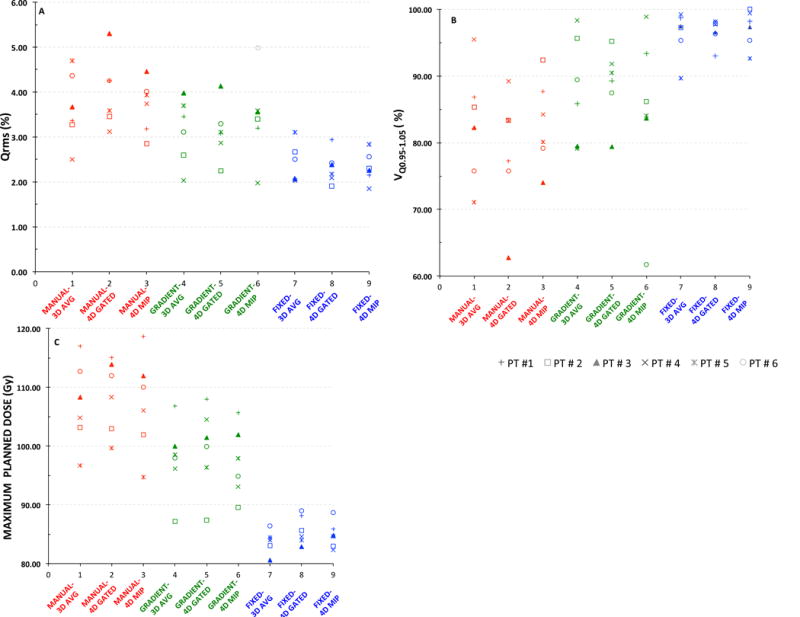
Scatter plot showing the variability in the plan quality and the maximum planned dose for the six patients under different combinations of PET motion compensation and segmentation methods: A) Qrms B) VQ0.95-1.05 C) Maximum planned dose.
Table A1 shows the average and range of SUV in the boost target volumes for all planning scenarios. Figure A1 in the additional file section shows a scatter plot with a linear regression fit of plan quality versus maximum planned dose.
Discussion
Prior attempts at uniform tumor dose escalation in a multicenter trial did not improve overall survival in Stage III NSCLC patients. RTOG 0617 attempted to improve local control and survival by escalating radiation dose in patients with locally advanced NSCLC, but was closed prematurely due to severe adverse effects and failure to show any survival benefit over the standard treatment arm. There are several speculations regarding the negative result of RTOG 0617. Patient selection for 0617 may have been compromised from the outset without the use of PET for disease diagnosis and staging in NSCLC whose importance has been demonstrated21. Optimality of treatment fractionation schedule and lack of standardized image guidance during treatment delivery may have been other contributors. These and other factors motivated the launch of several PET-based dose painting trials to address loco-regional failure in NSCLC by introducing additional functional image-guided boost5,6,22–24 with the objective to increase the dose to radio-resistant regions of the tumor while reducing dose to less resistant areas. Patient outcomes from the Netherlands PET boost, the Danish NARLAL2, and the RTOG 11065,6,24 trials should bring more knowledge to bear on the clinical benefit of dose escalation.
In the absence of reported standards on boost target volume definition and motion compensation methods, this study directly addressed tradeoffs in achievable plan dosimetry. The clinician defined manual GTV/ITV that implicitly incorporated information from PET, CT, and respiratory motion excursion was considered as a region for receiving the boost dose. Within this framework, manual boost volumes exhibited a higher dynamic range of SUV with lower SUVmean while the fixed threshold of 40% SUVmax excluded lower uptake regions and limited the dynamic range of SUV. The trade-off was a lower maximum prescribed dose to the boost volumes for the same integral dose, in exchange for the highest mean plan quality index. In particular, at least 97 % of the boost volume received an accurate plan dose relative to the non-uniform prescribed dose but was limited to a maximum dose of 85 Gy in our small patient sample. This compared favorably to the preliminary results of the PET boost trial in the Netherlands, in which a 50% SUVmax threshold yielded target planned doses of around 85 Gy6. However, it should be noted that the PET boost trial applied additional normal tissue constraints, including limits on the dose to mediastinal tissue and great vessels. In the gradient defined boost volumes, 87% of the boost volumes received an accurate plan dose when compared to only 81% of the boost volumes from manual contoured GTV. The variability in the clinician defined boost volumes may be overcome by a combination of semi-automatic gradient search method with manual review, resulting in higher planned doses (>100Gy in this sample) with acceptable plan quality (VQ0.95-1.05 = 90%).
The motion compensation comparison expanded beyond routine clinical practice, in which the clinician generates the volumes based on the motion averaged PET/CT and individual phases of 4D CT simulation scan. Recently, there have been studies that have reported that in lung tumors the internal target volumes definitions on 3D AVG PET underestimate the true extent compared to 4D gated and 4D MIP25,26. The root mean square error in plan quality was similar across the three acquisition modes. The 3D average PET had the highest interquartile range in plan error across patients and the 4D MIP PET performed slightly better than the 4D Gated PET with a higher mean quality index. This result is in keeping with the findings of Lamb et al25 that volume definition is improved with 4D MIP PET.
In previous studies on 4D PET-based dose painting, Aristophanous et al27 investigated the high uptake boost regions within the tumor and their behavior under the influence of motion and shape deformation. Both shape deformations and motion assessed on the 4D PET propagates to variability in the composite boost volume definition. There are two possible explanations for reduced plan quality in our study in spite of correcting for motion by using motion-compensation methods. First is the residual motion artifact that could be present due to simple phase binning. Even with end-exhale phase gating, it is difficult to reproduce the respiratory motion for patients with NSCLC since the breathing pattern is often highly irregular28. Secondly, there is increased difficulty in resolving motion patterns of locally advanced tumors for accurate dose calculation, as their size and complex tissue deformation result in spatially variable correlation to breathing surrogates (e.g. RPM block) that depend on the tumor location29. Our sample of patients exhibited a limited range of tumor motion amplitude (see Table 1), which may have also diminished its impact on dose painting plans. The magnitude of motion observed even in this small sample is representative of the tumor motion clinically observed in locally advanced NSCLC patients. This may partly be due to bulky tumors being less mobile compared to early stage NSCLC lesions or the motion not being synchronous throughout the whole tumor volume that limits the observed bulk tumor motion. These findings on bulky locally advanced lung cancer tumors differ from prior reports on motion-induced errors for dose painting of small mobile tumors, in which motion-compensated imaging, planning, and delivery substantially reduced errors30. Also, patient selection is of paramount importance even for dose painting of small tumors as peaked doses provide superior local control of early stage disease, as demonstrated by stereotactic body radiotherapy of NCSLC31.
The reported dosimetric variability in non-uniform dose escalation due to segmentation and motion within a small patient sample may not directly translate to observed improvements in local control and overall survival from uniform dose escalation. The clinical plan dosimetry for FDG-based dose escalation in non-small cell lung cancer patients has been reported by Lee et al32. Prospective PET-based dose painting trials, including our investigator-initiated FLARE RT clinical trial (NCT02773238), can address whether sources of imaging uncertainty impact clinical outcomes5,6,33. However, the present work can inform on the designs of future dose painting trials in locally advanced NSCLC by raising awareness of tradeoffs in image segmentation and motion compensation. Our study indicates that correcting for motion does not guarantee higher differential tumor dose in locally advanced NSCLC, and any errors due to residual motion should be considered. If motion-compensated PET acquisitions are available for dose painting, our small sample of patient data suggests that dose painting plans based on 4D MIP PET offer a reasonable tradeoff between plan quality (median VQ0.95-1.05 = 93%) at maximum doses in excess of 90 Gy.
Conclusions
Biologically guided dose escalation is an important strategy for consideration in a subset of locally advanced non-small cell lung cancer patients. Despite the caveats, the study shows that locally advanced lung cancer dose painting plans may be more sensitive to PET segmentation than PET respiratory motion compensation. Careful selection of motion-compensated PET acquisition and segmentation methods is warranted to optimize the tradeoffs in dose escalation and plan quality when designing dose painting trials in locally advanced non-small cell lung cancer patients.
Supplementary Material
Figure A1. Scatter plots of maximum planned dose versus the quality indices Qrms (A, B) and VQ0.95-1.05 (C, D) for varying motion compensated PET acquistions (A,C) or boost volume definition methods (B,D). The plot also shows the 95% confidence ellipse and the linear regression equations and R2 values for the data distributions.
Acknowledgments
We acknowledge funding from the Radiological Society of North America (RSCH1405) and NIH/NCI R01CA204301. The Institute of International Education and the Fulbright-Nehru Doctoral and Profession Research fellowship supported H.M.T Thomas.
Footnotes
Conflict of Interest
The authors report no conflicts of interest. The authors alone are responsible for the content and writing of the paper.
Contributor Information
Hannah Mary Thomas T, Department of Radiation Oncology, School of Medicine, University of Washington, Seattle, Washington 98195; Department of Physics, School of Advanced Sciences, VIT University, Vellore, Tamil Nadu 632002, India.
Paul E. Kinahan, Department of Radiology, School of Medicine, University of Washington Seattle, Washington 98195
James Jebaseelan Samuel E, Department of Physics, School of Advanced Sciences, VIT University, Vellore, Tamil Nadu 632002, India.
Stephen R. Bowen, Departments of Radiology and Radiation Oncology, School of Medicine, University of Washington, Seattle, Washington 98195.
References
- 1.Amini A, Lou F, Correa AM, et al. Predictors for locoregional recurrence for clinical stage III-N2 non-small cell lung cancer with nodal downstaging after induction chemotherapy and surgery. Ann Surg Oncol. 2013;20:1934–1940. doi: 10.1245/s10434-012-2800-x. [DOI] [PMC free article] [PubMed] [Google Scholar]
- 2.Perez CA, Pajak TF, Rubin P, et al. Long-term observations of the patterns of failure in patients with unresectable non-oat cell carcinoma of the lung treated with definitive radiotherapy. Report by the radiation therapy oncology group. Cancer. 1987;59:1874–1881. doi: 10.1002/1097-0142(19870601)59:11<1874::aid-cncr2820591106>3.0.co;2-z. [DOI] [PubMed] [Google Scholar]
- 3.Aerts HJWL, Bussink J, Oyen WJG, et al. Identification of residual metabolic-active areas within NSCLC tumours using a pre-radiotherapy FDG-PET-CT scan: A prospective validation. Lung Cancer. 2012;75:73–76. doi: 10.1016/j.lungcan.2011.06.003. [DOI] [PubMed] [Google Scholar]
- 4.Søvik Å, Malinen E, Olsen DR. Strategies for biologic image-guided dose escalation: a review. Int J Radiat Oncol Biol Phys. 2009;73:650–658. doi: 10.1016/j.ijrobp.2008.11.001. [DOI] [PubMed] [Google Scholar]
- 5.Møller DS, Andersen JL, Appelt AL, et al. The NARLAL2 Phase III Trial: Heterogeneous FDG-Guided Dose Escalation of Advanced NSCLC. A Clinical Trial by the Danish Lung Cancer Group. J Thorac Oncol. 2015;10 doi: 10.1016/S1556-0864(16)30011-9. [DOI] [Google Scholar]
- 6.van Elmpt W, De Ruysscher D, van der Salm A, et al. The PET-boost randomised phase II dose-escalation trial in non-small cell lung cancer. Radiother Oncol. 2012;104:67–71. doi: 10.1016/j.radonc.2012.03.005. [DOI] [PubMed] [Google Scholar]
- 7.Konert T, Vogel W, MacManus MP, et al. PET/CT imaging for target volume delineation in curative intent radiotherapy of non-small cell lung cancer: IAEA consensus report 2014. Radiother Oncol. 2015;116:27–34. doi: 10.1016/j.radonc.2015.03.014. [DOI] [PubMed] [Google Scholar]
- 8.Hatt M, Visvikis D, Le Rest CC. Autocontouring versus manual contouring. J Nucl Med. 2011;52:658–658. doi: 10.2967/jnumed.110.084897. [DOI] [PubMed] [Google Scholar]
- 9.Foster B, Bagci U, Mansoor A, Xu Z, Mollura DJ. A review on segmentation of positron emission tomography images. Comput Biol Med. 2014;50:76–96. doi: 10.1016/j.compbiomed.2014.04.014. [DOI] [PMC free article] [PubMed] [Google Scholar]
- 10.Nelson AD, Werner-Wasik M, Choi W, et al. PET tumor segmentation: multi-observer validation of a gradient-based method using a NSCLC PET phantom. Int J Radiat Oncol Biol Phys. 2009;75:627–627. [Google Scholar]
- 11.Sureshbabu W, Mawlawi O. PET/CT Imaging Artifacts. J Nucl Med Technol. 2005;33:156–161. [PubMed] [Google Scholar]
- 12.Adams MC, Turkington TG, Wilson JM, Wong TZ. A systematic review of the factors affecting accuracy of SUV measurements. Am J Roentgenol. 2010;195:310–320. doi: 10.2214/AJR.10.4923. [DOI] [PubMed] [Google Scholar]
- 13.Liu C, Alessio A, Pierce L, et al. Quiescent period respiratory gating for PET/CT. Med Phys. 2010;37:5037. doi: 10.1118/1.3480508. [DOI] [PMC free article] [PubMed] [Google Scholar]
- 14.Chi A, Nguyen NP. 4D PET/CT as a strategy to reduce respiratory motion artifacts in FDG-PET/CT. Radiat Oncol. 2014;4:205. doi: 10.3389/fonc.2014.00205. [DOI] [PMC free article] [PubMed] [Google Scholar]
- 15.Alessio A, Kohlmyer S, Kinahan P. Consistency driven respiratory phase alignment and motion compensation in PET/CT. IEEE Nucl Sci Symp Conf Rec 1997. 2007;4:3115–3119. doi: 10.1109/NSSMIC.2007.4436789. [DOI] [PMC free article] [PubMed] [Google Scholar]
- 16.Werner-Wasik M, Nelson AD, Choi W, et al. What is the best way to contour lung tumors on PET scans? Multiobserver validation of a gradient-based method using a NSCLC digital PET phantom. Int J Radiat Oncol Biol Phys. 2012;82:1164–1171. doi: 10.1016/j.ijrobp.2010.12.055. [DOI] [PMC free article] [PubMed] [Google Scholar]
- 17.Bradley JD, Moughan J, Graham MV, et al. A phase I/II radiation dose escalation study with concurrent chemotherapy for patients with inoperable stages I-III non-small cell lung cancer: the phase I results of RTOG 0117. Int J Radiat Oncol Biol Phys. 2010;77:367–372. doi: 10.1016/j.ijrobp.2009.04.029. [DOI] [PMC free article] [PubMed] [Google Scholar]
- 18.Deveau MA, Bowen SR, Westerly DC, Jeraj R. Feasibility and sensitivity study of helical tomotherapy for dose painting plans. Acta Oncol. 2010;49:991–996. doi: 10.3109/0284186X.2010.500302. [DOI] [PMC free article] [PubMed] [Google Scholar]
- 19.Vanderstraeten B, Duthoy W, Gersem WD, Neve WD, Thierens H. 18F-fluoro-deoxy-glucose positron emission tomography (18F-FDG-PET) voxel intensity-based intensity-modulated radiation therapy (IMRT) for head and neck cancer. Radiother Oncol. 2006;79:249–258. doi: 10.1016/j.radonc.2006.03.003. [DOI] [PubMed] [Google Scholar]
- 20.Håkansson K, Specht L, Aznar MC, Rasmussen JH, Bentzen SM, Vogelius IR. Prescribing and evaluating target dose in dose-painting treatment plans. Acta Oncol Stockh Swed. 2014;53:1251–1256. doi: 10.3109/0284186X.2014.906747. [DOI] [PubMed] [Google Scholar]
- 21.International Atomic Energy Agency. The role of PET/CT in radiation treatment planning for cancer patient treatment. Vienna: International Atomic Energy Agency; 2008. [Google Scholar]
- 22.Feng M, Kong F-M, Gross M, Fernando S, Hayman JA, Ten Haken RK. Using Fluorodeoxyglucose Positron Emission Tomography to Assess Tumor Volume During Radiotherapy for Non–Small-Cell Lung Cancer and Its Potential Impact on Adaptive Dose Escalation and Normal Tissue Sparing. Int J Radiat Oncol. 2009;73:1228–1234. doi: 10.1016/j.ijrobp.2008.10.054. [DOI] [PMC free article] [PubMed] [Google Scholar]
- 23.Even AJG, van der Stoep J, Zegers CML, et al. PET-based dose painting in non-small cell lung cancer: Comparing uniform dose escalation with boosting hypoxic and metabolically active sub-volumes. Radiother Oncol. 2015:281–286. doi: 10.1016/j.radonc.2015.07.013. [DOI] [PubMed] [Google Scholar]
- 24.Machtay M, Matuszak M, Bradley J, Hirsh V, Ten Haken R, Pryma D. Randomized phase II trial of individualized adaptive radiotherapy using during-treatment FDG PET/CT and modern technology in locally advanced non-small cell lung cancer (NSCLC) RTOG 1106/ACRIN 6697. 2013:1–107. Available at: http://www.rtog.org/ClinicalTrials/ProtocolTable/StudyDetails.aspx?action=openFile&FileID=10848. Accessed January 19, 2015.
- 25.Lamb JM, Robinson C, Bradley J, et al. Generating lung tumor internal target volumes from 4D-PET maximum intensity projections. Med Phys. 2011;38:5732–5737. doi: 10.1118/1.3633896. [DOI] [PMC free article] [PubMed] [Google Scholar]
- 26.Callahan J, Kron T, Siva S, et al. Geographic miss of lung tumours due to respiratory motion: a comparison of 3D vs 4D PET/CT defined target volumes. Radiat Oncol. 2014;9:1–8. doi: 10.1186/s13014-014-0291-6. [DOI] [PMC free article] [PubMed] [Google Scholar]
- 27.Aristophanous M, Yap JT, Killoran JH, Chen AB, Berbeco RI. Four-dimensional positron emission tomography: implications for dose painting of high-uptake regions. Int J Radiat Oncol. 2011;80:900–908. doi: 10.1016/j.ijrobp.2010.08.028. [DOI] [PubMed] [Google Scholar]
- 28.Lu W, Parikh PJ, Hubenschmidt JP, Bradley JD, Low DA. A comparison between amplitude sorting and phase-angle sorting using external respiratory measurement for 4D CT. Med Phys. 2006;33:2964–2974. doi: 10.1118/1.2219772. [DOI] [PubMed] [Google Scholar]
- 29.Allen AM, Siracuse KM, Hayman JA, Balter JM. Evaluation of the influence of breathing on the movement and modeling of lung tumors. Int J Radiat Oncol. 2004;58:1251–1257. doi: 10.1016/j.ijrobp.2003.09.081. [DOI] [PubMed] [Google Scholar]
- 30.Bowen SR, Nyflot MJ, Herrmann C, et al. Imaging and dosimetric errors in 4D PET/CT-guided radiotherapy from patient-specific respiratory patterns: a dynamic motion phantom end-to-end study. Phys Med Biol. 2015;60:3731. doi: 10.1088/0031-9155/60/9/3731. [DOI] [PMC free article] [PubMed] [Google Scholar]
- 31.Karam SD, Horne ZD, Hong RL, McRae D, Duhamel D, Nasr NM. Dose escalation with stereotactic body radiation therapy boost for locally advanced non small cell lung cancer. Radiat Oncol Lond Engl. 2013;8:179. doi: 10.1186/1748-717X-8-179. [DOI] [PMC free article] [PubMed] [Google Scholar]
- 32.Lee E, Zeng J, Miyaoka RS, et al. Functional lung avoidance and response-adaptive escalation (FLARE) RT: Multimodality plan dosimetry of a precision radiation oncology strategy. Med Phys. 2017;44:3418–3429. doi: 10.1002/mp.12308. [DOI] [PMC free article] [PubMed] [Google Scholar]
- 33.FLARE RT for Patients With Stage IIB-IIIB Non-small Cell Lung Cancer: Personalizing Radiation Therapy Using PET/CT and SPECT/CT Imaging. Full Text View - ClinicalTrials.gov. Available at: https://clinicaltrials.gov/ct2/show/NCT02773238. Accessed July 12, 2017.
Associated Data
This section collects any data citations, data availability statements, or supplementary materials included in this article.
Supplementary Materials
Figure A1. Scatter plots of maximum planned dose versus the quality indices Qrms (A, B) and VQ0.95-1.05 (C, D) for varying motion compensated PET acquistions (A,C) or boost volume definition methods (B,D). The plot also shows the 95% confidence ellipse and the linear regression equations and R2 values for the data distributions.