 Mechanistic insights were gained into hydrogen-atom transfer reactions from benzyl alcohol derivatives with different oxidation potentials to a highly reactive Cr(v)–oxo complex to reveal switching of reaction mechanisms.
Abstract
A mononuclear Cr(v)–oxo complex, [CrV(O)(6-COO–-tpa)](BF4)2 (1; 6-COO–-tpa = N,N-bis(2-pyridylmethyl)-N-(6-carboxylato-2-pyridylmethyl)amine) was prepared through the reaction of a Cr(iii) precursor complex with iodosylbenzene as an oxidant. Characterization of 1 was achieved using ESI-MS spectrometry, electron paramagnetic resonance, UV-vis, and resonance Raman spectroscopies. The reduction potential (E red) of 1 was determined to be 1.23 V vs. SCE in acetonitrile based on analysis of the electron-transfer (ET) equilibrium between 1 and a one-electron donor, [RuII(bpy)3]2+ (bpy = 2,2′-bipyridine). The reorganization energy (λ) of 1 was also determined to be 1.03 eV in ET reactions from phenol derivatives to 1 on the basis of the Marcus theory of ET. The smaller λ value in comparison with that of an Fe(iv)–oxo complex (2.37 eV) is caused by the small structural change during ET due to the dπ character of the electron-accepting LUMO of 1. When benzyl alcohol derivatives (R-BA) with different oxidation potentials were employed as substrates, corresponding aldehydes were obtained as the 2e–-oxidized products in moderate yields as determined from 1H NMR and GC-MS measurements. One-step UV-vis spectral changes were observed in the course of the oxidation reactions of BA derivatives by 1 and a kinetic isotope effect (KIE) was observed in the oxidation reactions for deuterated BA derivatives at the benzylic position as substrates. These results indicate that the rate-limiting step is a concerted proton-coupled electron transfer (PCET) from substrate to 1. In sharp contrast, in the oxidation of trimethoxy-BA (E ox = 1.22 V) by 1, trimethoxy-BA radical cation was observed by UV-vis spectroscopy. Thus, it was revealed that the mechanism of the oxidation reaction changed from one-step PCET to stepwise ET–proton transfer (ET/PT), depending on the redox potentials of R-BA.
Introduction
Extensive efforts have been devoted to the preparation of high-valent metal–oxo complexes in order to understand their reactivity in the oxidative conversion of organic substrates.1–3 Non-heme high-valent iron–oxo species have been identified as key intermediates in various enzymatic oxidations involving oxidative C–H bond cleavage, such as those of taurine:α-ketoglutarate dioxygenase and halogenase Cytc 3.4–6 These enzymatic reactions have been usually triggered by transferring formally a hydrogen atom (H˙) from organic substrates (R–H) to metal–oxo species ([Mn(O)]) as the initial step as expressed by eqn (1), i.e., hydrogen-atom transfer (HAT).
 |
1 |
Mechanistic insights into HAT from a substrate to a high-valent metal–oxo species in oxidative reactions have been gained using “radical clock” substrates, which usually involve a cyclopropane framework such as bicyclo[2.1.0]pentane and methylcyclopropane, for several decades.7 These radical-clock experiments have contributed to being able to discriminate the mechanisms of oxidation reactions by scrutinizing reaction products: whether radical-clock compounds are oxidized via concerted, radical, or cationic mechanisms.7 Once a radical intermediate is formed by a HAT reaction from such a radical-clock compound to a high-valent metal–oxo species, radical rearrangements or a ring-opening reaction occurs in competition with oxygen rebound to produce hydroxylated products.7 Although such arguments should be valid only for specific substrates, further details of HAT require a more general protocol to elucidate the mechanism for a wide range of substrates.
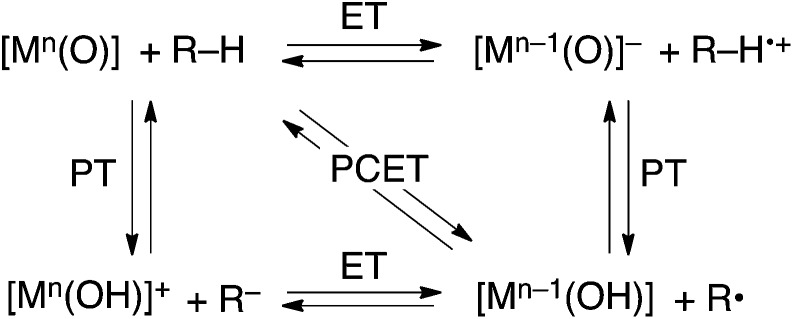
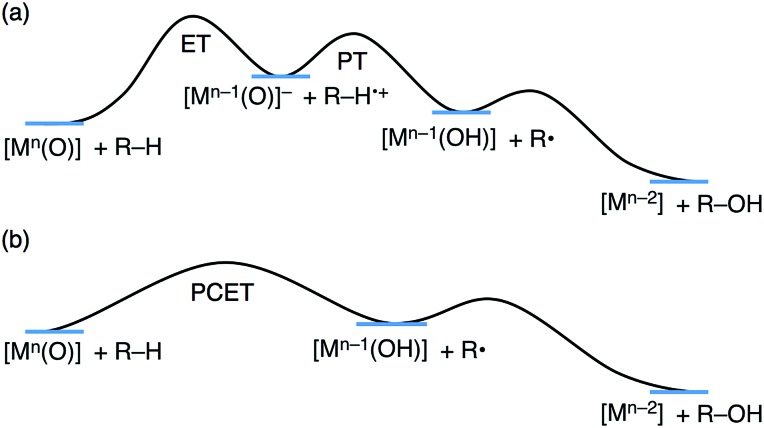
HAT reactions performed by [Mn(O)] have been categorized into stepwise electron/proton transfer (ET/PT) as well as proton/electron transfer (PT/ET), and concerted proton-coupled electron transfer (PCET), as shown in Scheme 1.8–10 High-valent metal–oxo species have been recognized to oxidize a C–H bond of a substrate by accepting an electron at the metal centre and a proton at the oxo ligand, respectively, in a concerted manner with a certain kinetic isotope effect.9 This concerted pathway can be recognized as a “PCET” mechanism in Scheme 1. The one-step PCET pathway is kinetically discriminate from the stepwise ET/PT pathway (Scheme 2). Thus, PCET reactions can occur, even if the electron transfer process from substrates to metal–oxo species is thermodynamically uphill.8a,10b It has been suggested that whether a net hydrogen-atom transfer reaction proceeds via a one-step concerted pathway (PCET) or a stepwise pathway (ET/PT or PT/ET) depends on underlying parameters for both oxidants and substrates, including C–H bond dissociation energies of substrates, redox potentials and the reorganization energy (λ) of metal–oxo complexes, pK a of metal–oxo and metal–hydroxo species.11–15
Scheme 1.
Scheme 2. Schematic energy diagrams of (a) stepwise ET/PT and (b) one-step PCET.
The λ values of Fe(iv)–oxo16 and Mn(iv)–oxo species17 have been determined to be 2.37–2.74 eV and 2.27 eV, respectively. The relatively large λ values are interpreted as due to the structural change during ET due to the dσ character of the LUMO. When the smaller λ value of high-valent metal–oxo species is achieved, ET and PCET reactions would be accelerated. In order to reduce the structural change, dπ character of the LUMO should be required as is realized in Cr(v)–oxo species in the d1 configuration. In addition, the spin state is fixed to be S = 1/2, regardless of ligands used.
Cr(v)–oxo complexes have been synthesized and characterized not only in relevance to high-valent Fe– and Mn–oxo complexes,18 which are mostly unstable, but also in the light of many examples in which they have been proposed as important reactive intermediates in oxidation reactions.19 Efforts have been rather devoted to elucidating the electronic structure and determining the crystal structures of Cr(v)–oxo complexes, which are stabilized using highly electron-donating ancillary ligands such as salen derivatives18a,19a,g and porphyrinoids.18b,c,19b,e The stabilization inevitably makes such Cr(v)–oxo complexes less reactive toward external organic substrates.18c,d Thereby, mechanistic investigation of the reactivity of those stabilized Cr(v)–oxo complexes has been limited to oxygen-atom transfer reactions including epoxidation of alkenes,18a,19a,b and oxygenation of phosphines18d,19d,e and sulfides.19g In contrast, the lack of a characterizable but highly reactive Cr(v)–oxo complex, which is capable of HAT reactions from a variety of substrates, limits understanding of mechanisms of the reactions by Cr(v)–oxo complexes.18e,20 In order to gain mechanistic insights into HAT reactions by a Cr(v)–oxo complex, the regulation of the electron density at a Cr(v) center should be important for balancing its stabilization and its reactivity by employing a multidentate ligand with moderate electron-donating ability.
We report herein the preparation, characterization and reactivity of a Cr(v)–oxo complex, [CrV(O)(6-COO–-tpa)]2+ (6-COO–-tpa21 = N,N-bis(2-pyridylmethyl)-N-(6-carboxylato-2-pyridylmethyl)amine; 1), having a monoanionic pentadentate ligand. The Cr(v)–oxo complex 1 not only exhibits moderate stability to be spectroscopically characterized but also a high reduction potential enough to perform HAT reactions from a series of organic substrates, allowing us to discuss in detail the reactivity of Cr(v)–oxo complexes in HAT reactions for the first time.
Experimental
General
UV-vis absorption spectra were measured in acetonitrile (CH3CN) on Shimadzu UV-3600 and Agilent 8453 spectrometers at various temperatures. ESI-TOF-MS spectra were obtained on an Applied Biosystems QSTAR Pulsar i-mass spectrometer. 1H NMR spectra were recorded on a JEOL EX-270 spectrometer. ESR measurements were performed on a Bruker Bio SpinEMXPlus9.5/2.7 spectrometer in CH3CN. GC-MS data were obtained on a JEOL JMS-T100GCV spectrometer, equipped with a capillary gas chromatograph (Agilent 7890A, HP-5 (19091J-413) capillary column). 18O-labeled PhIO (PhI18O)22 and deuterated benzyl alcohol derivatives23 were synthesized as described in the literature. CH3CN was distilled over CaH2 under Ar prior to use. THF was distilled from Na/benzophenone under Ar before use. Chemicals were used as received unless otherwise noted.
Synthesis of N,N-bis(2-pyridylmethyl)-N-(6-ethoxycarbonyl-2-pyridylmethyl)amine (6-COOEt-tpa)
Bis(2-pyridylmethyl)amine (2.38 g, 12.0 mmol) in CH3CN (40 mL) was added to a solution of 6-(ethoxycarbonyl)-2-chloromethylpyridine24 (2.20 g, 11.0 mmol) and Na2CO3 (6.36 g, 60.0 mmol) in CH3CN (60 mL) and the mixture was refluxed for 24 h. After cooling, the mixture was filtered and CH3CN was removed using a rotary evaporator to afford a deep brown oil. This crude material was purified on an alumina column, eluting with EtOAc/hexane (4/1 v/v), to give the ligand as a brown oil. The yield was 72% (2.88 g). 1H NMR (CD3CN): 1.34 (t, J = 7 Hz, 3H, –CH2CH3), 3.80 (s, 4H, –CH2–py), 3.86 (s, 2H, –CH2–py–COOEt), 4.34 (q, J = 7 Hz, 2H, –CH2CH3), 7.13 (dd, J = 5 Hz, 1 Hz, 2H, H4 of py), 7.56 (d, J = 8 Hz, 2H, H3 of py), 7.66 (dd, J = 5 Hz, 6 Hz, 2H, H5 of py), 7.8–7.9 (m, 3H, H3 and H4 and H5 of py–COOEt), 8.45 (d, J = 6 Hz, 2H, H6 of py).
Synthesis of bis(2-pyridylmethyl)(6-carboxyl-2-pyridylmethyl)amine (6-COOH-tpa)21
NaOH (2.00 g, 50 mmol) in H2O (75 mL) was added to a solution of 6-(COOEt)-tpa (2.88 g, 8.0 mmol) in ethanol (75 mmol) and the mixture solution was refluxed for 20 h. After cooling, the solution was neutralized with 70% HClO4 to pH ∼4. Ethanol was removed using a rotatory evaporator and the aqueous solution was extracted with CHCl3 (3×) and then dried over MgSO4. By removing CHCl3, 6-COOH-tpa was obtained as a light brown liquid in 99% yield. 1H NMR (CD3CN): 3.78 (s, 4H, CH2–py), 3.83 (s, 2H, –CH2–py–COOH), 7.15 (dd, J = 8 Hz, 6 Hz, 2H, H4 of py), 7.41 (m, 3H, H3 of py and H5 of py–COOH), 7.68 (t, J = 8 Hz, 2H, H5 of py), 7.79 (t, J = 8 Hz, 1H, H3 of py–COOH), 7.94 (d, J = 8 Hz, 1H, H6 of py–COOH), 8.52 (d, J = 6 Hz, 2H, H6 of py). ESI-MS (m/z): 333.1 ({M – H+}–).
Synthesis of [CrIII(6-COO–-tpa)(Cl)](BF4) (2)
6-COOH-tpa (1.86 g, 5.59 mmol) was dissolved in distilled THF (40 mL) and to the solution was added CrCl2 (482 mg, 3.92 mmol). The mixture was stirred overnight under Ar at 298 K. NH4BF4 (472 mg, 4.5 mmol) was added and the mixture was stirred for a further 1 h under air. The precipitate was filtered and washed with THF and diethyl ether. The dark purple powder of the crude product was reprecipitated from CH3CN/diethyl ether. The target compound was obtained as a purple powder (641 mg, 1.16 mmol) in 30% yield. UV-vis (CH3CN): λ max (nm) = 393 (ε = 130 M–1 cm–1), 554 (ε = 190 M–1 cm–1). Anal. calcd for BC19F4H19N4O3ClCr: C, 43.41; H, 3.64; N, 10.66. Found: C, 43.18; H, 3.57; N, 10.66%.
Synthesis of [CrIII(6-COO–-tpa)(BF4)](BF4) (3)
A solution containing [CrIII(6-COO–-tpa)Cl](BF4) (40 mg, 0.080 mmol) and AgBF4 (22 mg, 0.12 mmol) in H2O (20 mL) was stirred at room temperature and then heated to 373 K. The temperature was kept for 6 h. The pink solution was filtered through a membrane filter to remove insoluble solids. The filtrate was evaporated to dryness and the residual solids were dissolved into CH3CN. Vapor diffusion of ethyl acetate to the solution allowed us to obtain pink crystals. The crystals obtained were washed with diethyl ether and then dried in vacuo. The target compound was obtained as pink crystals (31 mg, 0.055 mmol) in 69% yield. UV-vis (CH3CN): λ max (nm) = 370 (ε = 120 M–1 cm–1), 550 (ε = 180 M–1 cm–1). Anal. calcd for B2C20F8H21N4O3.5Cr: C, 40.10; H, 3.53; N, 9.35. Found: C, 40.30; H, 3.47; N, 9.16%.
X-ray crystallography of 2 and 3
A purple single crystal of 2 was grown by vapor diffusion of THF into an CH3CN solution of 2. A pink single crystal of 3 was obtained by recrystallization from an CH3CN solution of 3 with vapor diffusion of ethyl acetate as a poor solvent. All measurements were performed at 120 K on a Bruker APEXII Ultra diffractometer. The structures were solved by a direct method (SIR-97) and expanded with a differential Fourier technique. All non-hydrogen atoms were refined anisotropically and the refinement was carried out with full matrix least squares on F. All calculations were performed using the Yadokari-XG crystallographic software package.25 †
Formation of Cr(v)–oxo complex, 1
[CrV(O)(6-COO–-tpa)]2+ (1) was prepared in situ by the reaction of 3 (0.50 mM, 2.5 μmol) with iodosylbenzene (PhIO; 2.5 mM, 12.5 μmol) in CH3CN (5 mL) at 298 K under air. While the resulting suspension was stirred for 60 min, a colour change from pink to yellowish brown was observed.26 The yellowish brown solution was filtered to remove remaining PhIO. The concentration of 1 was determined to be 25 ± 5% (0.13 ± 0.03 mM) by chemical titration with [FeII(bpy)3]2+ and double integration of the signal due to 1 against that of a standard radical (TEMPO radical) using ESR measurements.
Kinetic measurements
Kinetic measurements were performed on a UNISOKU RSP-2000 stopped-flow spectrometer equipped with a multi-channel photodiode array or an Agilent 8453 photodiode-array spectrophotometer or a Shimadzu UV-3600 spectrophotometer at 298 K. To a solution of the complex 1 (0.1 mM) in CH3CN, was added a substrate (benzyl alcohol and the deuterated derivatives) with various concentrations in CH3CN at various temperatures. The reactions were monitored by the decay of the absorption assigned to that of 1 at λ = 330 nm.
ESR measurements
ESR spectra were taken on a Bruker X-band spectrometer (EMXPlus9.5/2.7) with a liquid nitrogen or a liquid helium transfer system under non-saturating microwave power conditions (1.0 mW). The magnitude of the modulation was chosen to optimize the resolution and the signal to noise ratio (S/N) of the observed spectrum (modulation amplitude, 3–15 G; modulation frequency, 100 kHz).
Resonance Raman spectroscopy of complex 1
Samples were prepared by the following procedures. For [CrV(16O)(6-COO–-tpa)]2+, PhI16O (5.5 mg, 25 μmol) was added to 2 mL of an CD3CN solution containing 3 (2.8 mg, 4.9 μmol) and stirred for 35 min at 298 K under Ar. For [CrV(18O)(6-COO–-tpa)]2+, PhI18O (5.5 mg, 25 μmol) was added to 2 mL of an CD3CN solution containing 3 (2.8 mg, 4.9 μmol) and H2 18O (5 μL) and stirred for 35 min at 298 K under Ar. Resonance Raman scattering was carried out by excitation at 441.6 nm with a He–Cd Laser (KIMMON KOHA CO., LTD.). The scattered light was dispersed with a polychromator (MC-100DG, Ritsu Oyo Kogaku) and detected with a CCD detector (Symphony, HORIBA Jobin Yvon). The measurements were performed at 236 K using a spinning NMR tube at 135° scattering geometry.
Electrochemical measurements
Second harmonic AC voltammetry (SHACV) and differential pulse voltammetry (DPV) measurements were carried out in CH3CN containing 0.1 M TBAPF6 as an electrolyte at 298 K under Ar with a platinum working electrode, a platinum wire as a counter electrode, and Ag/AgNO3 as a reference electrode. An AUTOLAB PGSTAT12 potentiometer was used for SHACV measurements and a BAS ALS-710D electrochemical analyzer for DPV measurements, respectively.
Computational methods
The structures of [CrV(O)(6-COO–-tpa)]2+, [CrIV(O)(6-COO–-tpa)]+, [FeIV(O)(TMC)]2+ and [FeIII(O)(TMC)]+ were optimized by using the hybrid B3LYP functional27 without solvent effects. The Wachters–Hay basis set28,29 was used for Fe and the 6-311+G** basis set30 for H, C, N and O atoms. The program used was Gaussian 09.31
Results and discussion
Preparation and characterization of a Cr(v)–oxo complex
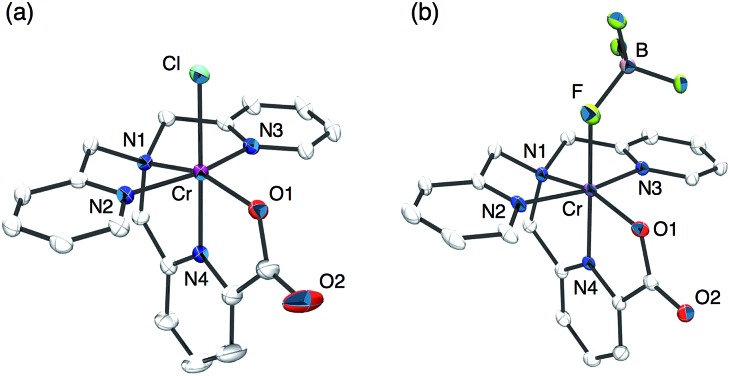
The synthesis of a mononuclear Cr(v)–oxo complex, [CrV(O)(6-COO–-tpa)](BF4)2 (1), was accomplished by the procedure shown in Scheme 3. The synthetic method for the Cr(iii) precursor complex, [CrIII(6-COO–-tpa)(Cl)](BF4) (2), was described in the experimental section. In the electrospray ionization TOF mass (ESI-TOF-MS) spectrum, the complex 2 exhibited a peak cluster at m/z = 420.10 (calcd for [CrIII(6-COO–-tpa)(Cl)]+: 420.04) as shown in Fig. S1a in the ESI.† The crystal structure of 2 was determined by X-ray crystallography. Its ORTEP drawing is depicted in Fig. 1a and selected bond lengths are given in the figure caption. The bond length of Cr–N4 was 1.978(2) Å, which is shorter than those of Cr–N bonds for other pyridine rings. This result should be induced by a strong binding of the anionic carboxyl group to the Cr(iii) centre and two successive five-membered chelate rings in the meridional geometry. Note the bond lengths of Cr–Nx (x = 1–4) in [CrIII(Cl)2(tpa)]+ have been reported to fall in the range of 2.05–2.08 Å.32
Scheme 3.
Fig. 1. ORTEP drawings of the cation moieties of (a) [CrIII(6-COO–-tpa)(Cl)](BF4) (2) and (b) [CrIII(6-COO–-tpa)(BF4)](BF4) (3) using 50% probability thermal ellipsoids with numbering schemes for the heteroatoms. Hydrogen atoms are omitted for clarity. Selected bond lengths (Å) for 2: Cr–Cl 2.2874(6), Cr–O1 1.959(2), Cr–N1 2.088(2), Cr–N2 2.048(2), Cr–N3 2.066(2), Cr–N4 1.978(2). Selected bond lengths (Å) for 3: Cr–F 1.986(2), Cr–O1 1.958(2), Cr–N1 2.079(2), Cr–N2 2.044(2), Cr–N3 2.046(2), Cr–N4 1.968(2).
Treatment of complex 2 with AgBF4 in H2O resulted in the formation of [CrIII(6-COO–-tpa)(BF4)](BF4) (3) via removing the chloro ligand. The structure of 3 was unambiguously determined by X-ray crystallography. As shown in Fig. 1b, the coordinated anionic ligand was identified as BF4 –. The crystal structure suggests that the oxo ligand should be formed at the trans position to the pyridine moiety having the carboxyl group. In contrast, in the ESI-TOF-MS spectrum, the complex 3 unexpectedly exhibited a peak cluster at m/z = 404.14 (calcd for [CrIII(6-COO–-tpa)(F)]+: 404.07) without any peak clusters due to the BF4 –-bound Cr(iii) complex as shown in Fig. S1b in the ESI.† The coordinated fluoride anion (F–) was presumably derived from decomposition of the BF4 – anion in the ionization process of ESI-TOF-MS measurements.33
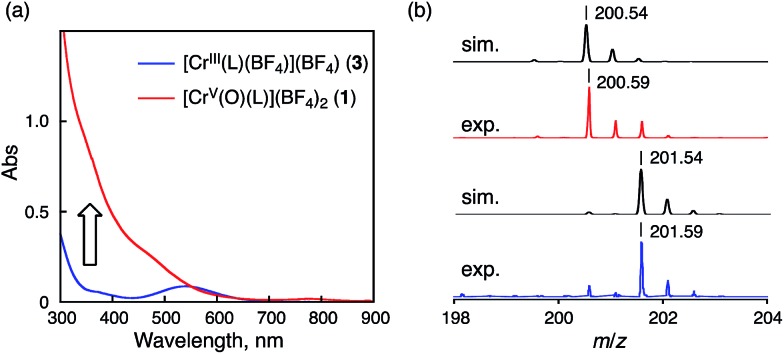
Reaction of 3 with iodosylbenzene (PhIO) in acetonitrile (CH3CN) at 298 K resulted in a colour change from pink to yellowish brown, accompanying the spectral change as shown in Fig. 2a. This spectral feature is similar to that of a previously reported Cr(v)–oxo complex described in the literature.18d The stability of 1 in CH3CN was evaluated by measuring the half-lifetime (τ 1/2) at different temperatures (τ 1/2 ∼ 20 min at 298 K and τ 1/2 > 24 h at 243 K) (Fig. S2 in ESI†). The ESI-TOF-MS spectrum of 1 exhibited a peak cluster at m/z = 200.59 (calcd for [CrV(O)(6-COO–-tpa)]2+: 401.08), which was in good agreement with the calculated isotopic pattern (Fig. 2b). When PhI16O was replaced by isotopically labeled PhI18O with a small amount of H2 18O, the peak cluster corresponding to 18O-labeled 1 shifted to m/z = 201.59 (Fig. 2b).34 Electron spin resonance (ESR) measurements on 1 in CH3CN at 243 K and 100 K afforded a strong signal at g = 1.9756, assignable to that of a Cr(v) species (S = 1/2),18,19 which was different from that of complex 3 (S = 3/2)35 in CH3CN at 10 K (see Fig. S3 in ESI†).
Fig. 2. (a) UV-vis spectral change observed upon addition of PhIO to 3 (0.5 mM) in CH3CN at 298 K. (b) Positive-ion ESI-TOF-MS of 1 (upper) and 18O-labeled 1 (lower) in CH3CN. The black lines are simulated isotopic patterns.
The formation yield of Cr(v)–oxo complex was calculated to be 20 ± 3% on the basis of the spin amount obtained by double integration of the ESR signal against a standard (TEMPO radical) and 25 ± 5% (ref. 36) based on the stoichiometry of the Cr(v)–oxo complex in an electron-transfer (ET) reaction from [FeII(bpy)3]2+ (bpy = 2,2′-bipyridine) (vide infra).
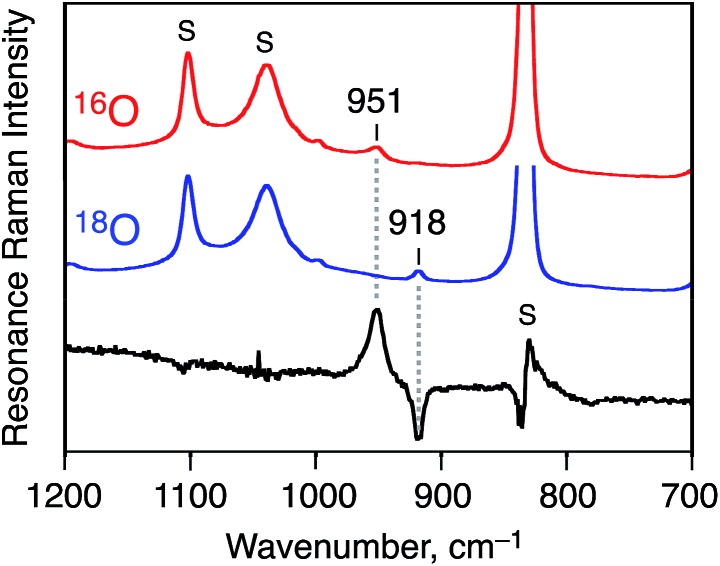
In addition, the strong evidence to support the formation of 1 as a Cr(v)–oxo complex was obtained by resonance Raman spectroscopy (at 236 K, excitation at 441.6 nm in CD3CN). As shown in Fig. 3, Raman scattering due to the Cr(v)–oxo moiety was observed at 951 cm–1, which was comparable to that observed for a reported Cr(v)–oxo complex with a corrole derivative as a supporting ligand (986 cm–1).37 The peak of 1-18O, which was formed by using PhI18O with a small amount of H2 18O, shifted to 918 cm–1; the isotopic shift (33 cm–1) is fairly consistent with the calculated value (Δν = 41 cm–1) as shown in Fig. 3.38
Fig. 3. Resonance Raman spectra of [CrV(16O)(6-COO–-tpa)]2+ (red line), [CrV(18O)(6-COO–-tpa)]2+ (blue line), and their differential spectrum (black line); measured at 236 K in CD3CN with 441.6 nm excitation. The peaks marked with ‘S’ are ascribed to the bands due to the solvent.
Reduction potential of complex 1
In order to determine the E red value of 1 in the light of ET equilibrium, [FeII(bpy)3]2+ was employed as an electron donor (E ox = 1.06 V vs. SCE) in CH3CN.39 Upon addition of [FeII(bpy)3]2+ to an CH3CN solution containing 1 (0.15 mM), a UV-vis spectral change was observed at 298 K (Fig. S5 in ESI†). The final concentration of [FeIII(bpy)3]3+ was 0.15 mM on the basis of the absorption coefficient (ε 650 = 300 M–1 cm–1),40a indicating that a stoichiometric ET reaction proceeded from [FeII(bpy)3]2+ to 1. ESR measurements clearly exhibited ET from [FeII(bpy)3]2+ to 1, where the signal at g = 1.98 due to 1 decreases, accompanied by an increase in a new signal at g = 2.6 due to [FeIII(bpy)3]3+ (Fig. S6a in ESI†).41 In this case, one-way ET from [FeII(bpy)3]2+ to 1 occurs to indicate that the reduction potential of 1 is much higher than 1.06 V.
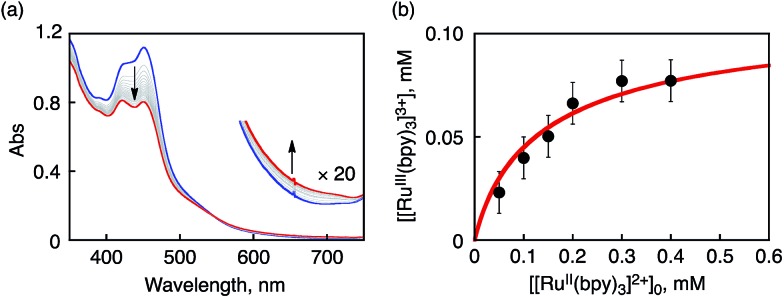
In sharp contrast to the case of [FeII(bpy)3]2+, the ET reaction between 1 and [RuII(bpy)3]2+ (E ox = 1.24 V)42 is found to be in ET equilibrium (Scheme 4), where the observed concentration of [RuIII(bpy)3]3+ (ε 675nm = 420 M–1 cm–1)40b produced in the ET reaction from [RuII(bpy)3]2+ to 1 increases with the increase in the initial concentration of [RuII(bpy)3]2+ ([[RuII(bpy)3]2+]0) as shown in Fig. 4.16,43 Formation of [RuIII(bpy)3]3+ was also confirmed by the detection of an ESR signal at g = 2.6 as shown in Fig. S6b in the ESI.41 † The ET equilibrium between complex 1 and [RuII(bpy)3]2+ indicates that the redox potential of 1 is close to that of [RuII(bpy)3]2+ according to the Nernst equation (eqn (2)), where F is the Faraday constant and K et is an ET-equilibrium constant.16,43 The K et value was determined to be 0.57 ± 0.13 at 243 K by fitting the plot according to a equation described in the literature16 (red line), as shown in Fig. 4b. The apparent one-electron reduction potential (E red) of 1 (E red (1)) was then determined to be 1.23 ± 0.01 V using eqn (2).
| Ered = Eox + (RT/F)ln Ket | 2 |
Scheme 4.
Fig. 4. (a) UV-vis spectral change observed upon addition of [RuII(bpy)3]2+ (0.1 mM) to an CH3CN solution of 1 (0.1 mM) at 243 K. (b) Plot of concentration of [RuIII(bpy)3]3+ produced in electron transfer from [RuII(bpy)3]2+ to 1 in CH3CN at 243 K vs. initial concentration of [RuII(bpy)3]2+, [[RuII(bpy)3]2+]0.
The E red (1) value is much higher than those of CrV(O) complexes reported so far,18,19 such as [CrV(O)(TpFPC)] (E red = 0.11 V vs. Ag/AgCl; TpFPC = tris(pentafluorophenyl)corrolato)18c with a trianionic ligand and [CrV(O)(TMP)]+ (E red = 0.76 V vs. Ag/AgCl; TMP = tetramesitylporphyrinato) with a dianionic ligand,18b although a CrV(O) complex with a macrocyclic ligand (1,4,8,11-tetraazacyclotetradecane) has been proposed to exhibit a higher E red value (>1.34 V vs. SCE) in the presence of HClO4.44 In the case of 1, the addition of a proton showed not so much influence (∼+0.1 V) on the reduction potential as observed in DPV measurements.45
When bromoferrocene (BrFc; E 1/2 = 0.54 V) was employed as a one-electron donor, complex 1 (0.17 mM) consumed 2 eq. of BrFc in CH3CN at 243 K on the basis of the absorption due to BrFc+ (ε 630 = 330 M–1 cm–1).46 This result indicated that two-electron reduction of 1 occurred to form a Cr(iii) species (Fig. S7 in ESI†). On the other hand, upon addition of 0.5 mM triphenylamine (Ph3N) as a one-electron donor (E ox = 0.85 V)47 to an CH3CN solution containing 1 (0.04 mM) in the absence of acid at 243 K, ET from Ph3N to 1 occurred to form one equivalent of the one-electron oxidized product (Ph3N˙+), which showed an absorption band at 650 nm observed by UV-vis spectroscopy (Fig. S8 in ESI†). Subsequently, addition of HClO4 (2 mM) to the reaction solution including Ph3N resulted in additional formation of one more equivalent of Ph3N˙+, indicating that the two-electron reduction of 1 by Ph3N occurred in the presence of H+.48 The formation of two equivalents of Ph3N˙+ relative to 1 clearly indicates that 1 is the sole oxidant in the solution. In addition, the protonation of one-electron reduced Cr(iv)–oxo complex leads to a positive shift of the E red of Cr(iii/iv) beyond the E ox value of Ph3N. Thus two-electron oxidation of a substrate should be possible for 1 via the formation of [CrIV(6-COO–-tpa)(OH)]2+, which is a protonated species of the one-electron reduced species of 1, in a PCET or ET/PT process.
Determination of the λ value of complex 1
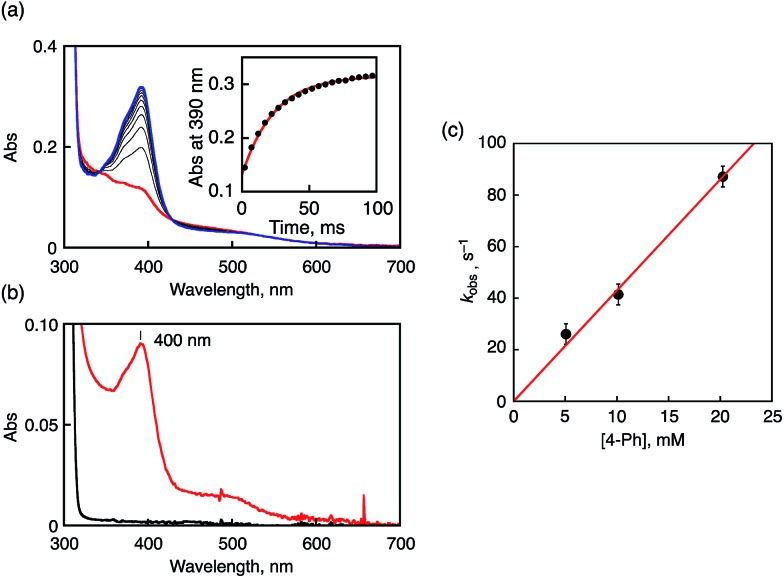
To gain kinetic insight into the ET reduction of 1 in CH3CN, phenol derivatives (R-PhOH and naphthols) were employed as electron donors. In the case of 4-phenylphenol (4-Ph), ET rates were determined on the basis of the increase of the absorption band at 400 nm due to 4-Ph˙+ as shown in Fig. 5a. The absorption band of 4-Ph˙+ agreed with that observed in the independent experiment using a strong one-electron oxidant such as ammonium hexanitratocerate(iv) (CAN) as shown in Fig. 5b. The pseudo-first-order rate constants (k obs) for the oxidation of 4-Ph by 1 increase linearly with increasing concentrations of 4-Ph. The second-order rate constant (k et) was determined to be 4.3 × 10³ M–1 s–1 from the slope of the linear plot as depicted in Fig. 5c. Similarly, k et values were determined for oxidation reactions of other phenol derivatives by 1 (Fig. S9 in ESI†). The obtained k et values are listed in Table 1, together with the oxidation potentials of phenol derivatives (E ox) determined by SHACV measurements and driving forces of ET (–ΔG et = –e(E ox – E red (1))). Judging from the kinetic isotope effect values (KIE = 1.0–1.1), the reactions between 1 and phenol derivatives proceed via ET followed by PT rather than one-step PCET.49,50
Fig. 5. (a) UV-vis spectral change upon addition of 4-Ph (10 mM) to 1 (0.1 mM) in CH3CN at 233 K. Inset: the time profile at 390 nm due to 4-Ph˙+. (b) UV-vis spectrum of 4-Ph˙+ produced by oxidizing 4-Ph with CAN in CH3CN at 233 K. (c) Plots of k obs vs. [4-Ph].
Table 1. One-electron oxidation potentials (E ox) of phenol derivatives, driving forces of ET (–ΔG et), ET rate constants (k et), and KIE values in ET reactions from phenol derivatives to 1 at 233 K.
| R-PhOH and naphthols | E ox a /V | –ΔG et/eV | k et/M–1 s–1 | KIE |
| 4-Me | 1.52 | –0.29 | (1.5 ± 0.1) × 102 | |
| 4-Ph | 1.39 | –0.16 | (4.3 ± 0.2) × 103 | 1.1 |
| 2,3-(MeO)2 | 1.39 | –0.16 | (1.4 ± 0.1) × 104 | |
| 2,4,6-Me3 | 1.37 | –0.14 | (1.5 ± 0.1) × 104 | |
| 2-MeO | 1.37 | –0.14 | (1.2 ± 0.1) × 104 | |
| 2-Naphthol | 1.19 | 0.04 | (4.5 ± 0.2) × 104 | |
| 1-Naphthol | 1.17 | 0.06 | (2.5 ± 0.1) × 105 | 1.0 |
aDetermined by SHACV performed in CH3CN at room temperature under Ar in the presence of TBAPF6 (0.1 M) as an electrolyte (vs. SCE).
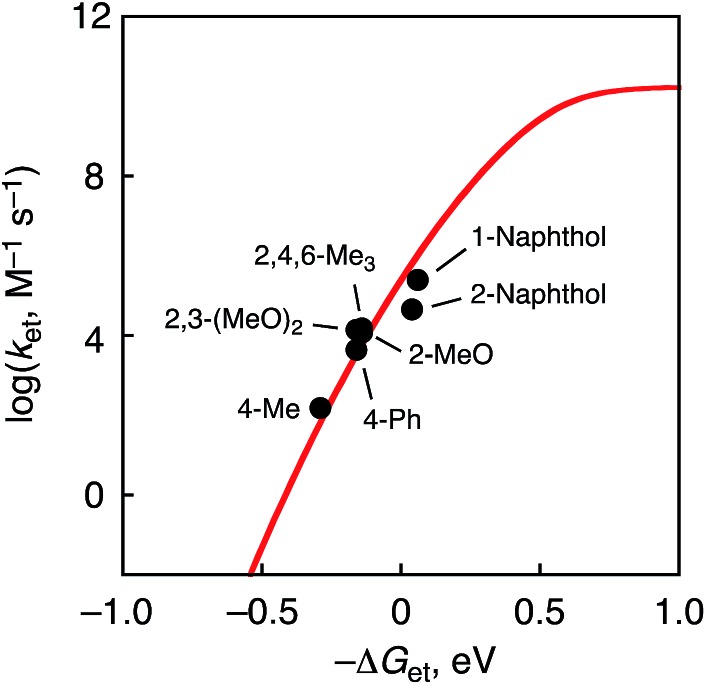
The driving-force dependence of log k et for phenol derivatives is shown in Fig. 6, where the log k et values are plotted relative to the driving force of ET (–ΔG et). The plot was analysed in light of the Marcus theory of adiabatic outer-sphere electron transfer (eqn (3)), where k diff is the diffusion rate constant, k B is the Boltzmann constant and Z [= (k B T/h)(k diff/k –diff)] is the collision frequency that is taken as 1 × 10¹¹ M–1 s–1.51 The k diff value in CH3CN is taken as 2.0 × 10¹⁰ M–1 s–1.52
 |
3 |
Fig. 6. Plots of log k et vs. –ΔG et in ET reactions from phenol derivatives to 1 at 233 K.
The reorganization energy of ET (λ) of 1 was thus determined to be 1.03 ± 0.05 eV in CH3CN at 233 K on the basis of the Marcus plot in Fig. 6. The λ value of 1 is much smaller than that (2.37 ± 0.04 eV) of a non-heme Fe(iv)–oxo complex, [FeIV(O)(TMC)(CH3CN)]2+.16 This indicates that the structural change upon the ET reduction is much smaller for 1 than that for the FeIV–oxo complex. In order to argue the structural change during the ET reaction, DFT calculations were performed to estimate the structural difference between complex 1 and the corresponding CrIV(O) complex by comparing bond lengths around the Cr centres. As a result, the LUMO of 1 was revealed to localize on the dxy orbital involved in the π* orbital of the Cr–O bond (Fig. S12 in ESI†). Thus, the Cr–O bond (1.55 Å) was elongated to 1.63 Å upon the ET reduction (Fig. S13a in ESI†). On the other hand, in the case of the Fe(iv)–oxo complex (S = 1), the LUMO has been reported to be the dx2–y2 orbital53 and the equatorial Fe–N bonds (2.12–2.15 Å) were elongated to 2.24–2.29 Å (Fig. S13b in ESI†). The average of the change of coordination bond lengths around the metal centres is smaller for 1 (0.044 Å) than that for the FeIV–oxo complex (0.090 Å). Thus, the smaller structural change of 1 in the course of ET reactions to afford the smaller λ value should be due to the fact that the LUMO of 1 is a dπ orbital as suggested by DFT calculations (Fig. S12 in ESI†).54 In addition, in the case of a Mn(v)(O) complex with a corrolazine derivative,55 a smaller λ value (1.53 eV) has been reported; in this case, the Mn(v) centre also accepts an electron into a dπ orbital.
Impact of redox potentials of substrates on their oxidation by 1
Complex 1, showing a high reduction potential, is expected to be an efficient oxidant for HAT reactions (eqn (1)) because a Cr(v)–oxo complex is capable of accepting not only e– at the Cr(v) centre but also H+ at the terminal oxo ligand upon the reduction as mentioned above. We examined HAT reactions from substrates listed in Table 2 to 1. First, in the case of benzyl alcohol (H-BA)56 that shows the oxidation potential (E ox) of 2.33 V (vs. SCE) as a substrate, complex 1 worked as a 2e–-oxidant to afford benzaldehyde as the sole product (Scheme 5), as identified and quantified by 1H NMR and GC-MS measurements (Fig. S14 and 15 in ESI†).
Table 2. One-electron oxidation potentials (E ox) of BA derivatives, driving force for ET (–ΔG et), second-order rate constants (k H or k et), and KIE values for the oxidation of benzyl alcohol derivatives with complex 1 in CH3CN at 233 K.
| No. | R-BA | E ox a /V | –ΔG et/eV | k H or k et/M–1 s–1 | KIE |
| 1 | 4-NO2 | 2.88 | –1.65 | 1.4 ± 0.1 | — |
| 2 | H | 2.33 | –1.10 | 2.5 ± 0.1 | 5.4 |
| 3 | 4-t-Bu | 2.07 | –0.84 | 5.4 ± 0.3 | — |
| 4 | 4-Me | 2.05 | –0.82 | 5.2 ± 0.2 | — |
| 5 | 4-MeO | 1.58 | –0.35 | 21 ± 1 | 12 |
| 6 | 3,5-(MeO)2-4-Me | 1.49 | –0.26 | 19 ± 1 | 6.8 |
| 7 | 3,5-(MeO)2 | 1.49 | –0.26 | 9.0 ± 0.5 | — |
| 8 | 2,3,4-(MeO)3 | 1.37 | –0.14 | 16 ± 1 | — |
| 9 | 3,4,5-(MeO)3 | 1.22 | 0.01 | 1800 ± 50 | 1.1 |
| 10 | 2,5-(MeO)2 | 1.20 | 0.03 | Too fast | — |
aDetermined by SHACV performed in CH3CN at room temperature under Ar in the presence of TBAPF6 (0.1 M) as an electrolyte (vs. SCE).
Scheme 5.
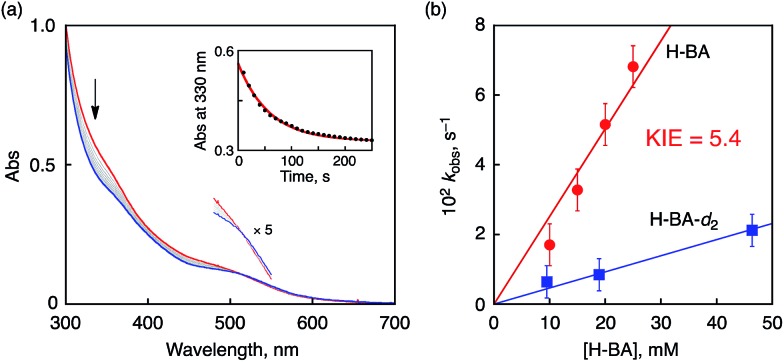
To elucidate the reaction mechanism of HAT reactions from H-BA derivatives to 1, a kinetic analysis was conducted on the basis of spectroscopic measurements. The addition of an excess amount of H-BA to an CH3CN solution of 1 resulted in the decay of the absorption derived from 1 with an isosbestic point at 515 nm, as shown in Fig. 7a. The decay time profile of the absorption at 330 nm due to 1 obeyed pseudo-first-order kinetics (inset of Fig. 7a). The pseudo-first-order rate constant (k obs) increased linearly with increasing concentrations of H-BA (Fig. 7b, red line). The second-order rate constant (k H) was determined to be 2.5 M–1 s–1 from the slope of the linear plot. When H-BA was replaced by the corresponding deuterated compound at the benzylic position (benzyl alcohol-d 2, H-BA-d 2), a significant deceleration of the oxidation rate (blue line in Fig. 7b, k D = 0.46 M–1 s–1) was observed, giving a kinetic isotope effect (KIE = k H/k D) of 5.4 at 233 K.
Fig. 7. (a) UV-vis spectral change observed upon addition of benzyl alcohol (10 mM) to 1 (0.1 mM) in CH3CN at 233 K. Inset: the decay time profile of the absorbance at λ = 330 nm due to 1. (b) Concentration dependence of pseudo-first-order rate constants (k obs) for the reaction of 1 with H-BA (red) and benzyl alcohol-d 2 (blue).
Similarly, kinetic analysis was made on the oxidation reactions of BA derivatives having substituents (R) on the aromatic ring of H-BA (R-BA) to afford corresponding benzaldehydes as the sole products. In the case of 4-methoxy-BA (4-MeO-BA; E ox = 1.58 V) and 3,5-dimethoxy-4-methyl-BA (3,5-(MeO)2-4-Me-BA; E ox = 1.49 V) used as substrates, KIE values were also determined to be 12 and 6.8, respectively, as listed in Table 2. The observed KIE values suggest that the oxidation reactions of R-BA should be initiated by a one-step PCET reaction from substrates to the Cr(v)–oxo complex rather than an ET oxidation, since ET reactions are difficult under highly endothermic situations (–ΔG et < 0).
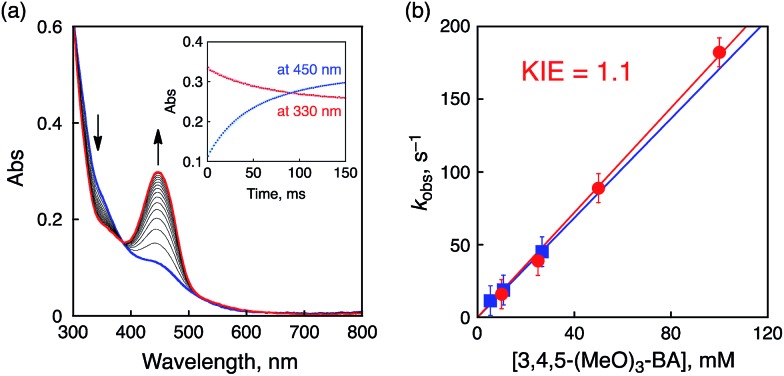
The oxidation potentials of the substrates listed in Table 2 as no. 1–8 are much higher than the reduction potential of 1, however, the oxidation potential of 3,4,5-trimethoxy-BA (3,4,5-(MeO)3-BA, E ox = 1.22 V) is comparable to the E red of 1. In the course of the oxidation of 3,4,5-(MeO)3-BA with 1, a new absorption band appeared at 450 nm, which was assigned to 3,4,5-(MeO)3-BA radical cation (3,4,5-(MeO)3-BA˙+) as a new intermediate (Fig. 8a and Fig. S16 in ESI†).12a
Fig. 8. (a) Spectral changes observed in the oxidation of 3,4,5-(MeO)3-BA (10 mM) by 1 (0.1 mM) in CH3CN at 233 K. Inset: time profiles of the absorbance at λ = 330 nm due to 1 and the absorbance at λ = 450 nm due to 3,4,5-(MeO)3-BA˙+. (b) Plots of k obs vs. [3,4,5-(MeO)3-BA (red) or 3,4,5-(MeO)3-BA-d 2 (blue)].
A time profile of the decay of the absorption at 330 nm (inset of Fig. 8a, red line) due to 1 coincides with that of the rise of the absorption at 450 nm (inset of Fig. 8a, blue line). The formation rate constant (k et) of 3,4,5-(MeO)3-BA˙+ was thus determined to be 1.8 × 10³ M–1 s–1 by changing the concentration of 3,4,5-(MeO)3-BA as shown in Fig. 8b (red line with filled circles). This indicates that ET from 3,4,5-(MeO)3-BA to 1 occurs faster than PCET because of the low oxidation potential of 3,4,5-(MeO)3-BA. In addition, negligible KIE (1.1) was observed for deuterated 3,4,5-(MeO)3-BA (3,4,5-(MeO)3-BA-d 2) at the benzylic position (Fig. 8b, blue line with filled squares) to exclude a PCET pathway in the oxidation.
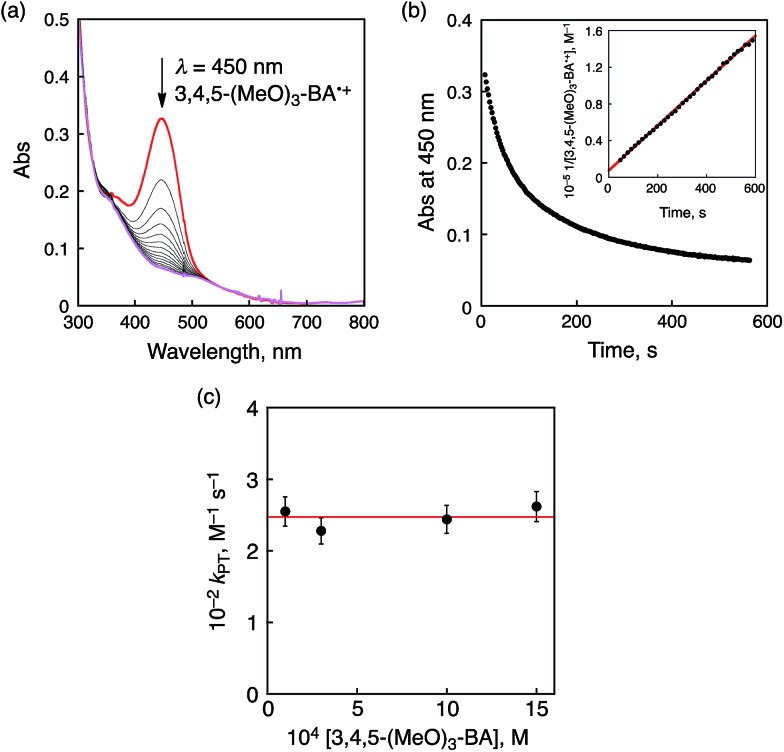
A subsequent reaction of ET from 3,4,5-(MeO)3-BA to 1 was analyzed by the decay of the absorption at 450 nm due to 3,4,5-(MeO)3-BA˙+ (Fig. 9a). The decay time profile obeyed second-order kinetics as shown in Fig. 9b and thus we assumed that this process should be a proton transfer (PT) process from 3,4,5-(MeO)3-BA˙+ to a CrIV(O) complex derived from one-electron reduction of 1. The second-order rate constant (k PT) was determined to be 2.5 × 10² M–1 s–1. It should be noted that the k PT values show no dependence on the concentration of 3,4,5-(MeO)3-BA (Fig. 9c). Therefore, we conclude that the second step is accounted for by intermolecular PT from 3,4,5-(MeO)3-BA˙+ to the CrIV(O) complex to form 3,4,5-(MeO)3-BA˙ and a CrIV(OH) complex.
Fig. 9. (a) Following spectral changes observed in the oxidation of 3,4,5-(MeO)3-BA (1.0 mM) by 1 (0.1 mM) in CH3CN at 233 K. (b) The decay time profile at λ = 450 nm due to 3,4,5-(MeO)3-BA˙+. Inset: second-order plot. (c) Plots of k PT vs. [3,4,5-(MeO)3-BA].
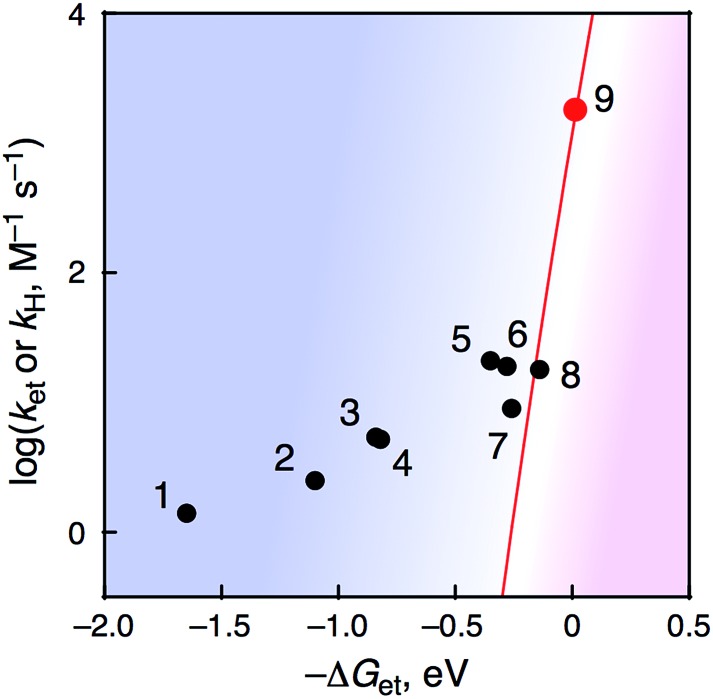
All kinetic parameters obtained for PCET or ET reactions from R-BA to 1 at 233 K are summarized in Table 2. When the rate constants were plotted against –ΔG et as shown in Fig. 10, a boundary was found around –ΔG et = –0.2 eV. It should be noted that the KIE was still observed to be 6.8 in the case of 3,5-(MeO)2-4-Me-BA, although the –ΔG et value (–0.26 eV) is close to the mechanistic borderline. This phenomenon clearly represents the first example of alteration of the oxidation mechanism (one-step PCET or stepwise ET/PT) of organic substrates by using a metal–oxo complex without any additives to control the reactivity.12
Fig. 10. Plots of log k H or log k et–ΔG et in HAT reactions of R-BA by 1 at 233 K.
Recently, Fukuzumi and co-workers have reported a mechanistic borderline, which discriminates between one-step PCET and stepwise ET/PT mechanisms in the oxidation of benzyl alcohol derivatives by non-heme Fe(iv)–oxo complexes in the presence and absence of Sc3+.12 In the one-step PCET reactions, the oxidized products are also different: radical coupling products and corresponding aldehydes in the presence and absence of Sc3+, respectively. In sharp contrast to the case of Fukuzumi and co-workers, the present study provides apparently the same net hydrogen-atom transfer reaction to afford corresponding benzaldehydes via either a PCET or ET/PT pathway under the same conditions, without perturbation of the reactivity of metal–oxo species by additives.
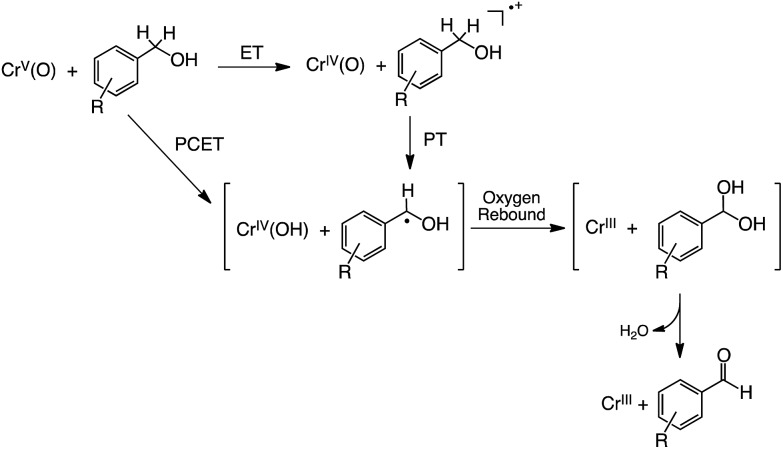
Based on these results, we propose a mechanism for the oxidation of R-BA by 1 in CH3CN at 233 K as shown in Fig. 11. In the case of R-BA, except for 3,4,5-(MeO)3-BA, one-step PCET occurs to yield H-atom abstracted species and showing a considerable KIE. In sharp contrast to this, the oxidation of 3,4,5-(MeO)3-BA by 1 allowed us to observe the formation of 3,4,5-(MeO)3-BA˙+ as the intermediate in the course of the reaction. Then, deprotonation from 3,4,5-(MeO)3-BA˙+ is facilitated by the more basic CrIV(O) complex to form 3,4,5-(MeO)3-BA˙, which should be the same intermediate derived from one-step PCET. Although such a mechanistic difference may often result in the formation of different oxidized products, the oxidation of R-BA by 1 provides only the corresponding aldehydes as the two-electron oxidized products via an oxygen-rebound process57 affording α-diol intermediates, which undergo facile dehydration.
Fig. 11. Proposed mechanism for oxidation of R-BA by 1.
Conclusions
In conclusion, we have synthesized and characterized a reactive Cr(v)–oxo complex (1) by using a monoanionic pentadentate ligand (6-COO–-tpa). The E red value of 1 was determined to be 1.23 V vs. SCE on the basis of analysis of the ET equilibrium with [RuII(bpy)3]2+. The reorganization energy of ET from phenols to 1 has been determined to be 1.03 ± 0.05 eV, which is much smaller than that for a non-heme FeIV(O) complex, due to the smaller structural change upon one-electron reduction. When a series of benzyl alcohol derivatives were employed as substrates of oxidation by 1, we found a mechanistic borderline between one-step PCET and stepwise ET/PT around –ΔG et = –0.2 eV. The present study provides a standard for the elucidation of the reactivity of Cr(v)–oxo complexes in HAT reactions.
Acknowledgments
This work was supported by a Grant-in-Aid (no. 24750052 and 24245011) from the Japan Society of Promotion of Science (JSPS, MEXT) of Japan and financial support from The Kurata Foundation.
Footnotes
References
- (a) Nam W. Acc. Chem. Res. 2007;40:522–531. doi: 10.1021/ar700027f. [DOI] [PubMed] [Google Scholar]; (b) Que Jr L. Acc. Chem. Res. 2007;40:493–500. doi: 10.1021/ar700024g. [DOI] [PubMed] [Google Scholar]
- (a) Borovik A. S. Chem. Soc. Rev. 2011;40:1870–1874. doi: 10.1039/c0cs00165a. [DOI] [PMC free article] [PubMed] [Google Scholar]; (b) Goldberg D. P. Acc. Chem. Res. 2007;40:626–634. doi: 10.1021/ar700039y. [DOI] [PubMed] [Google Scholar]; (c) Lam W. W. Y., Man W.-L., Lau T.-C. Coord. Chem. Rev. 2007;251:2238–2252. [Google Scholar]
- Rohde J.-U., In J.-H., Lim M. H., Brennessel W. W., Bukowski M. R., Stubna A., Münck E., Nam W., Que Jr L. Science. 2003;299:1037–1039. doi: 10.1126/science.299.5609.1037. [DOI] [PubMed] [Google Scholar]
- Price J. C., Barr E. W., Glass T. E., Krebs C., Bollinger Jr J. M. J. Am. Chem. Soc. 2003;125:13008–13009. doi: 10.1021/ja037400h. [DOI] [PubMed] [Google Scholar]
- (a) Costas M., Mehn M. P., Jensen M. P., Que Jr L. Chem. Rev. 2004;104:939–986. doi: 10.1021/cr020628n. [DOI] [PubMed] [Google Scholar]; (b) Krebs C., Galonic Fujimori D., Walsh C. T., Bollinger Jr J. M. Acc. Chem. Res. 2007;40:484–492. doi: 10.1021/ar700066p. [DOI] [PMC free article] [PubMed] [Google Scholar]; (c) Galonic D. P., Barr E. W., Walsh C. T., Bollinger Jr J. M., Krebs C. Nat. Chem. Biol. 2007;3:113. doi: 10.1038/nchembio856. [DOI] [PubMed] [Google Scholar]
- Vaillancourt F. H., Yeh E., Vosburg D. A., Garneau-Tsodikova S., Walsh C. T. Chem. Rev. 2006;106:3364–3378. doi: 10.1021/cr050313i. [DOI] [PubMed] [Google Scholar]
- (a) Ortiz de Montellano P. R., Stearns R. A. J. Am. Chem. Soc. 1987;109:3415–3420. [Google Scholar]; (b) Bowry V. W., Ingold K. U. J. Am. Chem. Soc. 1991;113:5699–5707. [Google Scholar]; (c) Newcomb M., Le Tadic-Biadatti M. H., Chestney D. L., Roberts E. S., Hollenberg P. F. J. Am. Chem. Soc. 1995;117:12085–12091. [Google Scholar]; (d) Auclair K., Hu Z., Little D. M., Ortiz de Montellano P. R., Groves J. T. J. Am. Chem. Soc. 2002;124:6020–6027. doi: 10.1021/ja025608h. [DOI] [PubMed] [Google Scholar]
- (a) Mayer J. M. Annu. Rev. Phys. Chem. 2004;55:363–390. doi: 10.1146/annurev.physchem.55.091602.094446. [DOI] [PubMed] [Google Scholar]; (b) Mayer J. M., Rhile I. J. Biochim. Biophys. Acta, Bioenerg. 2004;1655:51–58. doi: 10.1016/j.bbabio.2003.07.002. [DOI] [PubMed] [Google Scholar]; (c) Warren J. J., Tronic T. A., Mayer J. M. Chem. Rev. 2010;110:6961–7001. doi: 10.1021/cr100085k. [DOI] [PMC free article] [PubMed] [Google Scholar]; (d) Mayer J. M. Acc. Chem. Res. 2011;44:36–46. doi: 10.1021/ar100093z. [DOI] [PMC free article] [PubMed] [Google Scholar]
- (a) Huynh M. H. V., Meyer T. J. Chem. Rev. 2007;107:5004–5064. doi: 10.1021/cr0500030. [DOI] [PMC free article] [PubMed] [Google Scholar]; (b) Weinberg D. R., Gagliardi C. J., Hull J. F., Murphy C. F., Ken C. A., Westlake B. C., Paul A., Ess D. H., McCraffety D. G., Meyer T. J. Chem. Rev. 2012;112:4016–4093. doi: 10.1021/cr200177j. [DOI] [PubMed] [Google Scholar]
- (a) Hammes-Schiffer S. Acc. Chem. Res. 2009;42:1881–1889. doi: 10.1021/ar9001284. [DOI] [PMC free article] [PubMed] [Google Scholar]; (b) Hammes-Schiffer S., Stuchebrukhov A. A. Chem. Rev. 2010;110:6939–6960. doi: 10.1021/cr1001436. [DOI] [PMC free article] [PubMed] [Google Scholar]
- (a) Goto Y., Watanabe Y., Fukuzumi S., Jones J. P., Dinnocenzo J. P. J. Am. Chem. Soc. 1998;120:10762–10763. [Google Scholar]; (b) Shearer J., Zhang C. X., Zakharov L. N., Rheingold A. L., Karlin K. D. J. Am. Chem. Soc. 2005;127:5469–5483. doi: 10.1021/ja045191a. [DOI] [PubMed] [Google Scholar]; (c) Osako T., Ohkubo K., Taki M., Tachi Y., Fukuzumi S., Itoh S. J. Am. Chem. Soc. 2003;125:11027–11033. doi: 10.1021/ja029380+. [DOI] [PubMed] [Google Scholar]
- (a) Morimoto Y., Park J., Suenobu T., Lee Y.-M., Nam W., Fukuzumi S. Inorg. Chem. 2012;51:10025–10036. doi: 10.1021/ic3016723. [DOI] [PubMed] [Google Scholar]; (b) Park J., Morimoto Y., Lee Y.-M., Nam W., Fukuzumi S. Inorg. Chem. 2014;53:3618–3628. doi: 10.1021/ic403124u. [DOI] [PubMed] [Google Scholar]
- Jaccob M., Ansari A., Pandey B., Rajaraman G. Dalton Trans. 2013;42:16518–16526. doi: 10.1039/c3dt52290c. [DOI] [PubMed] [Google Scholar]
- Waidmann C. R., Zhou X., Tsai E. A., Kaminsky W., Hrovat D. A., Borden W. T., Mayer J. M. J. Am. Chem. Soc. 2009;131:4729–4743. doi: 10.1021/ja808698x. [DOI] [PMC free article] [PubMed] [Google Scholar]
- Parsell T. H., Yang M.-Y., Borovik A. S. J. Am. Chem. Soc. 2009;131:2762–2763. doi: 10.1021/ja8100825. [DOI] [PMC free article] [PubMed] [Google Scholar]
- Lee Y.-M., Kotani H., Suenobu T., Nam W., Fukuzumi S. J. Am. Chem. Soc. 2008;130:434–435. doi: 10.1021/ja077994e. [DOI] [PubMed] [Google Scholar]
- Yoon H., Lee Y.-M., Wu X., Cho K.-B., Sarangi R., Nam W., Fukuzumi S. J. Am. Chem. Soc. 2013;135:9186–9194. doi: 10.1021/ja403965h. [DOI] [PMC free article] [PubMed] [Google Scholar]
- (a) Srinivasan K., Kochi J. K. Inorg. Chem. 1985;24:4671–4679. [Google Scholar]; (b) Fujii H., Yoshimura T., Kamada H. Inorg. Chem. 1997;36:1122–1127. doi: 10.1021/ic960722k. [DOI] [PubMed] [Google Scholar]; (c) Meier-Callahan A. E., Gray H. B., Gross Z. Inorg. Chem. 2000;39:3605–3607. doi: 10.1021/ic000180d. [DOI] [PubMed] [Google Scholar]; (d) O'Reilly M., Falkowski J. M., Ramachandran V., Pati M., Abboud K. A., Dalal N. S., Gray T. G., Veige A. S. Inorg. Chem. 2009;48:10901–10903. doi: 10.1021/ic9019469. [DOI] [PubMed] [Google Scholar]; (e) Cho J., Woo J., Eun Han J., Kubo M., Ogura T., Nam W. Chem. Sci. 2011;2:2057–2062. [Google Scholar]; (f) Codd R., Levina A., Zhang L., Hambley T. W., Lay P. A. Inorg. Chem. 2000;39:990–997. doi: 10.1021/ic990730b. [DOI] [PubMed] [Google Scholar]
- (a) Samsel E. G., Srinivasan K., Kochi J. K. J. Am. Chem. Soc. 1985;107:7606–7617. [Google Scholar]; (b) Garrison J. M., Ostovic D., Bruice T. C. J. Am. Chem. Soc. 1989;111:4960–4966. [Google Scholar]; (c) Muzart J. Chem. Rev. 1992;92:113–140. [Google Scholar]; (d) Bakac A. J. Am. Chem. Soc. 2003;125:14714–14715. doi: 10.1021/ja0382213. [DOI] [PubMed] [Google Scholar]; (e) Mahammed A., Gray H. B., Meier-Callahan A. E., Gross Z. J. Am. Chem. Soc. 2003;125:1162–1163. doi: 10.1021/ja028216j. [DOI] [PubMed] [Google Scholar]; (f) Levina A., Lay P. A. Coord. Chem. Rev. 2005;249:281–298. [Google Scholar]; (g) Venkataramanan N. S., Premsingh S., Rajagopal S., Pitchumani K. J. Org. Chem. 2003;68:7460–7470. doi: 10.1021/jo034558b. [DOI] [PubMed] [Google Scholar]
- Alcohol oxidation by a CrIII(salen) complex with PhIO as an oxidant has been reported: Adam W., Gelalcha F. G., Saha-Möller C. R., Stegmann V. R., J. Org. Chem., 2000, 65 , 1915 –1918 . [DOI] [PubMed] [Google Scholar]
- Kojima T., Hirai Y., Ishizuka T., Shiota Y., Yoshizawa K., Ikemura K., Ogura T., Fukuzumi S. Angew. Chem., Int. Ed. 2010;49:8449–8453. doi: 10.1002/anie.201002733. [DOI] [PubMed] [Google Scholar]
- Schardt B. C., Hill C. L. Inorg. Chem. 1983;22:1563–1565. [Google Scholar]
- Bejot R., Tisserand S., Li D. R., Falck J. R., Mioskowski C. Tetrahedron Lett. 2007;48:3855–3858. [Google Scholar]
- Fornasier R., Milani D., Scrimin P., Tonellato U. J. Chem. Soc., Perkin Trans. 2. 1986:233–237. [Google Scholar]
- (a) Wakita K., Yadokari-XG, Software for Crystal Structure Analyses, 2001.; (b) Kabuto C., Akine S., Nemoto T., Kwon E. J. Cryst. Soc. Jpn. 2009;51:218. [Google Scholar]
- In the presence of excess PhIO, the complex 1 does not decompose to survive longer than 1 h
- Becke A. D. J. Chem. Phys. 1993;98:5648–5652. [Google Scholar]
- Wachters A. J. H. J. Chem. Phys. 1970;52:1033–1036. [Google Scholar]
- Hay P. J. J. Chem. Phys. 1977;66:4377–4384. [Google Scholar]
- Krishnan P., Binkley J. S., Seeger R., Pople J. A. J. Chem. Phys. 1980;72:650–654. [Google Scholar]
- Frisch M. J., Trucks G. W., Schlegel H. B., Scuseria G. E., Robb M. A., Cheeseman J. R., Scalmani G., Barone V., Mennucci B., Petersson G. A., Nakatsuji H., Caricato M., Li X., Hratchian H. P., Izmaylov A. F., Bloino J., Zheng G., Sonnenberg J. L., Hada M., Ehara M., Toyota K., Fukuda R., Hasegawa J., Ishida M., Nakajima T., Honda Y., Kitao O., Nakai H., Vreven T., Montgomery Jr J. A., Peralta J. E., Ogliaro F., Bearpark M., Heyd J. J., Brothers E., Kudin K. N., Staroverov V. N., Kobayashi R., Normand J., Raghavachari K., Rendell A., Burant J. C., Iyengar S. S., Tomasi J., Cossi M., Rega N., Millam J. M., Klene M., Knox J. E., Cross J. B., Bakken V., Adamo C., Jaramillo J., Gomperts R., Stratmann R. E., Yazyev O., Austin A. J., Cammi R., Pomelli C., Ochterski J. W., Martin R. L., Morokuma K., Zakrzewski V. G., Voth G. A., Salvador P., Dannenberg J. J., Dapprich S., Daniels A. D., Farkas Ö., Foresman J. B., Ortiz J. V., Cioslowski J. and Fox D. J., Gaussian 09, Revision D.01, Gaussian, Inc., Wallingford CT, 2009.
- Robertson N. J., Carney M. J., Halfen J. A. Inorg. Chem. 2003;42:6876–6885. doi: 10.1021/ic034530i. [DOI] [PubMed] [Google Scholar]
- (a) Cotton F. A., Daniels L. M., Murillo C. A., Pascual I. J. Am. Chem. Soc. 1997;119:10223–10224. [Google Scholar]; (b) Nelson K. J., DiPasquale A. G., Rheingold A. L., Daniels M. C., Miller J. S. Inorg. Chem. 2008;47:7768–7774. doi: 10.1021/ic800837f. [DOI] [PubMed] [Google Scholar]; (c) Tomat E., Cuesta L., Lynch V. M., Sessler J. L. Inorg. Chem. 2007;46:6224–6226. doi: 10.1021/ic700933p. [DOI] [PubMed] [Google Scholar]
- 5 μL of H2 18O was added in 2 mL of CH3CN solution in order to prevent the exchange reaction of the oxo moiety by the residual H2 16O in CH3CN. See: Groves J. T., Kruper Jr W. J., J. Am. Chem. Soc., 1979, 101 , 7613 –7615 Nam W., Valentine S., J. Am. Chem. Soc., 1993, 115 , 1772 –1778 . [Google Scholar]
- (a) Harada R., Matsuda Y., Ōkawa H., Miyamoto R., Yamauchi S., Kojima T. Inorg. Chim. Acta. 2005;358:2489–2500. [Google Scholar]; (b) Summerville D. A., Jones R. D., Hoffman B. M., Basolo F. J. Am. Chem. Soc. 1977;99:8195–8202. doi: 10.1021/ja00467a012. [DOI] [PubMed] [Google Scholar]
- Residual Cr complexes were assumed to be ligand-oxidized products, which were mainly produced by intermolecular oxidation reactions, as observed by ESI-MS measurements (Fig. S4 in ESI)
- Czernuszewicz R. S., Mody V., Czader A., Gałęzowski M., Gryko D. T. J. Am. Chem. Soc. 2009;131:14214–14215. doi: 10.1021/ja906393r. [DOI] [PubMed] [Google Scholar]
- (a) Collins T. J., Slebodnick C., Uffelman E. S. Inorg. Chem. 1990;29:3433–3436. [Google Scholar]; (b) Morse D. B., Rauchfuss T. B., Wilson S. R. J. Am. Chem. Soc. 1988;110:8234–8235. [Google Scholar]
- Fukuzumi S., Yoshida Y., Urano T., Suenobu T., Imahori H. J. Am. Chem. Soc. 2001;123:11331–11332. doi: 10.1021/ja015751v. [DOI] [PubMed] [Google Scholar]
- (a) Sahami S., Osteryoung R. A. Inorg. Chem. 1984;23:2511–2518. [Google Scholar]; (b) Creutz C., Sutin N. Proc. Natl. Acad. Sci. U. S. A. 1975;72:2858–2862. doi: 10.1073/pnas.72.8.2858. [DOI] [PMC free article] [PubMed] [Google Scholar]
- Kober E. M., Meyer T. J. Inorg. Chem. 1983;22:1614–1616. [Google Scholar]
- (a) Fukuzumi S., Nakanishi I., Tanaka K., Suenobu T., Tabard A., Guilard R., Caemelbecke E. V., Kadish K. M. J. Am. Chem. Soc. 1999;121:785–790. [Google Scholar]; (b) Morimoto Y., Kotani H., Park J., Lee Y.-M., Nam W., Fukuzumi S. J. Am. Chem. Soc. 2011;133:403–405. doi: 10.1021/ja109056x. [DOI] [PubMed] [Google Scholar]
- Comba P., Fukuzumi S., Kotani H., Wunderlich S. Angew. Chem., Int. Ed. 2010;49:2622–2625. doi: 10.1002/anie.200904427. [DOI] [PubMed] [Google Scholar]
- Bakac A., Wang W.-D. J. Am. Chem. Soc. 1996;118:10325–10326. [Google Scholar]
- A reversible redox wave for 1 was not observed in CV measurements as in the case of a non-heme Fe(iv)–oxo complex, [FeIV(O)(TMC)(CH3CN)]2+ (TMC = 1,4,8,11-tetramethyl-1,4,8,11-tetrazacyclotetradecane), which was reported in ref. 16
- Mase K., Ohkubo K., Fukuzumi S. J. Am. Chem. Soc. 2013;135:2800–2808. doi: 10.1021/ja312199h. [DOI] [PubMed] [Google Scholar]
- Arbogast J. W., Foote C. S., Kao M. J. Am. Chem. Soc. 1992;114:2277–2279. [Google Scholar]
- The pK a value of HNPh3 + has been reported to be –3.91 in H2O. See: Hoefnagel A. J., Hoefnagel M. A., Wepster B. M., J. Org. Chem., 1981, 46 , 4209 –4211 . [Google Scholar]
- We have confirmed that the reaction between 1 and 2,4,6-Me3PhOH affords a 2e–-oxidation product, 4-hydroxy-2,4,6-trimethylcyclohexa-2,5-dienone (Fig. S10 in ESI). The product was characterized by 1H NMR and GC-MS measurements. The 1H NMR data of 4-hydroxy-2,4,6-trimethylcyclohexa-2,5-dienone has been already reported in the literature. See: Zagulyaeva A. A., Banek C. T., Yusubov M. S., Zhdankin V. V., Org. Lett., 2010, 12 , 4644 –4647 . [DOI] [PubMed] [Google Scholar]
- A slope (–0.44) of the linear relationship between (RT/F)ln(k et) and E ox (Fig. S11 in ESI) also indicates that the initial step is electron transfer in the oxidation of phenol derivatives by 1. See ref. 11c
- (a) Marcus R. A. Annu. Rev. Phys. Chem. 1964;15:155–196. [Google Scholar]; (b) Marcus R. A. Angew. Chem., Int. Ed. Engl. 1993;32:1111–1121. [Google Scholar]
- (a) Nakanishi T., Ohkubo K., Kojima T., Fukuzumi S. J. Am. Chem. Soc. 2009;131:577–584. doi: 10.1021/ja806261q. [DOI] [PubMed] [Google Scholar]; (b) Fukuzumi S., Ohkubo K., Suenobu T., Kato K., Fujitsuka M., Ito O. J. Am. Chem. Soc. 2001;123:8459–8467. doi: 10.1021/ja004311l. [DOI] [PubMed] [Google Scholar]
- Jackson T. A., Rohde J.-U., Seo M. S., Sastri C. V., DeHont R., Stubna A., Ohta T., Kitagawa T., Münck E., Nam W., Que Jr L. J. Am. Chem. Soc. 2008;130:12394–12407. doi: 10.1021/ja8022576. [DOI] [PMC free article] [PubMed] [Google Scholar]
- (a) Atkins P. W., Overton T. L., Rourke J. P., Weller M. T. and Armstrong F. A., Shriver & Atkins' Inorganic Chemistry, Oxford University Press, New York, 5th edn, 2010, pp. 527–529. [Google Scholar]; (b) Taube H. Science. 1984;226:1028–1036. doi: 10.1126/science.6494920. [DOI] [PubMed] [Google Scholar]
- Fukuzumi S., Kotani H., Prokop K. A., Goldberg D. P. J. Am. Chem. Soc. 2011;133:1859–1869. doi: 10.1021/ja108395g. [DOI] [PubMed] [Google Scholar]
- (a) Yokoyama A., Ohkubo K., Ishizuka T., Kojima T., Fukuzumi S. Dalton Trans. 2012;41:10006–10013. doi: 10.1039/c2dt30424d. [DOI] [PubMed] [Google Scholar]; (b) Ohzu S., Ishizuka T., Hirai Y., Jiang H., Sakaguchi M., Ogura T., Fukuzumi S., Kojima T. Chem. Sci. 2012;3:3421–3431. [Google Scholar]
- Kojima T., Nakayama K., Ikemura K., Ogura T., Fukuzumi S. J. Am. Chem. Soc. 2011;133:11692–11700. doi: 10.1021/ja2037645. [DOI] [PubMed] [Google Scholar]
Associated Data
This section collects any data citations, data availability statements, or supplementary materials included in this article.


