

Abstract
Neoplasms change over time through a process of cell-level evolution, driven by genetic and epigenetic alterations. However, the ecology of the microenvironment of a neoplastic cell determines which changes provide adaptive benefits. There is widespread recognition of the importance of these evolutionary and ecological processes in cancer, but to date, no system has been proposed for drawing clinically relevant distinctions between how different tumours are evolving. On the basis of a consensus conference of experts in the fields of cancer evolution and cancer ecology, we propose a framework for classifying tumours that is based on four relevant components. These are the diversity of neoplastic cells (intratumoural heterogeneity) and changes over time in that diversity, which make up an evolutionary index (Evo-index), as well as the hazards to neoplastic cell survival and the resources available to neoplastic cells, which make up an ecological index (Eco-index). We review evidence demonstrating the importance of each of these factors and describe multiple methods that can be used to measure them. Development of this classification system holds promise for enabling clinicians to personalize optimal interventions based on the evolvability of the patient’s tumour. The Evo- and Eco-indices provide a common lexicon for communicating about how neoplasms change in response to interventions, with potential implications for clinical trials, personalized medicine and basic cancer research.
Neoplasms evolve1–3. This evolution has been recognized since 1976 (REF. 4), and it explains the processes of both carcinogenesis and acquired therapeutic resistance1. The evolution of neoplasms is shaped by the selective pressures of their microenvironmental ecology. But between and within cancer types, tumours probably display differences in the dynamics of cancer evolution and ecology, including the rates at which new clones appear and go extinct, how different those clones are from one another and whether they appear in bursts or at a more regular pace. Many of the evolutionary and ecological properties of a neoplasm are clinically relevant5–16, though this is not always true6,16,17, and in most cases their clinical relevance has not yet been tested. There is a need for a common language and conceptual categories for drawing clinical distinctions that capture the relevant genetic, environmental and kinetic parameters that impact tumour adaptation and progression, as well as response to therapy. A classification system for the evolution and ecology of neoplasms would provide clinicians and researchers with a foundation for developing better prognostic and predictive assessments of tumour behaviour, such as response to an intervention.
The ultimate purpose of a classification system for the evolution and ecology of neoplasms is to provide a descriptive tool by which to improve clinical management with respect to the overall survival and quality of life of the patient. It would also help to drive research and discovery in cancer biology and oncology.
Below, we discuss the methods by which we reached consensus as well as the goals and guiding principles we aspired to in the development of a framework for classifying neoplasms. We then discuss each of the components of the classification system as well as methods for measuring them and for dividing tumours into an initial set of 16 classes. We discuss how such a classification system could be developed, improved and used clinically in the future.
Methods
We convened a consensus conference of experts in the fields of cancer evolution and cancer ecology to lay the groundwork for the development of an evolutionary and ecological classification system. The initial participants (Maley, Aktipis, Graham, Sottoriva, Boddy, Janiszewska, Silva, Gerlinger, Anderson, Brown and Shibata) were among the faculty for the Evolution and Ecology of Cancer summer school funded by Wellcome and held at the Wellcome Genome Campus in Hinxton, UK, in July of 2016. Input from all participants was solicited, and after discussion, we identified areas of consensus. Afterwards, other leaders in the field were invited to join the effort by co-editing and discussing the developing statement. All authors reviewed and approved the final statement. Wellcome Genome Campus Advanced Courses and Scientific Conferences provided financial support for the consensus meeting. We have named the classification system, with their permission, in appreciation of Wellcome’s support. Please note that the statement reflects the opinions of the authors and not necessarily those of Wellcome.
Goals and guiding principles
Our development of this framework has been guided by several goals and principles. We agreed that an ideal classification system should have the following properties. First, it must be able to alter a clinical decision point. Second, it should be simple enough to be easily remembered and applied. Third, it should also align with our current understanding of the dynamics of neoplasms. Fourth, the classification system should be general enough to be applied across different types of neoplasm, recognizing that the types of measurement may need to be individualized to a given type of cancer.
This framework is based on fundamental theoretical principles underlying evolutionary and ecological dynamics. It is not based on any particular assay or parameter but rather captures the fundamental drivers of tumour evolution. This is a necessary first step that we hope will lead to many methodological and measurement innovations to quantify the key components of tumour evolution and ecology that we identify here. Because the evolution of cancer is still a relatively new field, there is still uncertainty about the best ways to measure and describe the evolution and ecology of a tumour.
There are also practical considerations in the construction of a classification system. If a tumour could be classified based on a single biopsy from standard assays such as those that can be done on formalin-fixed paraffin-embedded (FFPE) tissue or standard radiological images, translation to the clinic would be relatively easy. However, studies have not yet been done to test whether measures of the evolvability of a tumour from a single biopsy sample are sufficient or whether multiple samples substantially improve predictions of clinical outcomes15. We hypothesize that we will need to extensively sample neoplasms over both space and time in order to accurately quantify their evolvability, but this remains an open question. It is clear, however, that evolutionary analyses are limited if the clonal structure of the primary tumour is unknown18. The use of cell-free DNA (cfDNA) from liquid biopsy samples should facilitate longitudinal studies19, although deconvoluting the clones within such a mixed sample remains a challenge20.
Framework for classifying tumour evolution
There are many well-established ways to classify tumours, largely based on extent of spread and morphological appearances (for example, stage and grade). An evolutionary classification system would augment current schemes by further capturing the evolvability of a tumour. How much intrinsic genetic instability does it have? How likely is it to respond quickly to a new selective pressure such as a therapeutic intervention? For example, rapid progression after chemotherapy is probably driven by pre-existing resistant variants, and therefore, failure is more likely in tumours with more subclonal diversity (intratumoural heterogeneity)6. Moreover, it would be useful to classify evolution through time. For example, a second biopsy from the same patient after therapy may reveal minimal diversity, indicating a recurrent tumour derived from a single clone, or substantial diversity, suggesting intrinsic resistance by the majority of tumour cells. There was widespread agreement at the consensus conference that both the evolutionary dynamics of the neoplastic cells themselves (cancer cell intrinsic factors) and the microenvironment that defines the ecology of those cells (cancer cell extrinsic factors) are important in predicting the future behaviour and response of a tumour. To capture this, we have developed a framework for both an evolutionary index (Evo-index) that describes the intrinsic evolvability of the neoplastic cell population and an ecological index (Eco-index) that describes potential selective pressures imposed by the surrounding microenvironment.
The Evo-index
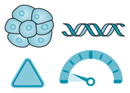
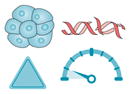
The Evo-index (D#Δ#) is a combination of two fundamental components: the diversity (D) or intratumoural heterogeneity of the neoplasm and how it changes over time (Δ). In other words, the Evo-index quantifies heterogeneity in both space and time (FIG. 1a). Both diversity and changes in the clonal structure of a tumour over time are objective measures and may be assessed as part of preclinical studies or clinical trials.
Figure 1. The Evo-index and how it changes.

a | The evolutionary index (Evo-index) is composed of two factors corresponding to heterogeneity over space (diversity, D) and heterogeneity over time (change over time, Δ). By ‘change’, we mean both change in the genetic, epigenetic and phenotypic alterations present in the population and change in the frequencies of those alterations in the neoplastic cell population. What measures of D and Δ are best is an open question. In addition, how these factors should be stratified into two, three or more classes is also an open question. Here, for simplicity, we provide examples of the kinds of dynamics that could be categorized into a simple 2 × 2 classification. b | The genetic composition of a tumour may change either slowly (Δ1) or rapidly (Δ2) in a variety of ways. On the left, a tumour may have low diversity (D1) at time 0 because it is a new tumour or there has been a recent homogenizing clonal expansion. That tumour may be quiescent and so appear substantially the same at time 1 (D1Δ1), or it may accumulate clones, some of which expand, to generate a diverse tumour by time 1 (D2Δ2). Alternatively, a tumour may be diverse (D2) at time 0 because it is old or has a high mutation rate and is evolving neutrally. At time 1, that tumour may have been homogenized by a selective sweep (D1Δ2) or may continue on its current trajectory with gradual turnover of its clones (D2Δ1).
Diversity
The heterogeneity that is currently present in a population defines its capacity to respond, at a population level, to selective pressures. This diversity is the fuel for the engine of natural selection. There are different forms of diversity, including genetic diversity, epigenetic diversity, phenotypic diversity and functional diversity. Genetic diversity can predict progression to invasive cancers12,13 as well as recurrence and survival5–9,16. The relationship between diversity and clinical outcomes is not universally consistent across different cancer types6,16 and can be complicated (BOX 1).
Box 1. Important issues in the measurement of diversity in neoplasms.
There are a number of important issues and open questions in the measurement of diversity in neoplasms: How are clones defined? What is the best measure of diversity? How do the measures scale up to genomic assays? Are there nonlinear associations between diversity and clinical outcomes? Is genetic or functional diversity more predictive? Is it sufficient to measure diversity in the primary tumour, or do we need to measure diversity in the metastases? Is it adequate to estimate diversity from bulk biopsy assays, or do we need to measure diversity at the single-cell level?
In order to measure diversity, one must first define the unit that is being measured. We typically cluster cells into clones, but there is currently no general definition of a clone. Typically, for expediency, clones are defined as the set of cells that share an alteration of interest, due to descent from a common ancestor cell. A more stringent definition of a clone is a set of cells that have the same genotype based on some assay12,13. However, that definition does not scale well to whole-genome assays because every neoplastic cell probably displays a unique genome. By contrast, measures of divergence between samples only become more accurate as assays scale up to the genomic level12–14,46. Another alternative would be to reconstruct the cell lineage (phylogeny) of a neoplasm and then define clones based on the topology of the cell lineage, although this is not straightforward. A similar problem has been addressed by viral and bacterial phylogenetics, and methods may be borrowed from these fields167,168.
It is not clear which alterations should be used to measure diversity. Some forms of diversity, such as mutations in exons and copy number changes, may be more clinically relevant than other forms of diversity. However, Merlo and colleagues found that defining a clone based on selectively advantageous mutations and defining a clone based on evolutionarily neutral mutations both predicted progression to cancer13.
Instead of genetics, one could measure diversity based on RNA expression or other phenotypic characteristics169,170. Because selection acts on phenotypes, this may be a better predictor of a the evolvability of a tumour than genetic measures of diversity. Gatenby and colleagues have argued that because of this and the fact that there are many different genotypes that can produce the same phenotype, analysis at the phenotype level may be easier and provide a better measure of evolvability than analysis at the genotype level171,172. However, this hypothesis is controversial, and only a few studies have tested it173,174. Unfortunately, the literature on how to measure functional diversity remains poorly developed30.
The diversity of the primary tumour may differ from that of any metastases. Because the primary tumour is often removed and it is the metastases that kill patients, we may have to measure diversity within and between any metastases that can be sampled in order to best predict clinical outcomes2.
It is currently difficult to measure many loci or phenotypes at the single-cell level. Bulk sequencing or other assays at the biopsy level introduce significant biases. For example, recent mutations that are present in only a single cell or a small minority of cells are missed in bulk assays, biasing results to the early mutations and those mutations driving clonal expansion175. Preliminary analyses show that a mixture of clones within a biopsy sample can also mislead any analyses based on estimates of shared ancestry, such as phylogenetic reconstruction176. However, it is currently difficult to assay enough loci in enough single cells to reconstruct reliable cell lineages and identify rare clones177.
Diversity can be a proxy for the likelihood that a resistant clone is present in a neoplasm. We currently do not know all the mutations and epigenetic alterations that make a neoplastic cell resistant to a particular therapy, and even those we do know are difficult to detect if they are present in only a small region of the tumour. Compared with homogeneous neoplasms, diverse neoplasms are more likely to harbour resistant clones and are also probably more likely to evolve resistance in the future.
Multiple forms of diversity within a neoplasm may be clinically important, not only as fuel for natural selection but also as biomarkers of clinically targetable dynamics. For example, if high levels of genetic diversity are indicative of high levels of moderately deleterious passenger mutations21,22, then suppressing mechanisms in the cell that buffer against those deleterious effects, such as chaperone proteins, should preferentially harm neoplastic cells21. Alternatively, diversity may be indicative of cooperation between clones, through mechanisms such as cross feeding23–27. These mechanisms of cooperation are themselves potential therapeutic targets. Theory suggests that targeting cancer cell cooperation should provide weaker selection for resistance than cytotoxic therapies28.
It is likely that not all forms of diversity are equal, and future work must test which are clinically relevant. It may be the case that measures of functional diversity or even phenotypic diversity are better predictors of clinical outcomes than measures of genetic diversity (as many genetic mutations will have no phenotypic consequence), and the ideal measures may vary between tumour types.
Measuring diversity
Of the four components of the classification framework, the largest number of methods has been developed for measuring diversity (intratumoural heterogeneity)13,25,29 (TABLE 1). There is a large literature in ecology on the quantification of diversity30. The overall diversity of a large area, or landscape (gamma diversity), can be broken down into the diversity within local regions (alpha diversity) and the differences between regions (beta diversity)31. Inherent in this definition is the concept that measuring diversity requires defining the spatial scale that one is examining. One might define within-region diversity as the diversity measured within a biopsy sample, while between-region diversity would account for differences between biopsy samples in multi- region sampling studies. Alternatively, one could take a sample across an entire tumour, perhaps using cfDNA, and estimate the diversity of the entire population. Most of the studies to date have focused on within-region diversity5,6,32,33 or the diversity of the entire tumour12–14,25. The use of ecological statistics for measuring between-region diversity in tumours remains relatively unexplored. Established measures of differences between microbial communities34 could possibly be applied to measuring differences between biopsy samples.
Table 1.
Measures and assays for the factors that go into the Evo- and Eco-indices
| Icon | Factor | Statistics | Assays |
|---|---|---|---|
High Low 
|
Diversity (D) |
|
|
High Low |
Change over time (Δ) |
|
|
High Low 
|
Hazards (H) |
|
|
High Low 
|
Resources (R) |
|
Eco-index, ecological index; EF5, 2-(2-nitro-1-H-imidazol-1-yl)-N-(2,2,3,3,3-pentafluoropropyl) acetamide; Evo-index, evolutionary index; FISH, fluorescence in situ hybridization; FST, fixation index; MRI, magnetic resonance imaging; RNA-Seq, RNA sequencing; rRNA, ribosomal RNA; PET CT, positron emission tomography and computed tomography; SNP, singe nucleotide polymorphism.
There are many ways to measure diversity30 and a number of challenges to measuring diversity in neoplasms, as discussed in BOX 1. In Barrett oesophagus, Merlo and colleagues tested many of those measures of diversity and found that high levels of diversity were predictive of progression to cancer, regardless of the measure13,14. Because evolution is driven by the fitness outliers35, and it may take only one resistant cell at diagnosis to eventually cause drug resistance or relapse after therapy, much of the predictive value of measuring diversity may lie in the long tail of rare clones. Because of this, we recommend using either a count of the number of clones (‘species richness’) or Shannon index, which equally weights number and relative abundance of clones, to quantify diversity30.
The feasibility of obtaining a complete picture of the diversity of a neoplasm, through multi-region sampling or cfDNA, varies across tumour types. In Barrett oesophagus, bladder cancer and prostate cancer, multi-region sampling is part of the current standard of care36–38. In a well-mixed neoplasm, such as a blood cancer, a single sample may be sufficient, but it requires single-cell assays, which have their own challenges (BOX 1). In other tumours that are difficult to sample, such as pancreatic cancers, we are lucky to get more than one biopsy sample. The main challenge in using cfDNA is detecting it in serum for cancers that have not yet metastasized, although the level of tumour cfDNA in serum varies across cancer types. A recent study was able to detect tumour cfDNA in 97% of early-stage lung squamous cell carcinomas but only 19% of early-stage lung adenocarcinomas39.
The interpretation of the diversity of a neoplasm depends on the context of its history. A neoplasm that has just been homogenized by a therapy that killed most of the clones in that neoplasm is different from a neoplasm that is homogeneous because it has a very low mutation rate and has not had enough time to accumulate many clones. By contrast, a high level of diversity in a neoplasm that has just passed through a therapeutic bottleneck may be a sign that therapy selected for a mutator phenotype40. Because of this complication, we agreed that we must measure how neoplasms are changing over time as well as diversity.
Change over time
There are a variety of ways that a neoplastic cell population changes over time. These include mutations, natural selection and genetic drift. One important parameter of change over time is the mutation rate, which describes how fast a lineage accumulates new mutations. Of course, there are different mutation rates induced by each mechanism for genetic and epigenetic alteration, including mutation signatures induced by specific agents41 as well as telomere erosion, non-homologous recombination, other forms of chromosomal instability, CpG methylation and his-tone modifications. Which mechanisms are relevant will depend on individual tumours and may vary across the different clones within the same tumour.
When we talk about and measure mutation rates, we are implicitly assuming that mutations happen at a regular rate. Evolutionary biologists call these ‘molecular clocks’ (REF. 42). However, a catastrophic mitosis can generate chromosomal alterations across the genome in a single event43,44. There is a continuum from regular, gradual, clock-like small alterations to sporadic, punctuated, large alterations. For example, a lineage may evolve different mutation rates across its history, as happens with the evolution of a mutator phenotype45,46. If a cell lineage can change suddenly, in what used to be called a ‘macromutation’ generating a ‘hopeful monster’ (REF. 47), then that tumour may have a different capacity for evolution compared with a tumour that is constrained to evolve through the slow accumulation of mutations with small phenotypic effects. There is a large cancer literature on genetic instability that is relevant here48,49, and evidence has shown that tumours with extremely high mutation rates may have a better prognosis than tumours with moderate rates6,11,21,22,50. High levels of genomic instability may make it difficult for cell lineages to maintain the adaptive information encoded in their genomes, generating non-viable daughter cells, and may also produce an abundance of neo-antigens that stimulate an antitumour immune response6. Furthermore, high mutation rates of single nucleotide variants can generate deleterious mutations, leading to the fitness decline of neoplastic cell lineages in a form of Muller’s ratchet21,51. This may even cause tumour regression in some cases21,22.
The genetic composition of a population changes over time not only through the rate at which mutations arise and the genetic drift of those alleles but also through the action of natural selection. Natural selection leads to adaptations, such as drug resistance52, that are clinically relevant. Detecting and measuring natural selection is likely to be an important component of our future clinical management of cancers.
The classification of a neoplasm’s change over time (Δ) will probably need to take into account both the speed at which a tumour acquires genetic or epigenetic alterations, or changes phenotypically, including how fast clones spread by natural selection, as well as the tempo of that change (from gradual to punctuated). The appropriate intervals for longitudinal sampling will depend on the rate of change over time53. Note that neutral, or ‘passenger’, mutations should not be ignored in these calculations because selective pressures change over time, particularly with the onset of therapy. Thus, resistance mutations, which may be deleterious or neutral in the absence of therapy, can become selectively advantageous for neoplastic cells exposed to therapy54.
Measuring change over time
Measuring change over time is complicated, whether it is genetic or phenotypic change (TABLE 1). FIGURE 1b illustrates a simple version of how the Evo-index can describe evolutionary changes in tumour cell populations. It is possible for there to be change over time but for diversity to remain stable, with a dynamic equilibrium of clones appearing and going extinct14. For single samples, past genetic changes over time can be indirectly inferred based on mutation frequencies17,55. Sottoriva and Graham have pioneered methods to infer the mutation rate and to distinguish between tumours that are dominated by genetic drift versus those with evidence of natural selection after transformation. In the absence of selection, mutations that occur in the first cell division after transformation should appear in approximately one-half of all cancer cells, mutations that occur in the second round of cell division should appear in one-quarter of all cancer cells, and so on17,56.
There are a number of measures of genetic change over time from population genetics that might be used on neoplasms, including Nei’s standard genetic distance57,58 and the Jaccard similarity coefficient59, as well as measures of beta diversity that can also quantify changes in a community over time, such as UniFrac34 or the fixation index60. The degree of genetic divergence between samples (called ‘nucleotide diversity’ in molecular population genetics) provides indirect information on the degree of change over time. Genetic divergence is often defined as the percentage of the genome that is different between pairs of samples12–14. This statistic provides predictive power independent of the number of clones for predicting progression12,13, supporting the framework of including both diversity and change over time in the Evo-index. Note that the same clonal structure can have radically different degrees of genetic divergence (FIG. 2). Maley and colleagues have calculated a mean pairwise divergence score between all pairs of samples from a neoplasm12–14. As the chance that two samples come from the same clone (and so have minimal divergence) depends on the size of the clone, the mean pairwise divergence blends the degree of divergence with clone size measures (and so blends D with Δ).
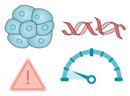
Figure 2. Clonal divergence is independent of clonal structure.

The cell lineages from two tumours may have the exact same clonal structure when they are sampled at the far right but have radically different degrees of genetic divergence. If one tumour (part a) has a higher mutation rate or has been accumulating genetic alterations for a longer period of time because those cells had a common ancestor, it will have a higher level of genetic divergence than another tumour (part b).
One of the primary tools for measuring change over time in evolutionary biology is phylogenetic inference, which reconstructs the history of a neoplasm61,62. Phylogenetic methods can be used to describe and quantify diversity patterns as well as rates of evolution across both space and time. Multiple phylogenetic approaches have been developed in recent years to study tumour evolution within a patient, both for bulk and single-cell data and from a variety of data types20,63. These methods depend on evolutionary models for the likelihood of molecular alterations occurring in neoplastic cell lineages, although the development of these models is still in its infancy.
All of the measures discussed so far can be calculated from a single timepoint. Of course, the degree and nature of change over time can be better measured directly with longitudinal samples. Minimally invasive assays, such as sequencing cfDNA from longitudinal blood samples, could reveal the action of natural or artificial selection in patients.
Incorporation of the Evo-index into clinical trials can better describe, in evolutionary terms, why interventions fail. Most human tumours at the time of clinical presentation contain multiple large clones6,16 and probably many more small clones64,65, and relapse without a reduction in diversity would probably imply intrinsic resistance or perhaps that an intervention resulted in increased mutagenesis. By contrast, relapse with less diversity (D1) implies a bottleneck effect where only a minority of tumour cells survived the intervention, probably indicating selection for one or a few resistant clones.
The Eco-index
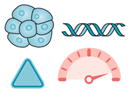
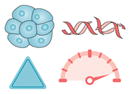
From the perspective of an organism or a neoplastic cell, its ecology can be broadly described by two characteristics: hazards (H) and resources (R)66–69 (FIG. 3). Hazards, here, are the things that can kill a cell. The relevant resources required for cell maintenance and growth are many and varied; whatever may potentially limit the growth of the neoplastic cell population66. Note that hazards and resources here are understood from the perspective of the neoplastic cell, not the patient. This is an important point from ecology —we can understand the evolution and responses of a population best when we take the perspective of an organism in that population70.
Figure 3. The Eco-index.

sThe ecological index (Eco-index) is composed of two factors corresponding to the hazards (H) and resources (R) available to the neoplastic cells. These capture the broad categories of selective pressures on a population. We have included example phenomena in this figure that might be observed in the different combinations of the degrees of hazards and resources. For example, a tumour with low hazards (H1) and low resources (R1) might be relatively barren, with few infiltrating lymphocytes but also poor perfusion and few supporting cells. Such an environment would select for cells that can either survive on few resources or move to locate more resources. High levels of hazards (H2) should, according to life history theory71, select for rapid proliferation, evasion of predation, migration away from the hazards67 and little investment in cell (and DNA) maintenance. High levels of resources allow neoplastic cells to rapidly proliferate. Thus, an H2R2 tumour would probably undergo massive cell turnover as cells are killed by the hazards and replaced by their rapidly proliferating sisters.
From an ecological perspective, the hazard and resource profiles for a species select for the particular life history strategies of that species. Aktipis and colleagues argued that the same principles are true for neoplastic cells71. Species that are exposed to high levels of hazard tend to evolve fast life history strategies, reproducing quickly and investing little in maintenance and survival. Organisms subjected to hazards generally leave behind higher levels of unexploited resources. Ecosystems with high or fluctuating resource supplies favour organisms that can rapidly reproduce to exploit those opportunities. This selects for speed over efficiency and can result in very high population densities but also fluctuating levels of unexploited resources. By contrast, populations that have few hazards and a steady supply of resources will tend to expand to the carrying capacity of the habitat, at which point natural selection favours organisms that can best compete for and efficiently utilize the limiting resources72. The heterogeneity of resources and hazards across space also has important impacts on the future evolution of cancer cell populations and prognosis for patients73,74.
Hazards
There are multiple sources of hazards for neoplastic cells, including immune cells, toxins, waste products, microorganisms and anticancer therapies. There is good evidence that immune predation is associated with improved cancer prognosis73,75–83. Furthermore, there is emerging evidence linking high mutation loads that result in the formation of neo-antigens with immune predation and better survival in patients treated with immune checkpoint blockade therapies84–86. In addition, a high subclonal neo-antigenic burden is associated with worse outcomes in lung cancer when patients are treated with checkpoint inhibitors87. These data suggest that subclonal neo-antigens might impede cytotoxic immune responses against neo-antigens that are present in every tumour cell.
Other hazards faced by neoplastic cells include the accumulation of waste products in their micro-environments67,69,88,89. This may include lactic acid and lactate build-up from glycolysis88,90 as well as reactive oxygen species from excessive cellular proliferation91. Methylglyoxal92,93, nitric oxide94,95 and advanced glycation end products96,97 have also been implicated as toxic waste products in cancer microenvironments.
The role of the microbiome in cancer is complicated and largely unknown. While some microorganisms may promote tumours98,99, others have antitumour effects98, enhancing the efficacy of chemotherapy100. Thus, micro-organisms may act as both resources and hazards for neoplastic cells.
Measuring hazards
The current best measures of hazards for a neoplastic cell depend on measures of immune predation (TABLE 1). There is a large literature on the association between infiltrating lymphocytes and favourable prognosis in cancer73,75–83. In addition, a pan-cancer analysis revealed T cell signatures to be broadly favourable prognostic markers across 25 cancer types101. Galon and colleagues have found that a signature of activated T cells from bulk tumour samples is also strongly predictive of favourable survival76–78,83. Yuan and colleagues have shown that haematoxylin and eosin images can be computationally analysed to identify neoplastic cells, fibroblasts and lymphocytes and, furthermore, that patients with breast cancer who show colocalization of neoplastic cells with lymphocytes in the tumour have a better prognosis than patients with tumours in which the lymphocytes are separated from the neoplastic cells75. This is based on a standard ecological statistic, the Morisita–Horn index102, for quantifying statistically significant colocalization in order to detect ecological interactions (in this case, predation). These results suggest that immune predation is a major form of hazard for a neoplastic cell, and measures of that predation should be a central component of the ecological index.
While much research has investigated the potentially toxic effects of low pH (REFS 103,104), fewer studies have examined the fitness consequences to cancer cells from various metabolites. Future research should determine the effects of different concentrations of putative toxic metabolites on cancer cell survival and proliferation in both cell culture experiments and mouse models. Measurements of anticancer drug concentrations in the tumour are also likely to quantify important hazards for the neoplastic cells. In addition, the microbiome (including the virome) of tumours can be surveyed to reveal microbial hazards for the neoplastic cells105.
Resources
Resources, including oxygen, glucose, micronutrients, survival signals, growth signals and space, are also critical to the future behaviour of a tumour. Surprisingly little is known about the interactions between cell metabolism and the availability of key resources, which ecologists term the organism’s ‘foraging ecology’. Almost all cancers rely on glycolytic as opposed to aerobic metabolism, suggesting that resources can select for tumour phenotypes106,107. From nature, we know that selection favours feeding behaviours that balance speed, efficiency and safety108. There must be strong selection for cancer cells to do the same (for example, through upregulation of transporters such as glucose transporter type 1, erythrocyte/brain (GLUT1, also known as SLC2A1)109). Measuring which resources limit the population size and proliferation of neoplastic cells would allow researchers to identify some of the strongest selective pressures on the tumour and to predict how it will change in the future. This approach would also provide targets for further reducing the evolvability of the neoplasm by lowering the carrying capacity of its microenvironment.
In the broader ecological literature, consumer–resource theory110 shows that resource supply, depletion and availability affect population growth rates, population sizes and competition between different species (that is, distinct clonal lineages). Resource supply represents the rate at which new resources enter the system (in this case, the tumour) and the rate at which resources become available through nutrient cycling within the system. The aggregate consumption of all cells depletes the resources, typically to levels much lower than experienced by normal tissues111. In fact, glucose becomes depleted below levels detectable by most analyses112. However, in some cases, immune predation and fluctuations in resource supply can prevent the complete exploitation of resources113,114, leaving patches of residual resources available for future exploitation115.
The potential resources for a tumour include the contents of plasma and the metabolites synthesized and secreted by the normal cells of the tumour and its microenvironment. Hence, the list includes proteins (albumins, globulins and fibrinogens), glucose, amino acids, fatty acids, hormones, electrolytes, oxygen and trace elements. The functional response and the value of the resources to the consumer are dictated by nutritional relationships116. In some cases, lack of a resource may trigger stasis, but in others, it may lead to cell death or dispersal117. At the moment, there are many open questions about the intratumoural cycle of critical nutrients other than carbon and nitrogen (that is, phosphate, iron, copper, etc.)118. These nutrient cycles may contain valuable therapeutic targets.
Some resources, particularly growth and survival signals, may be provided by the neighbouring stromal cells119,120. Nutrients may also be provided by the stroma. Pyruvate and lactate can be supplied to cancer cells by activated fibroblasts121,122, and fatty acids may be supplied by activated adipocytes123,124. Tumour and stroma only come into physical contact when the basement membrane is breached by malignant neoplastic cells. At this stage, cancer cells can directly interact with cancer-associated fibroblasts, which are known to play a key role in the regulation and development of tumours, especially solid tumours120,125. In this secretory reactive state, fibroblasts facilitate not only cancer growth and progression126,127 but also treatment resistance128. In addition, their presence in a tumour has been correlated with poor outcomes129.
Other resources must be delivered through the vasculature. Folkman made the crucial link between angiogenesis and tumour invasion and metastasis, realizing that preventing new vessels from forming could be a simple way to inhibit further tumour growth130,131. The presence in many tumours of necrosis and hypoxia, which are major drivers of angiogenesis, attests to the importance of resource limitation in tumours. Furthermore, there is evidence that necrosis is a prognostic factor in many cancers132.
The effects of resources on the evolution of a tumour are not defined simply by their supply, depletion and availability. Resource diversity may also be important. Whether resources are uniform across space or heterogeneous (‘patchy’ or exhibiting gradients) makes a difference67,133. Patchy resources (and hazards) create multiple habitats (for example, rich and sparse regions) that may select for different clones that can survive in those regions and may be differentially responsive to (and differentially exposed to) therapies. Furthermore, we and others have shown that if those patchy resources change over time, then there is selective pressure on cells to move to escape regions of scarce resources and exploit transient regions of more plentiful resources67,113,114,134–136. Thus, ecological theory predicts that heterogeneous resources should select for invasion and metastasis134,135, and there is evidence to support that prediction in cancer137–143. Verduzco and colleagues found that intermittent exposure of some cell lines to hypoxia selected for increased resistance to a variety of chemotherapies, including etoposide, docetaxel and methotrexate, compared with unselected controls144. In addition, resource gradients often lead to rapid evolution, as organisms that are able to invade more stressful environments can escape competition and flourish145. Much needs to be learned about resource heterogeneity, consumer–resource dynamics and the foraging ecology of neoplastic cells.
Measuring resources
Measuring resources (and hazards) requires the consideration of relevant spatial and temporal scales. It is not yet clear how to combine measures of the level of resources, their spatial variance and their stability over time into a single statistic.
There are various resources and methods to measure them that may be prognostically relevant (TABLE 1). The proportion of a tumour that is necrotic or poorly perfused may be read from standard positron emission tomography and computed tomography (PET–CT) images146 and through other measures of blood vessel density147,148. The degree and patchiness of hypoxia can also be assayed in FFPE samples with antibodies against carbonic anhydrase 9 (CA9) or hypoxia-inducible factor 1α (HIF1α)115 or via intravenous introduction of 2-(2-nitro-1-H-imidazol-1-yl)-N-(2,2,3,3,3- pentafluoropropyl) acetamide (EF5) and the subsequent measurement of its binding in the tumour tissue149. EF5 binding and related techniques have proved useful in the clinic for detecting regions of hypoxia, determining prognosis and measuring response to therapy150. While it is difficult to measure glucose concentration directly, an indirect measure may be made via immunohistochemistry staining for expression of GLUT1115. Measures of ATP may also be a good indirect measure of the amount of resources available to neoplastic cells151. Glutamine, pyruvate, lactate, fatty acids, calcium, potassium, phosphorus and various trace metals may also be limiting and important to measure, but this appears to be unexplored. Most of these measures will be limited to biopsy samples analysed ex vivo and thus will suffer the problems of spatial heterogeneity and sampling error.
In some cases, the problem of spatial heterogeneity and sampling error can be avoided through gross measures of resources from radiological images152–154 Radiographic images such as those obtained using PET–CT and magnetic resonance imaging (MRI) can provide valuable habitat data. In natural systems, there is usually a tight correlation between habitat and the types and characteristics of species inhabiting the habitat. Similarly, simply knowing the different habitat types within a tumour may be prognostic of the community of cancer cells and therapeutic outcomes. For instance, in glioblastoma, measures of fluid-attenuated inversion recovery (FLAIR), T1 and T2 from MRI examinations after gadolinium administration identified distinct habitats that correlated with therapeutic outcome, independent of tumour size153. Texture analysis of MRI scans has been used to identify spatial heterogeneity and regional variations that are associated with microenvironmental conditions, including cell density, tissue stiffness, blood flow and nutrient dispersion152,154. These may also be used to measure functional diversity (D) in tumours. Geographic information systems (GIS)155–157 and ecology158 provide a rich literature and a source of tools for analysing spatial resource information, but these are rarely utilized in cancer research73,74.
Standard histopathology can provide measures of T cell infiltration and vascular and lymphatic density77. Using digital pathology, Lloyd et al. investigated the spatial distributions of oestrogen receptor (ER) expression in relation to vascular density and tissue necrosis in breast cancer histology specimens, revealing considerable regional variations in cancer proliferation phenotypes accompanied by vascularity and immune response115,159. Yuan and colleagues also used digital pathology to analyse the spatial relationships between fibroblasts and neoplastic cells160. We have summarized the statistics and assays for measuring diversity, change over time, hazards and resources in TABLE 1.
Categories of tumours
The future behaviour of a tumour depends on both its evolutionary potential (the Evo-index) and the selective pressures on the tumour (the Eco-index). A highly evolvable tumour may or may not evolve immune evasion depending on whether the immune system is imposing a strong selective pressure on the tumour. By contrast, an immune response may or may not lead to immune evasion depending on the evolvability of the tumour. Thus, both the evolution and ecology of a tumour must be considered in predicting cancer outcomes. We therefore propose to combine the Evo- and Eco-indices to classify tumours. Dichotomizing each evolutionary and ecological factor of the Evo- and Eco-indices into high and low values would produce 16 possible types of tumour (TABLE 2).
Table 2.
An initial classification scheme
| Type | Icon | Evo-index | Eco-index | Description |
|---|---|---|---|---|
| 1 |
|
D1Δ1 | H1R1 | Like a desert, these tumours have few resources and little diversity. With low turnover, they are evolutionarily inert. |
| 2 |
|
D1Δ1 | H1R2 | Much like normal tissue, these tumours have sufficient resources but evolve very slowly. |
| 3 |
|
D1Δ1 | H2R1 | These tumours may have the best prognosis, with an immune response that probably helps to control the tumour, restricted resources and little capacity to evolve. |
| 4 |
|
D1Δ1 | H2R2 | These tumours have ample resources but have also stimulated an antitumour immune response. However, they are otherwise evolutionarily inert. |
| 5 |
|
D1Δ2 | H1R1 | These tumours are genetically homogeneous but are changing over time, perhaps through population bottlenecks or selective sweeps that re-homogenize the tumour. |
| 6 |
|
D1Δ2 | H1R2 | These tumours are changing over time, potentially through homogenizing selective sweeps of new clones. While they may grow rapidly, with ample resources, their genetic homogeneity may make them vulnerable to therapy. |
| 7 |
|
D1Δ2 | H2R1 | Predation by the immune system in these tumours may reduce genetic heterogeneity through selection against neo-antigens. |
| 8 |
|
D1Δ2 | H2R2 | Natural selection may be driving the changes in these tumours and homogenizing them. |
| 9 |
|
D2Δ1 | H1R1 | These tumours may be the result of the slow accumulation of clones over a long period of time or from exposure to mutagens. |
| 10 |
|
D2Δ1 | H1R2 | Like a garden, these tumours support a variety of clones, are well fed and are protected from hazards such as predation, but they change little over time. |
| 11 |
|
D2Δ1 | H2R1 | Accumulation of many mutations may have led to an immune response in these tumours, but they appear to be otherwise restricted in their growth and evolution. |
| 12 |
|
D2Δ1 | H2R2 | These genetically diverse tumours are changing only slowly, perhaps due to a low mutation rate or relatively weak selective pressures. |
| 13 |
|
D2Δ2 | H1R1 | These tumours are evolving rapidly, generating and maintaining new clones at a high rate. They are probably under selective pressure for the ability to survive and proliferate with scarce resources or otherwise escape these resource constraints. |
| 14 |
|
D2Δ2 | H1R2 | With potentially the worst prognosis, these genetically diverse tumours are evolving rapidly and have plenty of resources. They should have the highest capacity to evolve in response to interventions or other changes in their environment. |
| 15 |
|
D2Δ2 | H2R1 | These rapidly evolving and diverse tumours are under the dual selective pressures of resource limitations and immune predation. |
| 16 |
|
D2Δ2 | H2R2 | Like a rainforest, these genetically diverse tumours are changing rapidly, with a constant churn of new clones evolving and others going extinct. Resources are abundant, although they are probably being consumed rapidly, and predation from the immune system is extensive. |
D, diversity; Δ, genetic, epigenetic or phenotypic change over time; Eco-index, ecological index; Evo-index, evolutionary index; H, hazards; R, resources.
In order to classify a tumour, investigators will first need to define and validate clinically relevant thresholds for dichotomizing diversity, change over time, hazards and resources (TABLE 1). For example, in Barrett oesophagus, Maley and colleagues found that the upper quartile of diversity statistics distinguished patients who are likely to progress to oesophageal adenocarcinoma12–14. Once those thresholds are validated, a tumour would be measured for each of the four evolutionary and ecological factors to determine which of the 16 types it falls into. For example, if a tumour was below the thresholds for all four factors (that is, a D1Δ1H1R1 tumour), it would be a type 1 tumour.
A roadmap for improvements
We are not yet in a position to specify which measures and thresholds should be used to determine the D#Δ# or H#R# type of a tumour. Initial studies should test if these classifications significantly predict clinical outcomes and which evolutionary and ecological measures provide independent predictive value. They should also test if there are measures that can apply across cancer types or if they have to be uniquely defined for specific organs or tumour subtypes. Future studies should test alternative measures of diversity, change over time (BOX 2), hazards and resources to help standardize useful metrics for the classifications. They should also quantify the improvements to prognosis gained by sampling multiple regions at multiple timepoints.
Box 2. The future of the Evo-index.
Our framework for quantifying the evolvability of a neoplasm is based on the diversity within the tumour and how that diversity changes over time. Diversity and genetic change over time are the easily observable results of the underlying evolutionary dynamics. A future evolutionary index (Evo-index) may be based on the parameters that determine the rates of evolution15:
Population size of the self-renewing neoplastic cells (also known as ‘cancer stem cells’), which are the units of evolutionary selection in cancer3
Generation time of the self-renewing neoplastic cells
Heritability of selectively advantageous phenotypes
Most of these parameters are currently difficult to measure. However, there is already good evidence that the number of self-renewing cells in a tumour is associated with adverse outcomes180,181, that self-renewing cell frequency increases with progression182,183 and that self-renewal signalling pathways are actionable and effective targets for therapy184,185. This is probably true for all types of tumour. Assaying self-renewing cells functionally (by xenotransplantation) is difficult, but quantifying stem cell signatures is possible. However, stem cell phenotypes are not stable and can be modulated both by genetic changes and (epigenetically) by ecological conditions (for example, hypoxia)3, suggesting that the importance of any one parameter is also a function of its heritability.
The ecology of a tumour affects its evolution, and the evolution of the cells in a tumour change their ecology. Neoplastic cells evolve genomic instability161, generating neo-antigens as well as adaptations, such as recruitment of resources, through activating fibroblasts162 and neo-angiogenesis161. Evolution of neo-antigens triggers immune predation, which may reduce diversity and select for immune evasion163. High levels of extrinsic mortality and resources select for rapid proliferation with little investment in somatic maintenance71. These interactions imply that not all possible combinations of ecological and evolutionary measurements are equally likely. We will probably be able to drop some of the 16 possible tumour types in TABLE 2 and focus on the subset of classes that present in the clinic.
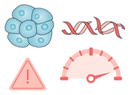
The framework for a classification system that we have proposed could be incorporated into clinical trials, which could allow us to gather data on how the different types of evolving tumour respond to different types of intervention (FIG. 4). Clinical trials could then be developed to stratify treatment of patients based on the Evo- and Eco-indices of their tumours. We could use the results to develop guidelines for best practice in managing cancers.
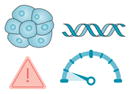
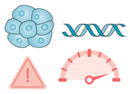
Figure 4. Changing the evolutionary class of a tumour through interventions.

With the classification system outlined in TABLE 2, we could examine how different interventions move tumours between categories. a | In this example, chemotherapy can be mutagenic and can select for hypermutator clones, generating new clones and more diversity40,186,187. It can also kill endothelial cells and thus have an anti-angiogenic effect188, resulting in a tumour (type 13) with one of the worst predicted prognoses. This may partly explain why tumours that recur after chemotherapy are so difficult to control. b | Immunotherapy, if successful, may increase the predation hazards to the tumour and perhaps select for a subclone, reducing diversity. Targeted therapy, unlike chemotherapy, probably does not cause significant DNA damage and may further genetically homogenize the tumour. Anti-angiogenic therapy is designed to restrict the resources of the tumour. At the end of this example sequence, the tumour is in the most manageable, least evolvable category (type 3 in TABLE 2). Of course, chemotherapy, immunotherapy and targeted therapy may have different effects depending on the details of those therapies and their interaction with the clones in the tumour and their ecosystem.
Vision of the future
In the future, the pathology report for a neoplasm could include its Evo-index and Eco-index classifications. Ideally, these classifications would provide ‘chessboard’-like scenarios where, based on the current evolutionary class of a tumour, one could anticipate how the tumour type will change with different possible therapeutic moves (FIG. 4). Clinicians would then be able to choose appropriate interventions for the evolvability of those neoplasms and would also be able to track whether the neoplasms change substantially in response to interventions. A D1Δ1 tumour or even a D1Δ2 tumour would be a prime candidate for aggressive therapy with curative intent. In fact, a D1Δ1 tumour may be so evolutionarily indolent as to not require any form of intervention. On the other hand, a D2Δ2 tumour is likely to have multiple resistant sub-clones present at diagnosis, and future clinical trials should test if such a tumour can be managed through strategies that minimize the expansion of resistant sub-clones by exploiting their disadvantage in competition with sensitive subclones164. A legitimate clinical strategy might be to down-stage a tumour from a highly evolvable one to a much more clinically manageable class that could be contained in a non-lethal state indefinitely (FIG. 4b). If validated, the Evo- and Eco-indices could be used as surrogate measures for overall survival or disease-free survival.
Conclusions
The evolutionary biology of cancer is, clinically, in a similar state to psychiatry in the nineteenth century. At that time, there was no standard classification system for mental illness used by practitioners. Without such a classification system, it was difficult to even talk about the illness, let alone make progress, as a common language was lacking. With the American Medical Association’s Standard Classified Nomenclature of Disease published in 1933 (REF. 165) and the first Diagnostic and Statistical Manual of Mental Disorders published in 1952 (REF. 166), no matter how flawed they were, diagnoses of mental disorders became standardized, which facilitated studies to refine both the classifications as well as the treatment of those disorders. Studies based on the same classification system were then comparable, which further facilitated meta-analyses and overall progress in the field.
We have diagnostic categories for types of tumour based on their tissue of origin and staging, as well as some molecular markers, but we have lacked a system for classifying the evolvability and ecology of a tumour, which help determine how it will respond to interventions and how it might best be managed. Evolutionary oncology requires a shared lexicon upon which to base discovery. We reached consensus on the proposed framework for a classification system to characterize evolutionary differences between tumours that is applicable across all cancer types. Importantly, an evolutionary classification system will facilitate future efforts to study this fundamental property of tumours to reveal implications for treatment.
Acknowledgments
The consensus conference was supported by Wellcome Genome Campus Advanced Courses and Scientific Conferences. C.C.M. is supported in part by US NIH grants P01 CA91955, R01 CA149566, R01 CA170595, R01 CA185138 and R01 CA140657 as well as CDMRP Breast Cancer Research Program Award BC132057. M.J. is supported by NIH grant K99CA201606. K.S.A. is supported by NCI 5R21 CA196460. K. Polyak is supported by R35 CA197623, U01 CA195469, U54 CA193461, and the Breast Cancer Research Foundation. K.J.P. is supported by NIH grants CA143803, CA163124, CA093900 and CA143055. D.P. is supported by the European Research Council (ERC-617457- PHYLOCANCER), the Spanish Ministry of Economy and Competitiveness (BFU2015-63774-P) and the Education, Culture and University Development Department of the Galician Government. K.S.A. is supported in part by the Breast Cancer Research Foundation and NCI R21CA196460. C.S. is supported by the Royal Society, Cancer Research UK (FC001169), the UK Medical Research Council (FC001169), and the Wellcome Trust (FC001169), NovoNordisk Foundation (ID 16584), the Breast Cancer Research Foundation (BCRF), the European Research Council (THESEUS) and Marie Curie Network PloidyNet. T.A.G. is a Cancer Research UK fellow and a Wellcome Trust funded Investigator. E.S.H. is supported by R01 CA185138-01 and W81XWH-14-1-0473. M. Gerlinger is supported by Cancer Research UK and The Royal Marsden/ICR National Institute of Health Research Biomedical Research Centre. M.Ge., M.Gr., Y.Y., and A.So. were also supported in part by the Wellcome Trust [105104/Z/14/Z]. J.D.S. holds the Edward B. Clark, MD Chair in Pediatric Research, and is supported by the Primary Children’s Hospital (PCH) Pediatric Cancer Research Program, funded by the Intermountain Healthcare Foundation and the PCH Foundation. A.S. is supported by the Chris Rokos Fellowship in Evolution and Cancer. Y.Y. is a Cancer Research UK fellow and supported by The Royal Marsden/ICR National Institute of Health Research Biomedical Research Centre. E.S.H. was supported in part by PCORI grants 1505–30497 and 1503–29572, NIH grants R01 CA185138, T32 CA093245, and U10 CA180857, CDMRP Breast Cancer Research Program Award BC132057, a CRUK Grand Challenge grant, and the Breast Cancer Research Foundation. A.R.A.A. was funded in part by NIH grant U01CA151924. A.R.A.A., R.G. and J.S.B. were funded in part by NIH grant U54CA193489. The findings, opinions and recommendations expressed here are those of the authors and not necessarily those of the universities where the research was performed, Wellcome or the National Institutes of Health.
Glossary
- Clones
Sets of cells that share an alteration of interest due to descent from a common ancestor cell.
- Selective sweep
The spread of a mutation through a population due to natural selection.
- Phenotypic diversity
The variety of different cellular states present in a population of cells.
- Functional diversity
The variety of life history strategies present in a population of cells.
- Genetic drift
Change in allele frequencies due to sampling error of gene copies from one generation to the next. Genetic drift is stronger in smaller populations.
- Muller’s ratchet
Accumulation of deleterious mutations in asexual populations. This accumulation is irreversible because in asexual populations, deleterious mutations cannot be purged through recombination.
- Nei’s standard genetic distance (DS).
A measure of the genetic divergence between species or populations given their respective allele frequencies. When the mutation rate is constant, DS increases linearly with time, from zero to infinity. In a multiregional or longitudinal sequencing study, it would quantify the amount of genetic divergence between two regional or temporal biopsy samples.
- Jaccard similarity coefficient
The proportion of species or clones that are present in both regions compared with the number of species or clones observed in the union of both regions.
- UniFrac
A measure of the difference between biological communities that takes into account the phylogenetic distances (relatedness) between community members as well as their relative abundances.
- Fixation index (FST).
A population genetic measure that estimates the proportion of global genetic variability that can be explained by population structure. In a multiregional sequencing study, it would quantify how much of the intratumoural heterogeneity is due to differences between regional biopsy samples.
- Life history strategies
Relative investments in and mechanisms of growth, reproduction and survival of specific organisms or cells.
- Morisita–Horn index
A statistic for measuring the extent to which two species tend to co-occur in the same locales.
- Selective coefficients
The relative differences in fitness between genotypes.
Footnotes
Author contributions
All authors researched data for the article, made substantial contributions to the discussion of the article content, and reviewed and edited the article before submission. C.C.M. and J.S.B. wrote the majority of the article.
Competing interests statement
The authors declare no competing interests.
Publisher’s note
Springer Nature remains neutral with regard to jurisdictional claims in published maps and institutional affiliations.
References
- 1.Greaves M, Maley CC. Clonal evolution in cancer. Nature. 2012;481:306–313. doi: 10.1038/nature10762. [DOI] [PMC free article] [PubMed] [Google Scholar]
- 2.Vogelstein B, et al. Cancer genome landscapes. Science. 2013;339:1546–1558. doi: 10.1126/science.1235122. [DOI] [PMC free article] [PubMed] [Google Scholar]
- 3.Greaves M. Evolutionary determinants of cancer. Cancer Discov. 2015;5:806–820. doi: 10.1158/2159-8290.CD-15-0439. [DOI] [PMC free article] [PubMed] [Google Scholar]
- 4.Nowell PC. The clonal evolution of tumor cell populations. Science. 1976;194:23–28. doi: 10.1126/science.959840. This is the seminal paper laying out the evolutionary theory of cancer. [DOI] [PubMed] [Google Scholar]
- 5.Mroz EA, et al. High intratumor genetic heterogeneity is related to worse outcome in patients with head and neck squamous cell carcinoma. Cancer. 2013 doi: 10.1002/cncr.28150. http://dx.doi.org/10.1002/cncr.28150. [DOI] [PMC free article] [PubMed]
- 6.Andor N, et al. Pan-cancer analysis of the extent and consequences of intratumor heterogeneity. Nat Med. 2016;22:105–113. doi: 10.1038/nm.3984. This study provides evidence that measures of diversity are universally prognostic for overall survival across cancers. [DOI] [PMC free article] [PubMed] [Google Scholar]
- 7.Wangsa D, et al. Phylogenetic analysis of multiple FISH markers in oral tongue squamous cell carcinoma suggests that a diverse distribution of copy number changes is associated with poor prognosis. Int J Cancer. 2016;138:98–109. doi: 10.1002/ijc.29691. [DOI] [PMC free article] [PubMed] [Google Scholar]
- 8.Schwarz RF, et al. Spatial and temporal heterogeneity in high-grade serous ovarian cancer: a phylogenetic analysis. PLoS Med. 2015;12:e1001789. doi: 10.1371/journal.pmed.1001789. [DOI] [PMC free article] [PubMed] [Google Scholar]
- 9.Urbschat S, et al. Clonal cytogenetic progression within intratumorally heterogeneous meningiomas predicts tumor recurrence. Int J Oncol. 2011;39:1601–1608. doi: 10.3892/ijo.2011.1199. [DOI] [PubMed] [Google Scholar]
- 10.Birkbak NJ, et al. Paradoxical relationship between chromosomal instability and survival outcome in cancer. Cancer Res. 2011;71:3447–3452. doi: 10.1158/0008-5472.CAN-10-3667. [DOI] [PMC free article] [PubMed] [Google Scholar]
- 11.Roylance R, et al. Relationship of extreme chromosomal instability with long-term survival in a retrospective analysis of primary breast cancer. Cancer Epidemiol Biomarkers Prev. 2011;20:2183–2194. doi: 10.1158/1055-9965.EPI-11-0343. [DOI] [PMC free article] [PubMed] [Google Scholar]
- 12.Maley CC, et al. Genetic clonal diversity predicts progression to esophageal adenocarcinoma. Nat Genet. 2006;38:468–473. doi: 10.1038/ng1768. This study reports the first application of ecological measures of diversity to clonal diversity in neoplasms. [DOI] [PubMed] [Google Scholar]
- 13.Merlo LM, et al. A comprehensive survey of clonal diversity measures in barrett’s esophagus as biomarkers of progression to esophageal adenocarcinoma. Cancer Prev Res (Phila ) 2010;3:1388–1397. doi: 10.1158/1940-6207.CAPR-10-0108. [DOI] [PMC free article] [PubMed] [Google Scholar]
- 14.Martinez P, et al. Dynamic clonal equilibrium and predetermined cancer risk in Barrett’s oesophagus. Nat Commun. 2016;7:12158. doi: 10.1038/ncomms12158. This paper demonstrates the first measure of the rate of clonal expansion in vivo in a human neoplasm. [DOI] [PMC free article] [PubMed] [Google Scholar]
- 15.Lipinski KA, et al. Cancer evolution and the limits of predictability in precision cancer medicine. Trends Cancer. 2016;2:49–63. doi: 10.1016/j.trecan.2015.11.003. [DOI] [PMC free article] [PubMed] [Google Scholar]
- 16.Morris LG, et al. Pan-cancer analysis of intratumor heterogeneity as a prognostic determinant of survival. Oncotarget. 2016;7:10051–10063. doi: 10.18632/oncotarget.7067. [DOI] [PMC free article] [PubMed] [Google Scholar]
- 17.Williams MJ, Werner B, Barnes CP, Graham TA, Sottoriva A. Identification of neutral tumor evolution across cancer types. Nat Genet. 2016;48:238–244. doi: 10.1038/ng.3489. This study describes methods to distinguish neutrally evolving tumours from those undergoing natural selection, along with methods to estimate the mutation rate. [DOI] [PMC free article] [PubMed] [Google Scholar]
- 18.Hong WS, Shpak M, Townsend JP. Inferring the origin of metastases from cancer phylogenies. Cancer Res. 2015;75:4021–4025. doi: 10.1158/0008-5472.CAN-15-1889. [DOI] [PMC free article] [PubMed] [Google Scholar]
- 19.Dawson SJ, et al. Analysis of circulating tumor DNA to monitor metastatic breast cancer. N Engl J Med. 2013;368:1199–1209. doi: 10.1056/NEJMoa1213261. [DOI] [PubMed] [Google Scholar]
- 20.Beerenwinkel N, Schwarz RF, Gerstung M, Markowetz F. Cancer evolution: mathematical models and computational inference. Syst Biol. 2015;64:e1–e25. doi: 10.1093/sysbio/syu081. [DOI] [PMC free article] [PubMed] [Google Scholar]
- 21.McFarland CD, Korolev KS, Kryukov GV, Sunyaev SR, Mirny LA. Impact of deleterious passenger mutations on cancer progression. Proc Natl Acad Sci USA. 2013;110:2910–2915. doi: 10.1073/pnas.1213968110. [DOI] [PMC free article] [PubMed] [Google Scholar]
- 22.McFarland CD, Mirny LA, Korolev KS. Tug-of-war between driver and passenger mutations in cancer and other adaptive processes. Proc Natl Acad Sci USA. 2014;111:15138–15143. doi: 10.1073/pnas.1404341111. [DOI] [PMC free article] [PubMed] [Google Scholar]
- 23.Axelrod R, Axelrod DE, Pienta KJ. Evolution of cooperation among tumor cells. Proc Natl Acad Sci USA. 2006;103:13474–13479. doi: 10.1073/pnas.0606053103. [DOI] [PMC free article] [PubMed] [Google Scholar]
- 24.Marusyk A, et al. Non-cell-autonomous driving of tumour growth supports sub-clonal heterogeneity. Nature. 2014;514:54–58. doi: 10.1038/nature13556. [DOI] [PMC free article] [PubMed] [Google Scholar]
- 25.Marusyk A, Almendro V, Polyak K. Intra-tumour heterogeneity: a looking glass for cancer? Nat Rev Cancer. 2012;12:323–334. doi: 10.1038/nrc3261. [DOI] [PubMed] [Google Scholar]
- 26.Chapman A, et al. Heterogeneous tumor subpopulations cooperate to drive invasion. Cell Rep. 2014;8:688–695. doi: 10.1016/j.celrep.2014.06.045. [DOI] [PMC free article] [PubMed] [Google Scholar]
- 27.Cleary AS, Leonard TL, Gestl SA, Gunther EJ. Tumour cell heterogeneity maintained by cooperating subclones in Wnt-driven mammary cancers. Nature. 2014;508:113–117. doi: 10.1038/nature13187. [DOI] [PMC free article] [PubMed] [Google Scholar]
- 28.Driscoll WW, Pepper JW. Theory for the evolution of diffusible external goods. Evol Int J Org Evol. 2010;64:2682–2687. doi: 10.1111/j.1558-5646.2010.01002.x. [DOI] [PubMed] [Google Scholar]
- 29.Alizadeh AA, et al. Toward understanding and exploiting tumor heterogeneity. Nat Med. 2015;21:846–853. doi: 10.1038/nm.3915. [DOI] [PMC free article] [PubMed] [Google Scholar]
- 30.Magurran AE. Measuring Biological Diversity. Blackwell; 2004. This book consolidates and eloquently describes all the different ecological measures of diversity. [DOI] [PubMed] [Google Scholar]
- 31.Whittaker RH. Evolution and measurement of species diversity. Taxon. 1972;21:213–251. [Google Scholar]
- 32.Park SY, Gonen M, Kim HJ, Michor F, Polyak K. Cellular and genetic diversity in the progression of in situ human breast carcinomas to an invasive phenotype. J Clin Invest. 2010;120:636–644. doi: 10.1172/JCI40724. [DOI] [PMC free article] [PubMed] [Google Scholar]
- 33.Mroz EA, Tward AD, Hammon RJ, Ren Y, Rocco JW. Intra-tumor genetic heterogeneity and mortality in head and neck cancer: analysis of data from the Cancer Genome Atlas. PLoS Med. 2015;12:e1001786. doi: 10.1371/journal.pmed.1001786. [DOI] [PMC free article] [PubMed] [Google Scholar]
- 34.Lozupone C, Lladser ME, Knights D, Stombaugh J, Knight R. UniFrac: an effective distance metric for microbial community comparison. ISME J. 2011;5:169–172. doi: 10.1038/ismej.2010.133. [DOI] [PMC free article] [PubMed] [Google Scholar]
- 35.Fay JC, Wu CI. Sequence divergence, functional constraint, and selection in protein evolution. Annu Rev Genom Hum Genet. 2003;4:213–235. doi: 10.1146/annurev.genom.4.020303.162528. [DOI] [PubMed] [Google Scholar]
- 36.Epstein JI, Amin MB, Reuter VE, Humphrey PA. Contemporary gleason grading of prostatic carcinoma: an update with discussion on practical issues to implement the 2014 international society of urological pathology (ISUP) consensus conference on gleason grading of prostatic carcinoma. Am J Surg Pathol. 2017;41:e1–e7. doi: 10.1097/PAS.0000000000000820. [DOI] [PubMed] [Google Scholar]
- 37.Babjuk M, et al. EAU guidelines on non-muscle-invasive urothelial carcinoma of the bladder: update 2013. Eur Urol. 2013;64:639–653. doi: 10.1016/j.eururo.2013.06.003. [DOI] [PubMed] [Google Scholar]
- 38.Shaheen NJ, Falk GW, Iyer PG, Gerson LB American College of G. ACG Clinical Guideline: Diagnosis and management of Barrett’s esophagus. Am J Gastroenterol. 2016;111:30–50. doi: 10.1038/ajg.2015.322. [DOI] [PMC free article] [PubMed] [Google Scholar]
- 39.Abbosh C, et al. Phylogenetic ctDNA analysis depicts early-stage lung cancer evolution. Nature. 2017;545:446–451. doi: 10.1038/nature22364. [DOI] [PMC free article] [PubMed] [Google Scholar]
- 40.Wang J, et al. Clonal evolution of glioblastoma under therapy. Nat Genet. 2016;48:768–776. doi: 10.1038/ng.3590. [DOI] [PMC free article] [PubMed] [Google Scholar]
- 41.Alexandrov LB, et al. Signatures of mutational processes in human cancer. Nature. 2013;500:415–421. doi: 10.1038/nature12477. This study describes a method to identify different mutation processes in neoplasms. [DOI] [PMC free article] [PubMed] [Google Scholar]
- 42.dos Reis M, Donoghue PC, Yang Z. Bayesian molecular clock dating of species divergences in the genomics era. Nat Rev Genet. 2016;17:71–80. doi: 10.1038/nrg.2015.8. [DOI] [PubMed] [Google Scholar]
- 43.Stephens PJ, et al. Massive genomic rearrangement acquired in a single catastrophic event during cancer development. Cell. 2011;144:27–40. doi: 10.1016/j.cell.2010.11.055. [DOI] [PMC free article] [PubMed] [Google Scholar]
- 44.Stevens JB, et al. Diverse system stresses: common mechanisms of chromosome fragmentation. Cell Death Dis. 2011;2:e178. doi: 10.1038/cddis.2011.60. [DOI] [PMC free article] [PubMed] [Google Scholar]
- 45.Dewhurst SM, et al. Tolerance of whole-genome doubling propagates chromosomal instability and accelerates cancer genome evolution. Cancer Discov. 2014;4:175–185. doi: 10.1158/2159-8290.CD-13-0285. [DOI] [PMC free article] [PubMed] [Google Scholar]
- 46.Li X, et al. Temporal and spatial evolution of somatic chromosomal alterations: a case-cohort study of Barrett’s esophagus. Cancer Prev Res (Phila ) 2014;7:114–127. doi: 10.1158/1940-6207.CAPR-13-0289. [DOI] [PMC free article] [PubMed] [Google Scholar]
- 47.Theissen G. The proper place of hopeful monsters in evolutionary biology. Theory Biosci. 2006;124:349–369. doi: 10.1016/j.thbio.2005.11.002. [DOI] [PubMed] [Google Scholar]
- 48.Loeb LA. Human cancers express a mutator phenotype: hypothesis, origin, and consequences. Cancer Res. 2016;76:2057–2059. doi: 10.1158/0008-5472.CAN-16-0794. [DOI] [PMC free article] [PubMed] [Google Scholar]
- 49.Jeggo PA, Pearl LH, Carr AM. DNA repair, genome stability and cancer: a historical perspective. Nat Rev Cancer. 2016;16:35–42. doi: 10.1038/nrc.2015.4. [DOI] [PubMed] [Google Scholar]
- 50.Jamal-Hanjani M, et al. Detection of ubiquitous and heterogeneous mutations in cell-free DNA from patients with early-stage non-small-cell lung cancer. Ann Oncol. 2016;27:862–867. doi: 10.1093/annonc/mdw037. [DOI] [PubMed] [Google Scholar]
- 51.Haigh J. The accumulation of deleterious genes in a population - Muller’s Ratchet. Theor Popul Biol. 1978;14:251–267. doi: 10.1016/0040-5809(78)90027-8. [DOI] [PubMed] [Google Scholar]
- 52.Fortunato A, et al. In: Cancer Evolution Cold Spring Harbor Perspectives in Medicine. Swanton C, et al., editors. Cold Spring Harbor Laboratory Press; 2016. p. a029652. [Google Scholar]
- 53.Drummond AJ, Pybus OG, Rambaut A, Forsberg R, Rodrigo AG. Measurably evolving populations. Trends Ecol Evol. 2003;18:481–488. [Google Scholar]
- 54.Chmielecki J, et al. Optimization of dosing for EGFR-mutant non-small cell lung cancer with evolutionary cancer modeling. Sci Transl Med. 2011;3:90ra59. doi: 10.1126/scitranslmed.3002356. [DOI] [PMC free article] [PubMed] [Google Scholar]
- 55.Maley CC, et al. Selectively advantageous mutations and hitchhikers in neoplasms: p16 lesions are selected in Barrett’s esophagus. Cancer Res. 2004;64:3414–3427. doi: 10.1158/0008-5472.CAN-03-3249. [DOI] [PubMed] [Google Scholar]
- 56.Sottoriva A, et al. A Big Bang model of human colorectal tumor growth. Nat Genet. 2015;47:209–216. doi: 10.1038/ng.3214. [DOI] [PMC free article] [PubMed] [Google Scholar]
- 57.Nei M. Genetic distance between populations. Am Naturalist. 1972;106:283–292. [Google Scholar]
- 58.Takezaki N, Nei M. Genetic distances and reconstruction of phylogenetic trees from microsatellite DNA. Genetics. 1996;144:389–399. doi: 10.1093/genetics/144.1.389. [DOI] [PMC free article] [PubMed] [Google Scholar]
- 59.Makohon-Moore AP, et al. Limited heterogeneity of known driver gene mutations among the metastases of individual patients with pancreatic cancer. Nat Genet. 2017;49:358–366. doi: 10.1038/ng.3764. [DOI] [PMC free article] [PubMed] [Google Scholar]
- 60.Holsinger KE, Weir BS. Genetics in geographically structured populations: defining, estimating and interpreting FST. Nat Rev Genet. 2009;10:639–650. doi: 10.1038/nrg2611. [DOI] [PMC free article] [PubMed] [Google Scholar]
- 61.Gerlinger M, et al. Genomic architecture and evolution of clear cell renal cell carcinomas defined by multiregion sequencing. Nat Genet. 2014;46:225–233. doi: 10.1038/ng.2891. [DOI] [PMC free article] [PubMed] [Google Scholar]
- 62.Gerlinger M, et al. Intratumor heterogeneity and branched evolution revealed by multiregion sequencing. N Engl J Med. 2012;366:883–892. doi: 10.1056/NEJMoa1113205. The study presents a phylogenetic analysis and dramatic demonstration of intratumoural heterogeneity, including regions with markers of both poor and good prognosis within the same tumour. [DOI] [PMC free article] [PubMed] [Google Scholar]
- 63.Schwartz R, Schaffer AA. The evolution of tumour phylogenetics: principles and practice. Nat Rev Genet. 2017;18:213–229. doi: 10.1038/nrg.2016.170. [DOI] [PMC free article] [PubMed] [Google Scholar]
- 64.Campbell PJ, et al. Subclonal phylogenetic structures in cancer revealed by ultra-deep sequencing. Proc Natl Acad Sci USA. 2008;105:13081–13086. doi: 10.1073/pnas.0801523105. These researchers found clones at the limit of detection, around 1 in 10,000 cells, implying there are more clones at even lower frequencies in neoplasms. [DOI] [PMC free article] [PubMed] [Google Scholar]
- 65.Suzuki Y, et al. Multiregion ultra-deep sequencing reveals early intermixing and variable levels of intratumoral heterogeneity in colorectal cancer. Mol Oncol. 2017;11:124–139. doi: 10.1002/1878-0261.12012. [DOI] [PMC free article] [PubMed] [Google Scholar]
- 66.Amend SR, Pienta KJ. Ecology meets cancer biology: the cancer swamp promotes the lethal cancer phenotype. Oncotarget. 2015;6:9669–9678. doi: 10.18632/oncotarget.3430. [DOI] [PMC free article] [PubMed] [Google Scholar]
- 67.Amend SR, Roy S, Brown JS, Pienta KJ. Ecological paradigms to understand the dynamics of metastasis. Cancer Lett. 2016;380:237–242. doi: 10.1016/j.canlet.2015.10.005. [DOI] [PMC free article] [PubMed] [Google Scholar]
- 68.Pienta KJ, Robertson BA, Coffey DS, Taichman RS. The cancer diaspora: Metastasis beyond the seed and soil hypothesis. Clin Cancer Res. 2013;19:5849–5855. doi: 10.1158/1078-0432.CCR-13-2158. [DOI] [PMC free article] [PubMed] [Google Scholar]
- 69.Yang KR, et al. Niche inheritance: a cooperative pathway to enhance cancer cell fitness through ecosystem engineering. J Cell Biochem. 2014;115:1478–1485. doi: 10.1002/jcb.24813. [DOI] [PMC free article] [PubMed] [Google Scholar]
- 70.Brown JS, Kotler BP. Hazardous duty pay and the foraging cost of predation. Ecol Lett. 2004;7:999–1014. [Google Scholar]
- 71.Aktipis CA, Boddy AM, Gatenby RA, Brown JS, Maley CC. Life history trade-offs in cancer evolution. Nat Rev Cancer. 2013;13:883–892. doi: 10.1038/nrc3606. This is the first application of life history theory to neoplastic cells and includes implications for the treatment and management of cancers. [DOI] [PMC free article] [PubMed] [Google Scholar]
- 72.de Groot AE, Roy S, Brown JS, Pienta KJ, Amend SR. Revisiting seed and soil: examining the primary tumor and cancer cell foraging in metastasis. Mol Cancer Res. 2017 doi: 10.1158/1541-7786.MCR-16-0436. http://dx.doi.org/10.1158/1541-7786.mcr-16-0436. [DOI] [PMC free article] [PubMed]
- 73.Lloyd MC, et al. Pathology to enhance precision medicine in oncology: lessons from landscape ecology. Adv Anat Pathol. 2015;22:267–272. doi: 10.1097/PAP.0000000000000078. [DOI] [PMC free article] [PubMed] [Google Scholar]
- 74.Nawaz S, Heindl A, Koelble K, Yuan Y. Beyond immune density: critical role of spatial heterogeneity in estrogen receptor-negative breast cancer. Mod Pathol. 2015;28:766–777. doi: 10.1038/modpathol.2015.37. [DOI] [PubMed] [Google Scholar]
- 75.Maley CC, Koelble K, Natrajan R, Aktipis A, Yuan Y. An ecological measure of immune-cancer colocalization as a prognostic factor for breast cancer. Breast Cancer Res. 2015;17:131. doi: 10.1186/s13058-015-0638-4. This work shows how digital pathology can be used to measure the ecology of tumours. [DOI] [PMC free article] [PubMed] [Google Scholar]
- 76.Kirilovsky A, et al. Rational bases for the use of the Immunoscore in routine clinical settings as a prognostic and predictive biomarker in cancer patients. Int Immunol. 2016;28:373–382. doi: 10.1093/intimm/dxw021. [DOI] [PMC free article] [PubMed] [Google Scholar]
- 77.Mlecnik B, et al. The tumor microenvironment and Immunoscore are critical determinants of dissemination to distant metastasis. Sci Transl Med. 2016;8:327ra326. doi: 10.1126/scitranslmed.aad6352. [DOI] [PubMed] [Google Scholar]
- 78.Galon J, et al. Type, density, and location of immune cells within human colorectal tumors predict clinical outcome. Science. 2006;313:1960–1964. doi: 10.1126/science.1129139. This study provides a demonstration of the prognostic value of immune cell infiltration in neoplasms, which was later developed into an immunoscore. [DOI] [PubMed] [Google Scholar]
- 79.Sato E, et al. Intraepithelial CD8+ tumor-infiltrating lymphocytes and a high CD8+/regulatory T cell ratio are associated with favorable prognosis in ovarian cancer. Proc Natl Acad Sci USA. 2005;102:18538–18543. doi: 10.1073/pnas.0509182102. [DOI] [PMC free article] [PubMed] [Google Scholar]
- 80.Loi S, et al. Prognostic and predictive value of tumor-infiltrating lymphocytes in a phase III randomized adjuvant breast cancer trial in node-positive breast cancer comparing the addition of docetaxel to doxorubicin with doxorubicin-based chemotherapy: BIG 02–98. J Clin Oncol. 2013;31:860–867. doi: 10.1200/JCO.2011.41.0902. [DOI] [PubMed] [Google Scholar]
- 81.Adams S, et al. Prognostic value of tumor-infiltrating lymphocytes in triple-negative breast cancers from two phase III randomized adjuvant breast cancer trials: ECOG 2197 and ECOG 1199. J Clin Oncol. 2014;32:2959–2966. doi: 10.1200/JCO.2013.55.0491. [DOI] [PMC free article] [PubMed] [Google Scholar]
- 82.Motz GT, Coukos G. Deciphering and reversing tumor immune suppression. Immunity. 2013;39:61–73. doi: 10.1016/j.immuni.2013.07.005. [DOI] [PMC free article] [PubMed] [Google Scholar]
- 83.Galon J, Angell HK, Bedognetti D, Marincola FM. The continuum of cancer immunosurveillance: prognostic, predictive, and mechanistic signatures. Immunity. 2013;39:11–26. doi: 10.1016/j.immuni.2013.07.008. [DOI] [PubMed] [Google Scholar]
- 84.Rizvi NA, et al. Mutational landscape determines sensitivity to PD-1 blockade in non–small cell lung cancer. Science. 2015;348:124–128. doi: 10.1126/science.aaa1348. [DOI] [PMC free article] [PubMed] [Google Scholar]
- 85.Van Allen EM, et al. Genomic correlates of response to CTLA-4 blockade in metastatic melanoma. Science. 2015;350:207–211. doi: 10.1126/science.aad0095. [DOI] [PMC free article] [PubMed] [Google Scholar]
- 86.Snyder A, et al. Genetic basis for clinical response to CTLA-4 blockade in melanoma. N Engl J Med. 2014;371:2189–2199. doi: 10.1056/NEJMoa1406498. [DOI] [PMC free article] [PubMed] [Google Scholar]
- 87.McGranahan N, et al. Clonal neoantigens elicit T cell immunoreactivity and sensitivity to immune checkpoint blockade. Science. 2016;351:1463–1469. doi: 10.1126/science.aaf1490. [DOI] [PMC free article] [PubMed] [Google Scholar]
- 88.Carmona-Fontaine C, et al. Emergence of spatial structure in the tumor microenvironment due to the Warburg effect. Proc Natl Acad Sci USA. 2013;110:19402–19407. doi: 10.1073/pnas.1311939110. [DOI] [PMC free article] [PubMed] [Google Scholar]
- 89.Fang JS, Gillies RD, Gatenby RA. Adaptation to hypoxia and acidosis in carcinogenesis and tumor progression. Semin Cancer Biol. 2008;18:330–337. doi: 10.1016/j.semcancer.2008.03.011. [DOI] [PMC free article] [PubMed] [Google Scholar]
- 90.Gatenby RA, Gawlinski ET. The glycolytic phenotype in carcinogenesis and tumor invasion: insights through mathematical models. Cancer Res. 2003;63:3847–3854. [PubMed] [Google Scholar]
- 91.Vander Heiden MG, Cantley LC, Thompson CB. Understanding the Warburg effect: the metabolic requirements of cell proliferation. Science. 2009;324:1029–1033. doi: 10.1126/science.1160809. [DOI] [PMC free article] [PubMed] [Google Scholar]
- 92.Antognelli C, Mezzasoma L, Fettucciari K, Talesa VN. A novel mechanism of methylglyoxal cytotoxicity in prostate cancer cells. Int J Biochem Cell Biol. 2013;45:836–844. doi: 10.1016/j.biocel.2013.01.003. [DOI] [PubMed] [Google Scholar]
- 93.Ghosh M, et al. In vivo assessment of toxicity and pharmacokinetics of methylglyoxal. Augmentation of the curative effect of methylglyoxal on cancer-bearing mice by ascorbic acid and creatine. Toxicol Appl Pharmacol. 2006;212:45–58. doi: 10.1016/j.taap.2005.07.003. [DOI] [PubMed] [Google Scholar]
- 94.Grimm EA, Sikora AG, Ekmekcioglu S. Molecular pathways: inflammation-associated nitric-oxide production as a cancer-supporting redox mechanism and a potential therapeutic target. Clin Cancer Res. 2013;19:5557–5563. doi: 10.1158/1078-0432.CCR-12-1554. [DOI] [PMC free article] [PubMed] [Google Scholar]
- 95.Fukumura D, Kashiwagi S, Jain RK. The role of nitric oxide in tumour progression. Nat Rev Cancer. 2006;6:521–534. doi: 10.1038/nrc1910. [DOI] [PubMed] [Google Scholar]
- 96.Riehl A, Nemeth J, Angel P, Hess J. The receptor RAGE: bridging inflammation and cancer. Cell Commun Signal. 2009;7:12. doi: 10.1186/1478-811X-7-12. [DOI] [PMC free article] [PubMed] [Google Scholar]
- 97.Lv L, Shao X, Chen H, Ho CT, Sang S. Genistein inhibits advanced glycation end product formation by trapping methylglyoxal. Chem Res Toxicol. 2011;24:579–586. doi: 10.1021/tx100457h. [DOI] [PubMed] [Google Scholar]
- 98.Schwabe RF, Jobin C. The microbiome and cancer. Nat Rev Cancer. 2013;13:800–812. doi: 10.1038/nrc3610. [DOI] [PMC free article] [PubMed] [Google Scholar]
- 99.Swidsinski A, et al. Association between intraepithelial Escherichia coli and colorectal cancer. Gastroenterology. 1998;115:281–286. doi: 10.1016/s0016-5085(98)70194-5. [DOI] [PubMed] [Google Scholar]
- 100.Perez-Chanona E, Trinchieri G. The role of microbiota in cancer therapy. Curr Opin Immunol. 2016;39:75–81. doi: 10.1016/j.coi.2016.01.003. [DOI] [PMC free article] [PubMed] [Google Scholar]
- 101.Gentles AJ, et al. The prognostic landscape of genes and infiltrating immune cells across human cancers. Nat Med. 2015;21:938–945. doi: 10.1038/nm.3909. This report provides a pan-cancer analysis of the role of infiltrating immune cells in cancer and their prognostic signatures. [DOI] [PMC free article] [PubMed] [Google Scholar]
- 102.Horn HS. Measurement of “overlap” in comparative ecological studies. Am Naturalist. 1966;100:419–424. [Google Scholar]
- 103.Swietach P, Vaughan-Jones RD, Harris AL, Hulikova A. The chemistry, physiology and pathology of pH in cancer. Phil Trans R Soc B. 2014;369:20130099. doi: 10.1098/rstb.2013.0099. [DOI] [PMC free article] [PubMed] [Google Scholar]
- 104.Damaghi M, et al. Chronic acidosis in the tumour microenvironment selects for overexpression of LAMP2 in the plasma membrane. Nat Commun. 2015;6:8752. doi: 10.1038/ncomms9752. [DOI] [PMC free article] [PubMed] [Google Scholar]
- 105.Burns MB, Lynch J, Starr TK, Knights D, Blekhman R. Virulence genes are a signature of the microbiome in the colorectal tumor microenvironment. Genome Med. 2015;7:55. doi: 10.1186/s13073-015-0177-8. [DOI] [PMC free article] [PubMed] [Google Scholar]
- 106.Gatenby RA, Gillies RJ. Why do cancers have high aerobic glycolysis? Nat Rev Cancer. 2004;4:891–899. doi: 10.1038/nrc1478. [DOI] [PubMed] [Google Scholar]
- 107.Shiraishi T, et al. Glycolysis is the primary bioenergetic pathway for cell motility and cytoskeletal remodeling in human prostate and breast cancer cells. Oncotarget. 2015;6:130–143. doi: 10.18632/oncotarget.2766. [DOI] [PMC free article] [PubMed] [Google Scholar]
- 108.Stephens DW, Brown JS, Ydenberg RC. Foraging: Behavior and Ecology. Univ. of Chicago Press; 2007. [Google Scholar]
- 109.Schmidt M, et al. Glycolytic phenotype in breast cancer: activation of Akt, up-regulation of GLUT1, TKTL1 and down-regulation of M2PK. J Cancer Res Clin Oncol. 2010;136:219–225. doi: 10.1007/s00432-009-0652-y. [DOI] [PubMed] [Google Scholar]
- 110.Tilman D. Resource Competition and Community Structure. Princeton Univ. Press; 1982. [PubMed] [Google Scholar]
- 111.Perera RM, Bardeesy N. Pancreatic cancer metabolism: breaking it down to build it back up. Cancer Discov. 2015;5:1247–1261. doi: 10.1158/2159-8290.CD-15-0671. [DOI] [PMC free article] [PubMed] [Google Scholar]
- 112.Jung B, Lee S, Yang IH, Good T, Coté GL. Automated on-line noninvasive optical glucose monitoring in a cell culture system. Appl Spectrosc. 2002;56:51–57. [Google Scholar]
- 113.Chen J, Sprouffske K, Huang Q, Maley CC. Solving the puzzle of metastasis: the evolution of cell migration in neoplasms. PLoS ONE. 2011;6:e17933. doi: 10.1371/journal.pone.0017933. [DOI] [PMC free article] [PubMed] [Google Scholar]
- 114.Aktipis CA, Maley CC, Pepper JW. Dispersal evolution in neoplasms: the role of disregulated metabolism in the evolution of cell motility. Cancer Prevention Res. 2012;5:266–275. doi: 10.1158/1940-6207.CAPR-11-0004. [DOI] [PMC free article] [PubMed] [Google Scholar]
- 115.Lloyd MC, et al. Darwinian dynamics of intratumoral heterogeneity: not solely random mutations but also variable environmental selection forces. Cancer Res. 2016;76:3136–3144. doi: 10.1158/0008-5472.CAN-15-2962. [DOI] [PMC free article] [PubMed] [Google Scholar]
- 116.Vincent T, Scheel D, Brown J, Vincent T. Tradeoffs and coexistence in consumer-resource models: it all depends on what and where you eat. Am Naturalist. 1996;148:1038–1058. [Google Scholar]
- 117.Ferreira SC, Jr, Martins ML, Vilela MJ. Reaction-diffusion model for the growth of avascular tumor. Phys Rev E Stat Nonlin Soft Matter Phys. 2002;65:021907. doi: 10.1103/PhysRevE.65.021907. [DOI] [PubMed] [Google Scholar]
- 118.DeNicola GM, Cantley LC. Cancer’s fuel choice: new flavors for a picky eater. Mol Cell. 2015;60:514–523. doi: 10.1016/j.molcel.2015.10.018. [DOI] [PMC free article] [PubMed] [Google Scholar]
- 119.Ornitz DM, Itoh N. The fibroblast growth factor signaling pathway. Wiley Interdiscip Rev Dev Biol. 2015;4:215–266. doi: 10.1002/wdev.176. [DOI] [PMC free article] [PubMed] [Google Scholar]
- 120.Hanahan D, Coussens LM. Accessories to the crime: functions of cells recruited to the tumor microenvironment. Cancer Cell. 2012;21:309–322. doi: 10.1016/j.ccr.2012.02.022. [DOI] [PubMed] [Google Scholar]
- 121.Rattigan YI, et al. Lactate is a mediator of metabolic cooperation between stromal carcinoma associated fibroblasts and glycolytic tumor cells in the tumor microenvironment. Exp Cell Res. 2012;318:326–335. doi: 10.1016/j.yexcr.2011.11.014. [DOI] [PMC free article] [PubMed] [Google Scholar]
- 122.Sotgia F, et al. Caveolin-1 and cancer metabolism in the tumor microenvironment: markers, models, and mechanisms. Annu Rev Pathol. 2012;7:423–467. doi: 10.1146/annurev-pathol-011811-120856. [DOI] [PubMed] [Google Scholar]
- 123.Martinez-Outschoorn UE, Sotgia F, Lisanti MP. Power surge: supporting cells “fuel” cancer cell mitochondria. Cell Metab. 2012;15:4–5. doi: 10.1016/j.cmet.2011.12.011. [DOI] [PubMed] [Google Scholar]
- 124.Nieman KM, et al. Adipocytes promote ovarian cancer metastasis and provide energy for rapid tumor growth. Nat Med. 2011;17:1498–1503. doi: 10.1038/nm.2492. [DOI] [PMC free article] [PubMed] [Google Scholar]
- 125.Kalluri R. The biology and function of fibroblasts in cancer. Nat Rev Cancer. 2016;16:582–598. doi: 10.1038/nrc.2016.73. [DOI] [PubMed] [Google Scholar]
- 126.Östman A, Augsten M. Cancer-associated fibroblasts and tumor growth – bystanders turning into key players. Curr Opin Genet Dev. 2009;19:67–73. doi: 10.1016/j.gde.2009.01.003. [DOI] [PubMed] [Google Scholar]
- 127.Franco OE, Shaw AK, Strand DW, Hayward SW. In: Seminars in Cell & Developmental Biology. Davey J, editor. Vol. 21. Elsevier; 2010. pp. 33–39. [DOI] [PMC free article] [PubMed] [Google Scholar]
- 128.Hirata E, et al. Intravital imaging reveals how BRAF inhibition generates drug-tolerant microenvironments with high integrin beta1/FAK signaling. Cancer Cell. 2015;27:574–588. doi: 10.1016/j.ccell.2015.03.008. [DOI] [PMC free article] [PubMed] [Google Scholar]
- 129.Paulsson J, Micke P. Prognostic relevance of cancer-associated fibroblasts in human cancer. Seminars Cancer Biol. 2014;25:61–68. doi: 10.1016/j.semcancer.2014.02.006. [DOI] [PubMed] [Google Scholar]
- 130.Folkman J. Tumor angiogenesis: therapeutic implications. N Engl J Med. 1971;285:1182–1186. doi: 10.1056/NEJM197111182852108. This is the seminal paper behind the idea of starving tumours for resources. [DOI] [PubMed] [Google Scholar]
- 131.Folkman J, Watson K, Ingber D, Hanahan D. Induction of angiogenesis during the transition from hyperplasia to neoplasia. Nature. 1989;339:58–61. doi: 10.1038/339058a0. [DOI] [PubMed] [Google Scholar]
- 132.Richards CH, Mohammed Z, Qayyum T, Horgan PG, McMillan DC. The prognostic value of histological tumor necrosis in solid organ malignant disease: a systematic review. Future Oncol. 2011;7:1223–1235. doi: 10.2217/fon.11.99. [DOI] [PubMed] [Google Scholar]
- 133.Anderson AR, Weaver AM, Cummings PT, Quaranta V. Tumor morphology and phenotypic evolution driven by selective pressure from the microenvironment. Cell. 2006;127:905–915. doi: 10.1016/j.cell.2006.09.042. [DOI] [PubMed] [Google Scholar]
- 134.Ferriere R, Belthoff JR, Olivieri I, Krackow S. Evolving dispersal: where to go next? Trends In Ecol Evol. 2000;15:5–7. doi: 10.1016/s0169-5347(99)01757-7. [DOI] [PubMed] [Google Scholar]
- 135.Johnson ML, Gaines MS. Evolution of dispersal: theoretical models and empirical tests using birds and mammals. Annu Rev Ecol Systemat. 1990;21:449–480. [Google Scholar]
- 136.Bowler DE, Benton TG. Causes and consequences of animal dispersal strategies: relating individual behaviour to spatial dynamics. Biol Rev Camb Philos Soc. 2005;80:205–225. doi: 10.1017/s1464793104006645. [DOI] [PubMed] [Google Scholar]
- 137.Brizel DM, et al. Tumor oxygenation predicts for the likelihood of distant metastases in human soft tissue sarcoma. Cancer Res. 1996;56:941–943. [PubMed] [Google Scholar]
- 138.Cairns RA, Hill RP. Acute hypoxia enhances spontaneous lymph node metastasis in an orthotopic murine model of human cervical carcinoma. Cancer Res. 2004;64:2054–2061. doi: 10.1158/0008-5472.can-03-3196. [DOI] [PubMed] [Google Scholar]
- 139.Hockel M, et al. Association between tumor hypoxia and malignant progression in advanced cancer of the uterine cervix. Cancer Res. 1996;56:4509–4515. [PubMed] [Google Scholar]
- 140.Nordsmark M, et al. Prognostic value of tumor oxygenation in 397 head and neck tumors after primary radiation therapy. An international multi-center study. Radiother Oncol. 2005;77:18–24. doi: 10.1016/j.radonc.2005.06.038. [DOI] [PubMed] [Google Scholar]
- 141.Rofstad EK, Galappathi K, Mathiesen B, Ruud EB. Fluctuating and diffusion-limited hypoxia in hypoxia-induced metastasis. Clin Cancer Res. 2007;13:1971–1978. doi: 10.1158/1078-0432.CCR-06-1967. [DOI] [PubMed] [Google Scholar]
- 142.Mazzone M, et al. Heterozygous deficiency of PHD2 restores tumor oxygenation and inhibits metastasis via endothelial normalization. Cell. 2009;136:839–851. doi: 10.1016/j.cell.2009.01.020. [DOI] [PMC free article] [PubMed] [Google Scholar]
- 143.Goel S, et al. Normalization of the vasculature for treatment of cancer and other diseases. Physiol Rev. 2011;91:1071–1121. doi: 10.1152/physrev.00038.2010. [DOI] [PMC free article] [PubMed] [Google Scholar]
- 144.Verduzco D, et al. Intermittent hypoxia selects for genotypes and phenotypes that increase survival, invasion, and therapy resistance. PloS one. 2015;10:e0120958. doi: 10.1371/journal.pone.0120958. [DOI] [PMC free article] [PubMed] [Google Scholar]
- 145.Zhang Q, et al. Acceleration of emergence of bacterial antibiotic resistance in connected microenvironments. Science. 2011;333:1764–1767. doi: 10.1126/science.1208747. [DOI] [PubMed] [Google Scholar]
- 146.Tatum JL. Hypoxia: importance in tumor biology, noninvasive measurement by imaging, and value of its measurement in the management of cancer therapy. Int J Radi Biol. 2006;82:699–757. doi: 10.1080/09553000601002324. [DOI] [PubMed] [Google Scholar]
- 147.Inai T, et al. Inhibition of vascular endothelial growth factor (VEGF) signaling in cancer causes loss of endothelial fenestrations, regression of tumor vessels, and appearance of basement membrane ghosts. Am J Pathol. 2004;165:35–52. doi: 10.1016/S0002-9440(10)63273-7. [DOI] [PMC free article] [PubMed] [Google Scholar]
- 148.Wikstrom P, Lissbrant IF, Stattin P, Egevad L, Bergh A. Endoglin (CD105) is expressed on immature blood vessels and is a marker for survival in prostate cancer. Prostate. 2002;51:268–275. doi: 10.1002/pros.10083. [DOI] [PubMed] [Google Scholar]
- 149.Evans SM, et al. Comparative measurements of hypoxia in human brain tumors using needle electrodes and EF5 binding. Cancer Res. 2004;64:1886–1892. doi: 10.1158/0008-5472.can-03-2424. [DOI] [PubMed] [Google Scholar]
- 150.Ljungkvist AS, Bussink J, Kaanders JH, van der Kogel AJ. Dynamics of tumor hypoxia measured with bioreductive hypoxic cell markers. Radiat Res. 2007;167:127–145. doi: 10.1667/rr0719.1. [DOI] [PubMed] [Google Scholar]
- 151.Chida J, Yamane K, Takei T, Kido H. An efficient extraction method for quantitation of adenosine triphosphate in mammalian tissues and cells. Anal Chim Acta. 2012;727:8–12. doi: 10.1016/j.aca.2012.03.022. [DOI] [PubMed] [Google Scholar]
- 152.Chaudhury B, et al. Heterogeneity in intratumoral regions with rapid gadolinium washout correlates with estrogen receptor status and nodal metastasis. J Magn Reson Imag. 2015;42:1421–1430. doi: 10.1002/jmri.24921. [DOI] [PMC free article] [PubMed] [Google Scholar]
- 153.Zhou M, et al. Radiologically defined ecological dynamics and clinical outcomes in glioblastoma multiforme: preliminary results. Transl Oncol. 2014;7:5–13. doi: 10.1593/tlo.13730. [DOI] [PMC free article] [PubMed] [Google Scholar]
- 154.Gatenby RA, Grove O, Gillies RJ. Quantitative imaging in cancer evolution and ecology. Radiology. 2013;269:8–15. doi: 10.1148/radiol.13122697. This study demonstrates the application and importance of ecology in radiological measures. [DOI] [PMC free article] [PubMed] [Google Scholar]
- 155.Kozak KH, Graham CH, Wiens JJ. Integrating GIS-based environmental data into evolutionary biology. Trends Ecol Evol. 2008;23:141–148. doi: 10.1016/j.tree.2008.02.001. [DOI] [PubMed] [Google Scholar]
- 156.Chan LM, Brown JL, Yoder AD. Integrating statistical genetic and geospatial methods brings new power to phylogeography. Mol Phylogenet Evol. 2011;59:523–537. doi: 10.1016/j.ympev.2011.01.020. [DOI] [PubMed] [Google Scholar]
- 157.Millington AC, Walsh SJ, Osborne PE. GIS and Remote Sensing Applications in Biogeography and Ecology. Vol. 626. Springer Science & Business Media; 2013. [Google Scholar]
- 158.Naveh Z, Lieberman AS. Landscape Ecology: Theory and Application. Springer Science & Business Media; 2013. [Google Scholar]
- 159.Lloyd MC, et al. Vascular measurements correlate with estrogen receptor status. BMC Cancer. 2014;14:279. doi: 10.1186/1471-2407-14-279. [DOI] [PMC free article] [PubMed] [Google Scholar]
- 160.Yuan Y et al. Quantitative image analysis of cellular heterogeneity in breast tumors complements genomic profiling. Sci Transl Med. 2012;4:157ra143. doi: 10.1126/scitranslmed.3004330. [DOI] [PubMed] [Google Scholar]
- 161.Hanahan D, Weinberg RA. Hallmarks of cancer: the next generation. Cell. 2011;144:646–674. doi: 10.1016/j.cell.2011.02.013. [DOI] [PubMed] [Google Scholar]
- 162.Paulsson J, Micke P. In: Seminars in Cancer Biology. Vincent T, editor. Elsevier; 2017. pp. 61–68. [Google Scholar]
- 163.Seliger B. Strategies of tumor immune evasion. BioDrugs. 2005;19:347–354. doi: 10.2165/00063030-200519060-00002. [DOI] [PubMed] [Google Scholar]
- 164.Enriquez-Navas PM, et al. Exploiting evolutionary principles to prolong tumor control in preclinical models of breast cancer. Sci Transl Med. 2016;8:327ra324. doi: 10.1126/scitranslmed.aad7842. This report shows preclinical evidence that diverse tumours with resistant subclones can be managed to dramatically extend life much longer than the standard strategy of using the maximum tolerated dose. [DOI] [PMC free article] [PubMed] [Google Scholar]
- 165.Logie HB. A standard classified nomenclature of disease. Can Med Assoc J. 1933;29:193–194. [PMC free article] [PubMed] [Google Scholar]
- 166.American Psychiatric Association. Diagnostic and Statistical Manual of Mental Disorders. American Psychiatric Association; 1952. [Google Scholar]
- 167.Fujisawa T, Barraclough TG. Delimiting species using single-locus data and the Generalized Mixed Yule Coalescent approach: a revised method and evaluation on simulated data sets. Syst Biol. 2013;62:707–724. doi: 10.1093/sysbio/syt033. [DOI] [PMC free article] [PubMed] [Google Scholar]
- 168.Prosperi MC, et al. Combinatorial analysis and algorithms for quasispecies reconstruction using next-generation sequencing. BMC Bioinformatics. 2011;12:5. doi: 10.1186/1471-2105-12-5. [DOI] [PMC free article] [PubMed] [Google Scholar]
- 169.Amir E-aD, et al. viSNE enables visualization of high dimensional single-cell data and reveals phenotypic heterogeneity of leukemia. Nat Biotechnol. 2013;31:545–552. doi: 10.1038/nbt.2594. [DOI] [PMC free article] [PubMed] [Google Scholar]
- 170.Macosko EZ, et al. Highly parallel genome-wide expression profiling of individual cells using nanoliter droplets. Cell. 2015;161:1202–1214. doi: 10.1016/j.cell.2015.05.002. [DOI] [PMC free article] [PubMed] [Google Scholar]
- 171.Gatenby RA, Gillies RJ, Brown JS. Of cancer and cave fish. Nat Rev Cancer. 2011;11:237–238. doi: 10.1038/nrc3036. [DOI] [PMC free article] [PubMed] [Google Scholar]
- 172.Gatenby RA, Cunningham JJ, Brown JS. Evolutionary triage governs fitness in driver and passenger mutations and suggests targeting never mutations. Nat Commun. 2014;5:5499. doi: 10.1038/ncomms6499. [DOI] [PMC free article] [PubMed] [Google Scholar]
- 173.Win T, et al. Tumor heterogeneity and permeability as measured on the CT component of PET/CT predict survival in patients with non-small cell lung cancer. Clin Cancer Res. 2013;19:3591–3599. doi: 10.1158/1078-0432.CCR-12-1307. [DOI] [PubMed] [Google Scholar]
- 174.Chicklore S, et al. Quantifying tumour heterogeneity in 18F-FDG PET/CT imaging by texture analysis. Eur J Nucl Med Mol Imag. 2013;40:133–140. doi: 10.1007/s00259-012-2247-0. [DOI] [PubMed] [Google Scholar]
- 175.Kostadinov R, Maley CC, Kuhner MK. Bulk genotyping of biopsies can create spurious evidence for hetereogeneity in mutation content. PLoS Comput Biol. 2016;12:e1004413. doi: 10.1371/journal.pcbi.1004413. [DOI] [PMC free article] [PubMed] [Google Scholar]
- 176.Alves JM, Prieto T, Posada D. Biased evolutionary inferences from bulk tumor samples. bioRxiv. 2016 https://doi.org/10.1101/089680.
- 177.Davis A, Navin NE. Computing tumor trees from single cells. Genome Biol. 2016;17:113. doi: 10.1186/s13059-016-0987-z. http://dx.doi.org/10.1186/s13059-016-0987-z. [DOI] [PMC free article] [PubMed] [Google Scholar]
- 178.Kostadinov RL, et al. NSAIDs modulate clonal evolution in Barrett’s esophagus. PLoS Genet. 2013;9:e1003553. doi: 10.1371/journal.pgen.1003553. This study reports the first measurement of the (chromosomal) mutation rate in vivo in a human neoplasm. [DOI] [PMC free article] [PubMed] [Google Scholar]
- 179.Vermeulen L, et al. Defining stem cell dynamics in models of intestinal tumor initiation. Science. 2013;342:995–998. doi: 10.1126/science.1243148. [DOI] [PubMed] [Google Scholar]
- 180.Merlos-Suarez A, et al. The intestinal stem cell signature identifies colorectal cancer stem cells and predicts disease relapse. Cell Stem Cell. 2011;8:511–524. doi: 10.1016/j.stem.2011.02.020. [DOI] [PubMed] [Google Scholar]
- 181.Eppert K, et al. Stem cell gene expression programs influence clinical outcome in human leukemia. Nat Med. 2011;17:1086–1093. doi: 10.1038/nm.2415. [DOI] [PubMed] [Google Scholar]
- 182.Shats I, et al. Using a stem cell-based signature to guide therapeutic selection in cancer. Cancer Res. 2011;71:1772–1780. doi: 10.1158/0008-5472.CAN-10-1735. [DOI] [PMC free article] [PubMed] [Google Scholar]
- 183.Driessens G, Beck B, Caauwe A, Simons BD, Blanpain C. Defining the mode of tumour growth by clonal analysis. Nature. 2012;488:527–530. doi: 10.1038/nature11344. [DOI] [PMC free article] [PubMed] [Google Scholar]
- 184.Li Y, et al. Suppression of cancer relapse and metastasis by inhibiting cancer stemness. Proc Natl Acad Sci USA. 2015;112:1839–1844. doi: 10.1073/pnas.1424171112. [DOI] [PMC free article] [PubMed] [Google Scholar]
- 185.Kreso A, et al. Self-renewal as a therapeutic target in human colorectal cancer. Nat Med. 2014;20:29–36. doi: 10.1038/nm.3418. [DOI] [PubMed] [Google Scholar]
- 186.Ding L, et al. Clonal evolution in relapsed acute myeloid leukaemia revealed by whole-genome sequencing. Nature. 2012;481:506–510. doi: 10.1038/nature10738. [DOI] [PMC free article] [PubMed] [Google Scholar]
- 187.Johnson BE, et al. Mutational analysis reveals the origin and therapy-driven evolution of recurrent glioma. Science. 2014;343:189–193. doi: 10.1126/science.1239947. [DOI] [PMC free article] [PubMed] [Google Scholar]
- 188.Kerbel RS, Kamen BA. The anti-angiogenic basis of metronomic chemotherapy. Nat Rev Cancer. 2004;4:423–436. doi: 10.1038/nrc1369. [DOI] [PubMed] [Google Scholar]