Abstract
HR-pQCT enables in-vivo multi-parametric assessments of bone microstructure in the distal radius and distal tibia. Conventional HR-pQCT image analysis approaches summarize bone parameters into global scalars, discarding relevant spatial information. In this work, we demonstrate the feasibility and reliability of statistical parametric mapping (SPM) techniques for HR-pQCT studies, which enable population-based local comparisons of bone properties. We present voxel-based morphometry (VBM) to assess trabecular and cortical bone voxel-based features, and a surface-based framework to assess cortical bone features both in cross-sectional and longitudinal studies. In addition, we present tensor-based morphometry (TBM) to assess trabecular and cortical bone structural changes. The SPM techniques were evaluated based on scan-rescan HR-pQCT acquisitions with repositioning of the distal radius and distal tibia of 30 subjects. For VBM and surface-based SPM purposes, all scans were spatially normalized to common radial and tibial templates, while for TBM purposes, rescans (follow-up) were spatially normalized to their corresponding scans (baseline). VBM was evaluated based on maps of local bone volume fraction (BV/TV), homogenized volumetric bone mineral density (vBMD), and homogenized strain energy density (SED) derived from micro-finite element analysis; while the cortical bone framework was evaluated based on surface maps of cortical bone thickness, vBMD, and SED. Voxel-wise and vertex-wise comparisons of bone features were done between the groups of baseline and follow-up scans. TBM was evaluated based on mean square errors of determinants of Jacobians at baseline bone voxels. In both anatomical sites, voxel- and vertex-wise uni- and multi-parametric comparisons yielded non-significant differences, and TBM showed no artefactual bone loss or apposition. The presented SPM techniques demonstrated robust specificity thus warranting their application in future clinical HR-pQCT studies.
Keywords: High-resolution peripheral quantitative computed tomography (HR-pQCT), bone, statistical parametric mapping (SPM), voxel-based morphometry (VBM), tensor-based morphometry (TBM)
Introduction
High-resolution peripheral quantitative computed tomography (HR-pQCT) enables a deeper understanding of the structural deterioration and pathophysiological processes that accompany metabolic bone disorders.16 This is because HR-pQCT offers unique multi-parametric capabilities for the in-vivo study of bone structure in the distal skeleton. HR-pQCT allows three-dimensional (3D) in-vivo imaging of the distal radius and distal tibia and enables the distinction between cortical and trabecular bone with a minimal radiation dose. HR-pQCT allows the characterization of bone based on features that quantify density, geometry, architecture, and topology. Furthermore, HR-pQCT provides the capability of estimating mechanical features through the application of micro-finite element analysis (μFEA).29 A substantial amount of knowledge has been gained using HR-pQCT in studies of aging, osteoporosis, treatment, and other conditions affecting bones.12
In the conventional HR-pQCT image analysis approach, the periosteal surface is automatically delineated, and using semi-automatic or fully automatic approaches the endocortical surface is defined thus separating the cortical from the trabecular bone compartment.2, 23, 48 Mean values of trabecular and cortical bone features are then derived and analyzed using different statistical techniques. Alternative methods have divided the cortical and trabecular bone compartments into concentric subregions, and these into quadrants, with the aim of investigating regional variations of bone structure, which are often obscured using conventional global analysis approaches.21, 28, 38 However, both global and predefined subregional approaches can obscure local patterns. Bone is a 3D organ subject to a myriad of temporo-spatial hormonal, metabolic, and mechanical stimuli, which results in a continuous adaptation through remodeling. Therefore, in addition to conventional global analyses, which have provided substantial amount of knowledge to date, 3D techniques that make no assumption about the spatial characteristics of bone features and that enable the investigation of how local bone quality features synergistically contribute to bone strength, have the potential to advance our understanding of the underlying bone biology. Statistical parametric mapping (SPM)14 is a technique of this kind.
SPM belongs to the set of mathematical methods known as Computational Anatomy. Anatomical structures depicted in medical images are modeled as 3D curves, surfaces or maps, and computer algorithms combine imagery from multiple subjects to perform spatially resolved comparisons of tissue properties. This enables population-based statistical analyses to be performed on a local basis. Differences associated with prognosis, progression, treatment, or other variables of interest are evaluated point-by-point in an anatomically normalized space. This make it possible to visualize group differences or longitudinal changes as statistical maps.40 SPM is a data-driven approach to localized image analysis that does not require predefinition of regions of interest. SPM achieves these goals through the spatial normalization39 of the investigated structures, i.e. by removing, to the extent possible, the natural anatomical variability in a population by deforming each individual's anatomy into a standardized space.35
The purpose of this work is to demonstrate the feasibility, and evaluate the reliability of using SPM techniques to perform population-based local multi-parametric comparisons of bone features with HR-pQCT. In particular, we present voxel-based morphometry (VBM)1 to assess trabecular and cortical bone voxel-based features, and a surface-based framework to assess cortical bone features both in cross-sectional and longitudinal studies. In addition, we present tensor-based morphometry (TBM)13 to assess trabecular and cortical bone structural changes. VBM was originally developed to perform voxel-wise comparisons of the local concentration of brain gray matter between two groups of subjects. However, VBM has been extended to the voxel-wise comparisons of local tissue properties between two different groups of subjects, or the same group of subjects at different time points. VBM enables the identification of voxels where the tissue property being considered is significantly associated with a variable of interest, e.g. where volumetric bone mineral density (vBMD) is associated with fracture. The adaptation of VBM to QCT studies of vBMD has been previously reported in the literature.8, 24-26 While QCT depicts the trabecular bone compartment as a smooth field of vBMD values due to partial volume effects, HR-pQCT depicts the individual trabeculae and marrow spaces, thus enabling the incorporation of a richer set of bone features, but also necessitating additional image preprocessing. The framework presented here to perform surface-based analyses of cortical bone features is quite similar to that of Carballido-Gamio and colleagues for QCT7, where tissue properties are attached to the vertices of a triangulated surface as multi-parametric feature vectors. Similar approaches have been employed in studies of knee cartilage using magnetic resonance imaging (MRI)6, 10, 11 and in studies of cortical bone using QCT.31-33, 41-44, 47 TBM is one of the most popular deformation-based approaches for analyzing macroscopic anatomy. TBM investigates local differences in shape by analyzing the nonlinear components of a spatial normalization, which can be converted to parametric maps representing volumetric changes on a voxel-wise basis, thus enabling voxel-wise statistics as in VBM. The adaptation of TBM to QCT studies of bone structure has been previously reported in the literature.9 The reliability of the presented SPM techniques was evaluated based on scan-rescan HR-pQCT acquisitions with repositioning of the distal radius and distal tibia of 30 subjects. VBM was evaluated based on three voxel-based features, the surface-based analyses based on three cortical bone features, and TBM based on one voxel-based feature.
Materials and Methods
Subjects
Thirty healthy adult subjects were recruited to participate in this study at Mayo Clinic. Exclusion criteria were a history of metabolic bone disease, history of fracture, and the presence of metal implants that would interfere with imaging the peripheral or axial skeleton. Informed consent was obtained from all participants after explaining the nature of the study, and the study was conducted in accordance to the regulations of the participating institutions. Analyses were performed based on de-identified data.
Imaging
Scan-rescan HR-pQCT acquisitions with repositioning of the distal radius and distal tibia were obtained for each subject using the standard protocol provided by the manufacturer (XtremeCT, Scanco Medical AG, Brüttisellen, Switzerland). Briefly, the extremity was immobilized in a carbon fiber cast and fixed within the gantry of the scanner. An anteroposterior projection was obtained where the operator defined a reference line. The scan location started 9.5 mm proximal to the endplate in the radius, and 22.5 mm proximal to the endplate in the tibia. Then a 9mm section (110 slices) was imaged for both anatomical sites with an isotropic nominal voxel size of 82μm (source potential 60 kVP, tube current 900 μA, and integration time 100 ms). The effective dose from ionizing radiation was approximately 4.2 μSv per acquisition. The linear attenuation values generated from the 3D reconstructions were converted to equivalent concentrations of hydroxyapatite (HA) mineral densities using asynchronous calibration data derived from a phantom provided by the manufacturer. Images were inspected for motion-related artifacts based on the manufacturer's qualitative grading scheme30, and subjects were rescanned if necessary. A single operator determined the quality grading. Scans with quality grading >3 were excluded.
Bone Segmentation
Bone was segmented from the HR-pQCT images using the standard software provided by the manufacturer. The periosteal contours of the radius or tibia were identified with an edge-finding algorithm23, visually checked, and manually modified as necessary. Then a Laplace–Hamming filter was applied and a fixed threshold was used to extract the mineralized portion of bone.
VBM
We adapted VBM to study voxel-wise multi-parametric features of bone in the distal radius and distal tibia in HR-pQCT images. The feasibility and reliability of VBM were evaluated with three parameters: 1) bone volume fraction (BV/TV); 2) vBMD; and 3) strain energy density (SED)3 derived from μFEA. In order to obtain smooth parametric maps suitable for population-based voxel-wise comparisons, local bone volume fraction (BV/TV) maps were computed, and vBMD and strain energy density (SED) maps were homogenized.17, 18 Computation of local BV/TV maps and homogenization of vBMD and SED maps was done with spherical kernels of two different sizes: diameter (d)=0.82mm (10 voxels) and d=1.804mm (22 voxels). Given the assumptions that all radii (tibiae) have similar outer shapes, and that the scans were obtained from similar anatomical locations, registrations were computed to spatially normalized individual scans to a common template based on bone segmentations. Registrations included 3D multi-resolution affine (9 degrees of freedom) and nonlinear transformations46, which were subsequently applied to the local BV/TV as well as to the homogenized vBMD and SED maps, thus bringing common anatomical regions into correspondence for the whole population of scans. In this work, the templates (one for the radius and one for the tibia) were minimum deformation templates (MDTs)19 representing the average size and shape of the radii and tibiae of all the subjects in the study.
SPM for Cortical Bone
The HR-pQCT framework for surface-based multi-parametric analyses of cortical bone features follows a very similar approach as that for QCT described in detail by Carballido-Gamio and colleagues.7 In this framework, streamlines starting at the periosteal surface and ending at the endosteal surface are computed and used to encode features in a laminar manner and measure cortical bone thickness incorporating partial volume effects.
The cortical bone compartment was identified based on an in-house implementation of a non-local fuzzy c-means (NL-FCM) classification algorithm5, 7 using vBMD maps, bone segmentations, and distances to the periosteal surface as features. Cortical bone thickness was calculated using the streamline integral thickness (SIT) technique.7 Briefly, SIT is a surface-based approach where streamlines that provide one-to-one matching without crossings between the periosteal and the endosteal surfaces are computed with the Laplace's equation approach.20 Then soft cortical bone classifications are integrated along the streamlines and assigned to the vertices of a triangulated surface. Therefore, SIT incorporates porosity into the computations, while the lengths of the streamlines give an apparent assessment of cortical bone thickness (appCtTh). The soft cortical bone classifications were obtained by applying a fuzzy s-shaped membership function to all the intensities enclosed by the periosteal surface. The parameters of the membership function were calculated based only on vBMD values of voxels within the cortical bone compartment. The soft cortical bone classification assigned to each voxel a membership value that could range from 0 —no cortical bone— to 1 —cortical-bone— indicating its likelihood of belonging to the category of cortical bone.7, 22
In order to encode cortical bone features in a laminar way, each streamline was subdivided into segments of equal length and parameters were then extracted for each layer as previously done by Carballido-Gamio and Majumdar to encode laminar magnetic resonance relaxation time values of knee cartilage.11 The result of these steps was a triangulated periosteal surface, where each vertex had a multi-parametric feature vector associated to it encoding: 1) SIT (porosity-weighted cortical bone thickness); 2) laminar vBMD values; and 3) laminar SED values. In addition, surface maps of appCtTh (length of streamlines) were also computed, and a surface-based representation of cortical porosity was developed where porosity was calculated as 1-SIT/appCtTh at each vertex.
Triangulated periosteal surfaces of the MDTs (one for the radius and one for the tibia) were then extracted, and individual parametric surfaces were spatially normalized to the MDTs based on the VBM transformations, thus effectively enabling the mapping of cortical bone features to the template surfaces at corresponding anatomic locations for uni- and multi-parametric vertex-wise comparisons.
TBM
We adapted TBM for longitudinal studies aiming to investigate local bone apposition and loss in the distal radius and distal tibia using HR-pQCT. In this technique, local changes in shape are represented as parametric maps of local changes in volume. In the HR-pQCT setting, this can be accomplished by rigidly aligning the follow-up scan of a subject to its corresponding baseline scan and then by applying nonlinear registration to match both the outer shapes and the internal bone structure. The determinants of the Jacobians (DetJs) of the displacement fields encoding the nonlinear registration represent the voxel-wise changes in volume with respect to the baseline scan, where: 1) DetJ=1 indicates no volumetric change; 2) DetJ>1 represents bone apposition; 3) DetJ<1 reflects bone loss; and 4) DetJ<=0 should not be allowed by the nonlinear transformation because these values indicate “folding” of the coordinate grid, i.e. folding of the bone structures. In this work, we used the scan and rescan acquisitions with repositioning as the baseline and follow-up volumes, respectively. The 3D rigid transformations (6 degrees of freedom) were computed with a multi-resolution intensity-based registration approach using normalized cross-correlation (NCC) as the optimization metric. The nonlinear registrations were computed using intensity-based multi-resolution diffeomorphic demons with the local correlation coefficient (LCC)4 as the optimization metric. The diffeomorphic characteristic of this algorithm prevents folding during the nonlinear registration. Then parametric maps of changes of volume were computed for each bone voxel in the baseline scan (DetJs).
Validation of the TBM pipeline was also performed in silico using a randomly selected scan of the distal radius. In order to assess the accuracy of the technique, the scan was shifted in three different directions by different amounts: 1) right (0.082mm=1 voxel), 2) left-inferior (0.164mm-0.164mm), and 3) anterior (0.246mm). Then only the nonlinear registration component was applied to correct for these translations. The objective of these shifts was twofold: 1) to assess the capability of the nonlinear registration to correct for the actual shifts; and 2) to evaluate the DetJs when there were no bone changes. In addition, bone apposition and resorption were simulated along three different directions using gray-level image dilation and erosion, respectively. Bone apposition was simulated in the following directions: 1) anterior, 2) left, and 3) anterior-inferior; while bone loss was simulated in the following directions: 1) superior, 2) left, and 3) left-superior. Then only the nonlinear registration component was applied to correct for these volumetric changes. Although the simulations did not model entirely realistic biological changes, the goal was to demonstrate that TBM also enables the voxel-wise quantification of the anisotropy of the volumetric changes. This was accomplished by decomposing the local volumetric changes encoded in the displacement fields into its magnitude and main direction of deformation using the deformation direction vector as previously described by Rajagopalan and colleagues.34 Homogenization of TBM maps reflecting local changes in volume would effectively enable population-based local comparisons. Similarly, population-based local comparisons of anisotropy can be performed with specialized techniques such as those based on the bipolar Watson distribution.37
Statistical Analysis
Maps of corrected P values derived from voxel-wise and vertex-wise scan-rescan comparisons were used to assess the reliability of VBM and surface-based SPM, respectively. Uni-parametric and multi-parametric comparisons were performed with paired t-tests and Hotelling's T2 statistics for dependent samples, respectively. The paired Hotelling's T2 statistic is given by:
| (1) |
where n is the number of subjects, f̄ represents the mean vector of the vectors representing the paired multi-parametric differences, and Sf denotes the variance-covariance matrix of the vectors representing the paired multi-parametric differences. The Hotelling's T2 was then transformed to an F-statistic with n and n-p (p=number of parameters) degrees of freedom as in Equation 2:
| (2) |
P values were corrected for multiple comparisons using the false discovery rate correction algorithm15 (FDR; q=0.05). The voxel-wise comparisons were done for local BV/TV, and homogenized vBMD and SED individually (uni-parametric) or as a group of features (multi-parametric). The surface-based comparisons were done for SIT, mean cortical laminar vBMD, and mean cortical laminar SED individually (uni-parametric) or as a group of features (multi-parametric).
For TBM, mean square errors (MSE) of the DetJs were calculated for the baseline bone voxels to assess its reliability. In an ideal situation, after 3D rigid-body registration, the nonlinear component of a scan-rescan registration should yield no volumetric changes, i.e. DetJ=1 for every baseline bone voxel. However, due to noise, partial volume effects, movement, and other factors, there is no perfect match between scan-rescan acquisitions even after 3D rigid alignment. TBM was evaluated only within the overlapping volumes of the scan-rescan acquisitions calculated based on 3D rigid-body registrations. The accuracy of TBM was also evaluated based on MSE for the three shifts, while the anisotropy was validated visually using color maps encoding directionality.
Results
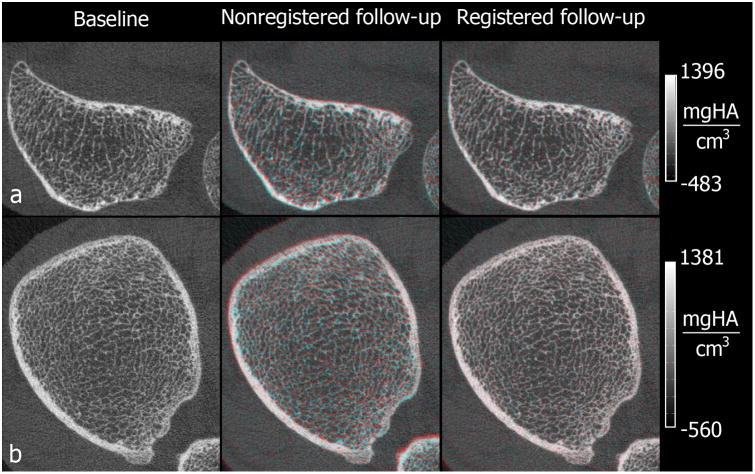
Three pairs of scans of the distal radius were excluded based on their quality grading (>3) in either the baseline or the follow-up scan, thus leaving a total of 27 pairs for the radius (mean±std age=71.4±4.3 years; 14 females) and 30 pairs for the tibia (mean±std age=71.5±4.4 years; 16 females). Cross-sections of representative 3D rigid-body registrations for the radius and tibia are shown in Figure 1.
Figure 1.
Representative HR-pQCT cross-sections of the distal radius (a) and distal tibia (b) showing baseline scans and color overlays of the baseline (cyan) and their corresponding follow-up (red) acquisitions before and after 3D rigid-body registration.
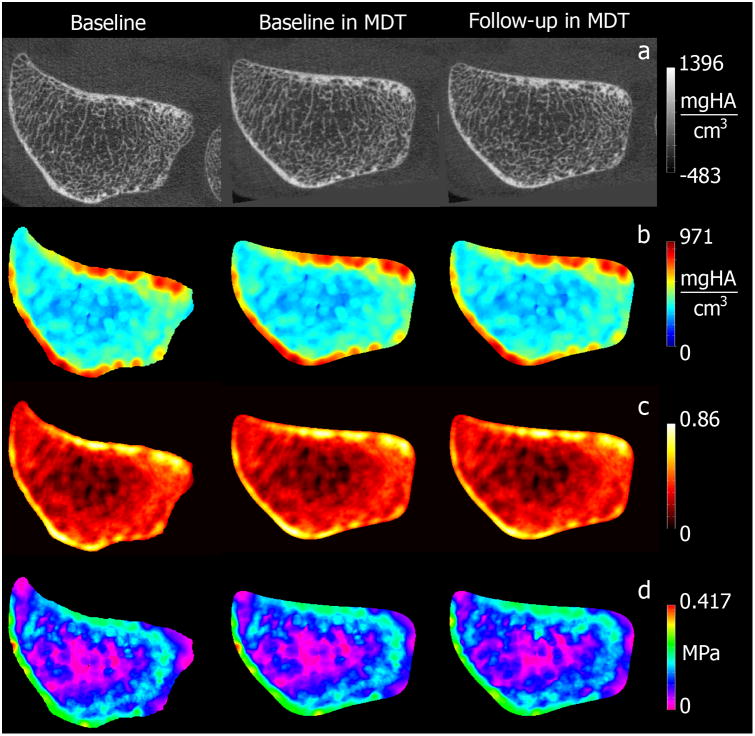
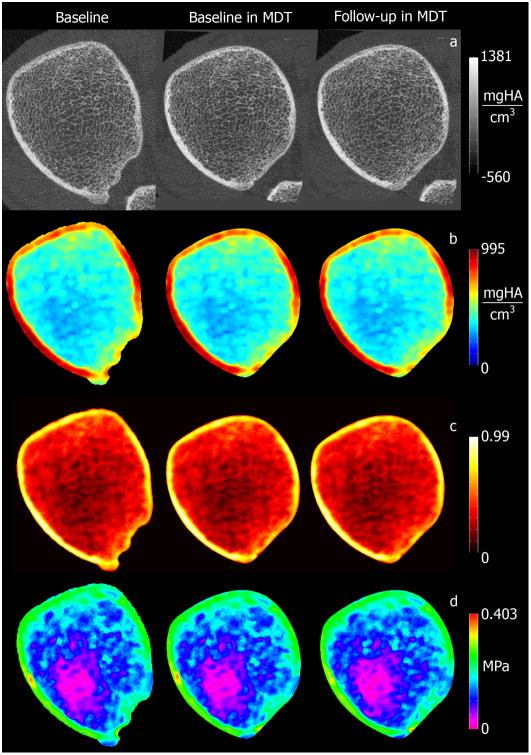
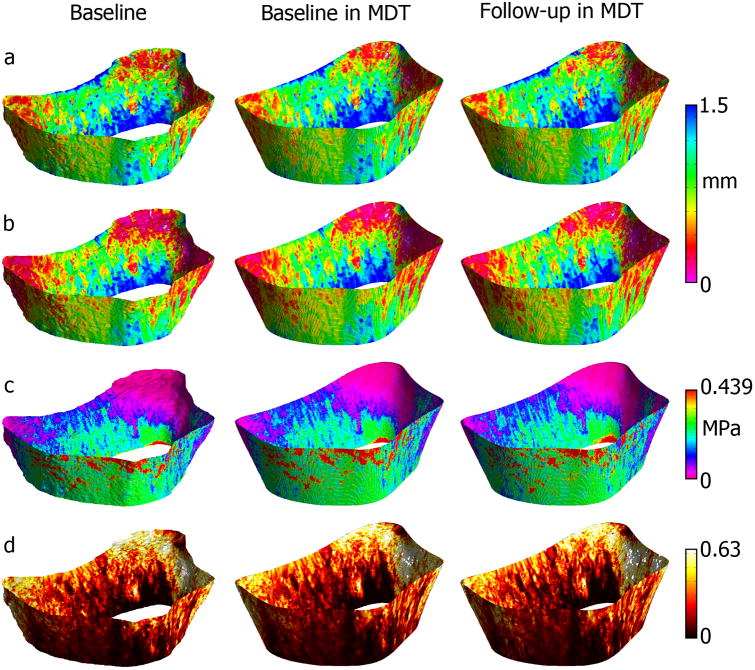
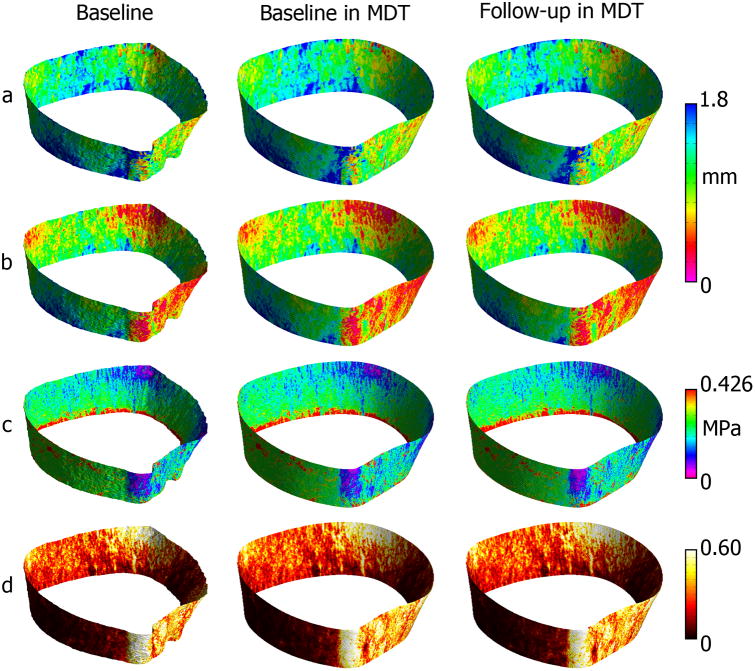
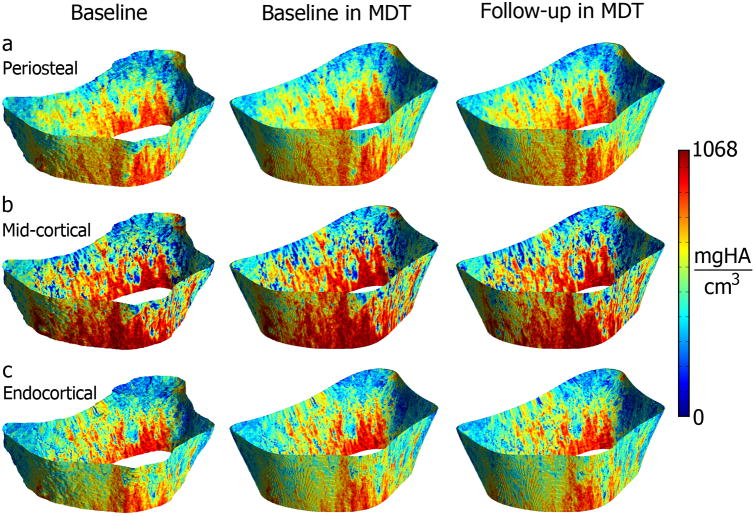
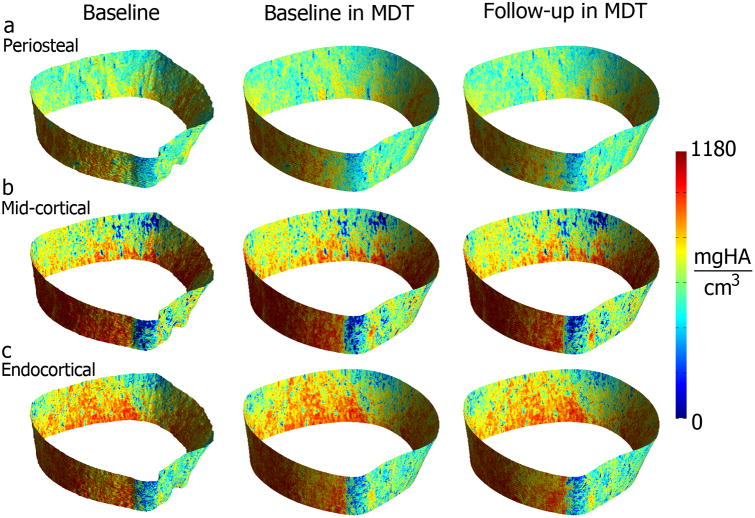
Figure 2 shows representative radial scan-rescan cross-sectional examples of local BV/TV and homogenized vBMD and SED parametric maps after being spatially normalized to the MDT, while Figure 3 shows similar examples for the tibia. Spatially normalized scan-rescan surface-based parametric maps of appCtTh, SIT, SED and porosity are shown in Figures 4 and 5 for the radius and tibia, respectively. Figures 6 and 7 show laminar vBMD maps for the periosteal, mid-cortical and endosteal layers also after spatial normalization of the baseline and follow-up acquisitions to the MDTs for the radius and tibia, respectively.
Figure 2.
Representative HR-pQCT cross-sections of voxel-based vBMD (a); homogenized vBMD (d=22 voxels) (b); local BV/TV (d=22 voxels) (c); and homogenized SED (d=22 voxels) (d) maps of the distal radius for the baseline scan, and the baseline and follow-up scans after spatial normalization to the MDT.
Figure 3.
Representative HR-pQCT cross-sections of voxel-based vBMD (a); homogenized vBMD (d=22 voxels) (b); local BV/TV (d=22 voxels) (c); and homogenized SED (d=22 voxels) (d) maps of the distal tibia for the baseline scan, and the baseline and follow-up scans after spatial normalization to the MDT.
Figure 4.
Representative HR-pQCT surface-based parametric maps of appCtTh (a); SIT (b); SED (c); and porosity (d) of the distal radius for the baseline scan, and the baseline and follow-up scans after spatial normalization to the MDT.
Figure 5.
Representative HR-pQCT surface-based parametric maps of appCtTh (a); SIT (b); SED (c); and porosity (d) of the distal tibia for the baseline scan, and the baseline and follow-up scans after spatial normalization to the MDT.
Figure 6.
Representative HR-pQCT surface-based parametric maps showing vBMD at the periosteal (a); mid-cortical (b); and endocortical (c) layers of the distal radius for the baseline scan, and the baseline and follow-up scans after spatial normalization to the MDT.
Figure 7.
Representative HR-pQCT surface-based parametric maps showing vBMD at the periosteal (a); mid-cortical (b); and endocortical (c) layers of the distal tibia for the baseline scan, and the baseline and follow-up scans after spatial normalization to the MDT.
The uni-parametric and multi-parametric voxel-wise and vertex-wise comparisons yielded non-significant differences thus indicating that the scan-rescan parametric maps were not significantly different from each other at the local level showing the reliability of VBM and surface-based SPM.
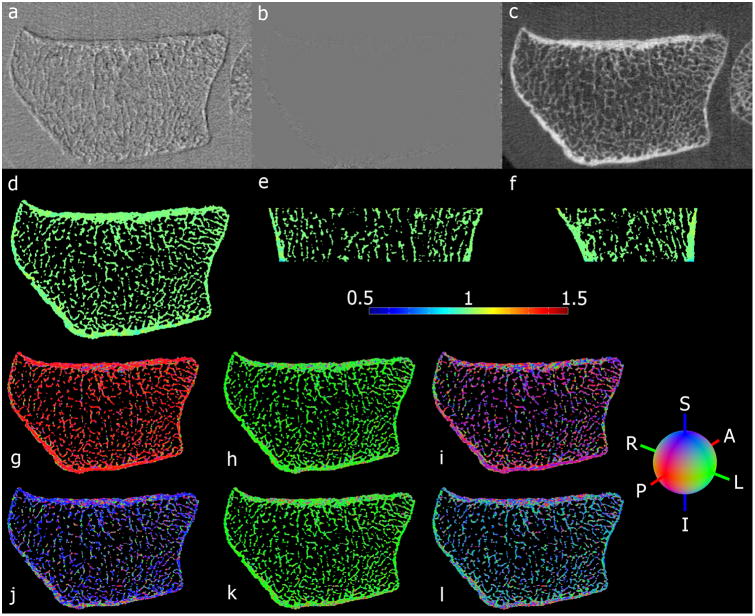
The means of the DetJs of the baseline bone voxels of the radii and tibiae were 1.010 and 1.006, while the MSEs were 0.021 and 0.016, respectively. Regarding the accuracy of the technique, the mean of the DetJs from the three shifts of the randomly selected distal radius was 1.001, while the MSE was 0.002. Figures 8a-8f show the example where the distal radius was shifted diagonally. Figures 8a and 8b show the difference of the scans before and after registration, respectively, while in Figure 8c a chess-board image created with alternating blocks (5 voxels × 5 voxels) of the still and registered images is shown. Axial, coronal, and sagittal cross-sections of the map of DetJs for this example are also shown with color-coding in Figures 8d, 8e, and 8f, respectively. In terms of the quantification of the anisotropy of the simulations of bone apposition and loss, Figures 8g-8l show maps where the main direction of the deformation was color-coded for each one of the simulations.
Figure 8.
Representative example showing the accuracy of TBM (a-f): (a) difference of still and translated images before nonlinear registration; (b) difference of still and translated images after nonlinear registration; (c) chess-board image created with alternating blocks of the still and translated images after nonlinear registration; and color-coded axial (d); coronal (e); and sagittal (f) cross-sections of the map of DetJs. Maps of a distal radius showing the anisotropy captured by TBM based on independent gray-level simulations of bone apposition and loss along different directions (g-l): (g) anterior bone apposition; (h) left bone apposition; (i) anterior-inferior bone apposition; (j) superior bone loss; (k) left bone loss; and (l) left-superior bone loss. A=Anterior; P=Posterior; L=Left; R=Right; I=Inferior; and S=Superior.
Discussion
HR-pQCT has emerged as a unique medical imaging technique capable of acquiring high-spatial resolution images of the distal radius and distal tibia, thus enabling multi-parametric assessments of bone microstructure. Conventional bone quantification with HR-pQCT —based on global analyses— has yielded a substantial amount of knowledge. Here, we presented the feasibility and reliability of voxel-based and surface-based SPM approaches for HR-pQCT studies with the aim of providing techniques to further understand bone mechanisms in specific populations. The capability of extracting out of TBM the main directionality of local volumetric changes in bone, i.e. the anisotropy, was also demonstrated. This set of techniques provides a data-driven approach to identify biologically relevant regions in the peripheral skeleton and local bone quality features that distinguish clinical populations. In combination with micro-finite element analysis these tools have the potential to provide unique insight into the local associations of bone features and their synergistic effect on bone strength helping to elucidate the underlying bone biology.
The main rationale for use of SPM in HR-pQCT studies of skeletal health is the identification of regions where one or more bone features are associated with a clinical variable of interest, e.g. fracture status. Therefore, it is crucial to avoid false positive associations. For this reason it is critical to demonstrate the reliability of voxel-based and surface-based SPM approaches. In this study, scan-rescan images were considered as baseline and follow-up acquisitions, respectively, and were subject to the whole image processing and statistical pipeline. Therefore, we were testing the assumption that pairwise comparisons of spatially normalized scan-rescan parametric maps should not yield significant local differences. Because these techniques could be applied to both uni-parametric and multi-parametric voxel- and vertex-wise comparisons of bone features, we evaluated the reliability of both. No significant voxel-wise and vertex-wise differences were observed between scan-rescan groups, indicating robust specificity. Figures 2-7 illustrate two important performance characteristics of the SPM processing pipeline: 1) lack of distortion of parametric maps after spatial normalization to the MDTs; and 2) clear reproducibility of patterns in the parametric maps between baseline and follow-up acquisitions. Another important characteristic to be noted is the laminar variation of vBMD seen in Figures 6-7. This laminar encoding of cortical bone parameters could be particularly relevant in studies such as those looking into the different laminar distribution of cortical porosity between populations, signatures of unique biological processes.28
The TBM analyses demonstrated three important performance characteristics of the processing pipeline. First, TBM is reliable because very low MSEs of DetJs were obtained in scan-rescan assessments, where volumetric changes are known to be zero, indicating that the pipeline does not introduce artifactual bone apposition or loss. Second, TBM is accurate because MSEs of DetJs were effectively zero in the displacement tests. Third, TBM provides the capability of quantifying and visualizing local anisotropy as demonstrated with the simulations of bone apposition and loss, where the main directions of the deformations were in agreement with the directions of the simulations. This property could be particularly relevant for studies of bone intervention. Although there are existing local bone anisotropy measures, they are limited to trabecular bone and to single time events. 36, 45 Therefore, the three characteristics of TBM make it a suitable technique for the longitudinal assessments of bone loss and bone apposition. The fact that TBM yields voxel-wise parametric maps reflecting local bone volume changes and anisotropy, indicates that population studies can be performed as in VBM where both the magnitude and the main direction of deformation can be compared on a voxel-by-voxel basis. The combination of VBM applied to baseline bone features, longitudinal maps of structural changes based on TBM, strain maps derived by μFEA, and overall estimates of bone strength has the potential to provide highly relevant insight into the local biological processes that drive skeletal health outcomes.
The main limitation of this study is that the clinical utility of SPM was not demonstrated. However, as it was previously indicated, the main goal of this study was to validate SPM techniques for future HR-pQCT studies. Based on previous publications that have established the ability of voxel-based and surface-based SPM to differentiate clinical outcomes in population studies of the proximal femur with QCT, we are confident that this set of techniques will also become a valuable tool to further understand the underlying bone biology and potentially help the prediction of outcomes in specific populations in HR-pQCT studies. Although in this validation work, our SPM analyses were limited to a small number of local bone features, it should be noted that common HR-pQCT analysis procedures yield a large number of local feature maps based on morphometric, topologic, μFEA, and other techniques. All of these feature maps have the potential to be incorporated into uni-parametric or multi-parametric SPM analyses. Furthermore, the improved resolution performance of the second generation HR-pQCT scanner has increased the number of direct 3D measures of bone structure, including 3D trabecular thickness and separation27, adding new features that can be investigated locally by SPM in the future.
In conclusion, we have presented and validated voxel-based and surface-based SPM techniques for uni-parametric and multi-parametric analyses of HR-pQCT studies of the distal radius and distal tibia. This set of methods will enable localized comparisons of bone features at the population level in cross-sectional and longitudinal studies. The tools presented here were reliable thus warranting their application in future clinical studies that utilize HR-pQCT to evaluate skeletal health including those of fracture, osteoporosis treatment, gender and age.
Acknowledgments
This work was supported by the NIH/NIAMS under Grants R01AR068456, R01AR060700, R01AR064140 and P30AR066262.
Abbreviations
- HR-pQCT
High-resolution peripheral quantitative computed tomography
- SPM
Statistical parametric mapping
- VBM
Voxel-based morphometry
- TBM
Tensor-based morphometry
- BV/TV
Bone volume fraction
- vBMD
Volumetric bone mineral density
- SED
Strain energy density
- μFEA
Micro-finite element analysis
- SIT
Streamline integral thickness
- DetJ
Determinant of Jacobian
- MDT
Minimum deformation template
Footnotes
Conflicts of Interest: The authors have no relevant conflicts of interest to disclose.
References
- 1.Ashburner J, Friston KJ. Voxel-based morphometry--the methods. Neuroimage. 2000;11(6 Pt 1):805–821. doi: 10.1006/nimg.2000.0582. [DOI] [PubMed] [Google Scholar]
- 2.Burghardt AJ, Buie HR, Laib A, Majumdar S, Boyd SK. Reproducibility of direct quantitative measures of cortical bone microarchitecture of the distal radius and tibia by HR-pQCT. Bone. 2010;47(3):519–528. doi: 10.1016/j.bone.2010.05.034. [DOI] [PMC free article] [PubMed] [Google Scholar]
- 3.Burghardt AJ, Kazakia GJ, Ramachandran S, Link TM, Majumdar S. Age- and gender-related differences in the geometric properties and biomechanical significance of intracortical porosity in the distal radius and tibia. J Bone Miner Res. 2010;25(5):983–993. doi: 10.1359/jbmr.091104. [DOI] [PMC free article] [PubMed] [Google Scholar]
- 4.Cachier P, Pennec X. 3D non-rigid registration by gradient descent on a Gaussian-windowed similarity measure using convolutions. IEEE Workshop on Mathematical Methods in Biomedical Image Analysis, Proceedings. 2000:182–189. [Google Scholar]
- 5.Caldairou B, Rousseau F, Passat N, Habas P, Studholme C, Heinrich C. A Non-Local Fuzzy Segmentation Method: Application to Brain MRI. Computer Analysis of Images and Patterns, Proceedings. 2009;5702:606–613. [Google Scholar]
- 6.Carballido-Gamio J, Bauer JS, Stahl R, Lee KY, Krause S, Link TM, Majumdar S. Inter-subject comparison of MRI knee cartilage thickness. Med Image Anal. 2008;12(2):120–135. doi: 10.1016/j.media.2007.08.002. [DOI] [PMC free article] [PubMed] [Google Scholar]
- 7.Carballido-Gamio J, Bonaretti S, Saeed I, Harnish R, Recker R, Burghardt AJ, Keyak JH, Harris T, Khosla S, Lang T. Automatic multi-parametric quantification of the proximal femur with quantitative computed tomography. Quant Imaging Med Surg. 2015;5(4):552–568. doi: 10.3978/j.issn.2223-4292.2015.08.02. [DOI] [PMC free article] [PubMed] [Google Scholar]
- 8.Carballido-Gamio J, Harnish R, Saeed I, Streeper T, Sigurdsson S, Amin S, Atkinson EJ, Therneau TM, Siggeirsdottir K, Cheng X, Melton LJ, 3rd, Keyak J, Gudnason V, Khosla S, Harris TB, Lang TF. Proximal femoral density distribution and structure in relation to age and hip fracture risk in women. J Bone Miner Res. 2013;28(3):537–546. doi: 10.1002/jbmr.1802. [DOI] [PMC free article] [PubMed] [Google Scholar]
- 9.Carballido-Gamio J, Harnish R, Saeed I, Streeper T, Sigurdsson S, Amin S, Atkinson EJ, Therneau TM, Siggeirsdottir K, Cheng X, Melton LJ, 3rd, Keyak JH, Gudnason V, Khosla S, Harris TB, Lang TF. Structural patterns of the proximal femur in relation to age and hip fracture risk in women. Bone. 2013;57(1):290–299. doi: 10.1016/j.bone.2013.08.017. [DOI] [PMC free article] [PubMed] [Google Scholar]
- 10.Carballido-Gamio J, Link TM, Majumdar S. New techniques for cartilage magnetic resonance imaging relaxation time analysis: texture analysis of flattened cartilage and localized intra- and inter-subject comparisons. Magn Reson Med. 2008;59(6):1472–1477. doi: 10.1002/mrm.21553. [DOI] [PMC free article] [PubMed] [Google Scholar]
- 11.Carballido-Gamio J, Majumdar S. Atlas-based knee cartilage assessment. Magn Reson Med. 2011;66(2):574–583. doi: 10.1002/mrm.22836. [DOI] [PMC free article] [PubMed] [Google Scholar]
- 12.Cheung AM, Adachi JD, Hanley DA, Kendler DL, Davison KS, Josse R, Brown JP, Ste-Marie LG, Kremer R, Erlandson MC, Dian L, Burghardt AJ, Boyd SK. High-resolution peripheral quantitative computed tomography for the assessment of bone strength and structure: a review by the Canadian Bone Strength Working Group. Curr Osteoporos Rep. 2013;11(2):136–146. doi: 10.1007/s11914-013-0140-9. [DOI] [PMC free article] [PubMed] [Google Scholar]
- 13.Davatzikos C, Vaillant M, Resnick SM, Prince JL, Letovsky S, Bryan RN. A computerized approach for morphological analysis of the corpus callosum. J Comput Assist Tomogr. 1996;20(1):88–97. doi: 10.1097/00004728-199601000-00017. [DOI] [PubMed] [Google Scholar]
- 14.Friston KJ, Frith CD, Liddle PF, Dolan RJ, Lammertsma AA, Frackowiak RS. The relationship between global and local changes in PET scans. J Cereb Blood Flow Metab. 1990;10(4):458–466. doi: 10.1038/jcbfm.1990.88. [DOI] [PubMed] [Google Scholar]
- 15.Genovese CR, Lazar NA, Nichols T. Thresholding of statistical maps in functional neuroimaging using the false discovery rate. Neuroimage. 2002;15(4):870–878. doi: 10.1006/nimg.2001.1037. [DOI] [PubMed] [Google Scholar]
- 16.Griffith JF, Engelke K, Genant HK. Looking beyond bone mineral density : Imaging assessment of bone quality. Ann N Y Acad Sci. 2010;1192:45–56. doi: 10.1111/j.1749-6632.2009.05378.x. [DOI] [PubMed] [Google Scholar]
- 17.Hazrati Marangalou J, Eckstein F, Kuhn V, Ito K, Cataldi M, Taddei F, van Rietbergen B. Locally measured microstructural parameters are better associated with vertebral strength than whole bone density. Osteoporos Int. 2014;25(4):1285–1296. doi: 10.1007/s00198-013-2591-3. [DOI] [PubMed] [Google Scholar]
- 18.Hazrati Marangalou J, Ito K, Taddei F, van Rietbergen B. Inter-individual variability of bone density and morphology distribution in the proximal femur and T12 vertebra. Bone. 2014;60:213–220. doi: 10.1016/j.bone.2013.12.019. [DOI] [PubMed] [Google Scholar]
- 19.Hua X, Leow AD, Levitt JG, Caplan R, Thompson PM, Toga AW. Detecting brain growth patterns in normal children using tensor-based morphometry. Hum Brain Mapp. 2009;30(1):209–219. doi: 10.1002/hbm.20498. [DOI] [PMC free article] [PubMed] [Google Scholar]
- 20.Jones SE, Buchbinder BR, Aharon I. Three-dimensional mapping of cortical thickness using Laplace's equation. Hum Brain Mapp. 2000;11(1):12–32. doi: 10.1002/1097-0193(200009)11:1<12::AID-HBM20>3.0.CO;2-K. [DOI] [PMC free article] [PubMed] [Google Scholar]
- 21.Kazakia GJ, Nirody JA, Bernstein G, Sode M, Burghardt AJ, Majumdar S. Age- and gender-related differences in cortical geometry and microstructure: Improved sensitivity by regional analysis. Bone. 2013;52(2):623–631. doi: 10.1016/j.bone.2012.10.031. [DOI] [PMC free article] [PubMed] [Google Scholar]
- 22.Krebs A, Graeff C, Frieling I, Kurz B, Timm W, Engelke K, Gluer CC. High resolution computed tomography of the vertebrae yields accurate information on trabecular distances if processed by 3D fuzzy segmentation approaches. Bone. 2009;44(1):145–152. doi: 10.1016/j.bone.2008.08.131. [DOI] [PubMed] [Google Scholar]
- 23.Laib A, Hauselmann HJ, Ruegsegger P. In vivo high resolution 3D-QCT of the human forearm. Technol Health Care. 1998;6(5-6):329–337. [PubMed] [Google Scholar]
- 24.Lang TF, Saeed IH, Streeper T, Carballido-Gamio J, Harnish RJ, Frassetto LA, Lee SM, Sibonga JD, Keyak JH, Spiering BA, Grodsinsky CM, Bloomberg JJ, Cavanagh PR. Spatial heterogeneity in the response of the proximal femur to two lower-body resistance exercise regimens. J Bone Miner Res. 2014;29(6):1337–1345. doi: 10.1002/jbmr.2155. [DOI] [PMC free article] [PubMed] [Google Scholar]
- 25.Li W, Kezele I, Collins DL, Zijdenbos A, Keyak J, Kornak J, Koyama A, Saeed I, Leblanc A, Harris T, Lu Y, Lang T. Voxel-based modeling and quantification of the proximal femur using inter-subject registration of quantitative CT images. Bone. 2007;41(5):888–895. doi: 10.1016/j.bone.2007.07.006. [DOI] [PMC free article] [PubMed] [Google Scholar]
- 26.Li W, Kornak J, Harris T, Keyak J, Li C, Lu Y, Cheng X, Lang T. Identify fracture-critical regions inside the proximal femur using statistical parametric mapping. Bone. 2009;44(4):596–602. doi: 10.1016/j.bone.2008.12.008. [DOI] [PMC free article] [PubMed] [Google Scholar]
- 27.Manske SL, Zhu Y, Sandino C, Boyd SK. Human trabecular bone microarchitecture can be assessed independently of density with second generation HR-pQCT. Bone. 2015;79:213–221. doi: 10.1016/j.bone.2015.06.006. [DOI] [PubMed] [Google Scholar]
- 28.Nirody JA, Cheng KP, Parrish RM, Burghardt AJ, Majumdar S, Link TM, Kazakia GJ. Spatial distribution of intracortical porosity varies across age and sex. Bone. 2015;75:88–95. doi: 10.1016/j.bone.2015.02.006. [DOI] [PMC free article] [PubMed] [Google Scholar]
- 29.Nishiyama KK, Shane E. Clinical imaging of bone microarchitecture with HR-pQCT. Curr Osteoporos Rep. 2013;11(2):147–155. doi: 10.1007/s11914-013-0142-7. [DOI] [PMC free article] [PubMed] [Google Scholar]
- 30.Pialat JB, Burghardt AJ, Sode M, Link TM, Majumdar S. Visual grading of motion induced image degradation in high resolution peripheral computed tomography: impact of image quality on measures of bone density and micro-architecture. Bone. 2012;50(1):111–118. doi: 10.1016/j.bone.2011.10.003. [DOI] [PubMed] [Google Scholar]
- 31.Poole KE, Treece GM, Gee AH, Brown JP, McClung MR, Wang A, Libanati C. Denosumab Rapidly Increases Cortical Bone in Key Locations of the Femur: A 3D Bone Mapping Study in Women with Osteoporosis. J Bone Miner Res. 2014 doi: 10.1002/jbmr.2325. [DOI] [PubMed] [Google Scholar]
- 32.Poole KE, Treece GM, Mayhew PM, Vaculik J, Dungl P, Horak M, Stepan JJ, Gee AH. Cortical thickness mapping to identify focal osteoporosis in patients with hip fracture. PLoS One. 2012;7(6):e38466. doi: 10.1371/journal.pone.0038466. [DOI] [PMC free article] [PubMed] [Google Scholar]
- 33.Poole KE, Treece GM, Ridgway GR, Mayhew PM, Borggrefe J, Gee AH. Targeted regeneration of bone in the osteoporotic human femur. PLoS One. 2011;6(1):e16190. doi: 10.1371/journal.pone.0016190. [DOI] [PMC free article] [PubMed] [Google Scholar]
- 34.Rajagopalan V, Scott J, Habas PA, Kim K, Rousseau F, Glenn OA, Barkovich AJ, Studholme C. Mapping directionality specific volume changes using tensor based morphometry: an application to the study of gyrogenesis and lateralization of the human fetal brain. Neuroimage. 2012;63(2):947–958. doi: 10.1016/j.neuroimage.2012.03.092. [DOI] [PMC free article] [PubMed] [Google Scholar]
- 35.Robbins S, Evans AC, Collins DL, Whitesides S. Tuning and comparing spatial normalization methods. Med Image Anal. 2004;8(3):311–323. doi: 10.1016/j.media.2004.06.009. [DOI] [PubMed] [Google Scholar]
- 36.Saha PK, Liu Y, Chen C, Jin D, Letuchy EM, Xu Z, Amelon RE, Burns TL, Torner JC, Levy SM, Calarge CA. Characterization of trabecular bone plate-rod microarchitecture using multirow detector CT and the tensor scale: Algorithms, validation, and applications to pilot human studies. Med Phys. 2015;42(9):5410–5425. doi: 10.1118/1.4928481. [DOI] [PMC free article] [PubMed] [Google Scholar]
- 37.Schwartzman A, Dougherty RF, Taylor JE. Cross-subject comparison of principal diffusion direction maps. Magn Reson Med. 2005;53(6):1423–1431. doi: 10.1002/mrm.20503. [DOI] [PMC free article] [PubMed] [Google Scholar]
- 38.Sode M, Burghardt AJ, Kazakia GJ, Link TM, Majumdar S. Regional variations of gender-specific and age-related differences in trabecular bone structure of the distal radius and tibia. Bone. 2010;46(6):1652–1660. doi: 10.1016/j.bone.2010.02.021. [DOI] [PMC free article] [PubMed] [Google Scholar]
- 39.Thompson DW. On Growth and Form. New ed Cambridge: University Press; 1942. [Google Scholar]
- 40.Thompson PM, Apostolova LG. Computational anatomical methods as applied to ageing and dementia. Br J Radiol. 2007;80:S78–91. doi: 10.1259/BJR/20005470. Spec No 2. [DOI] [PubMed] [Google Scholar]
- 41.Treece GM, Gee AH. Independent measurement of femoral cortical thickness and cortical bone density using clinical CT. Med Image Anal. 2015;20(1):249–264. doi: 10.1016/j.media.2014.11.012. [DOI] [PubMed] [Google Scholar]
- 42.Treece GM, Gee AH, Mayhew PM, Poole KE. High resolution cortical bone thickness measurement from clinical CT data. Med Image Anal. 2010;14(3):276–290. doi: 10.1016/j.media.2010.01.003. [DOI] [PMC free article] [PubMed] [Google Scholar]
- 43.Treece GM, Gee AH, Tonkin C, Ewing SK, Cawthon PM, Black DM, Poole KE. for the Osteoporotic Fractures in Men. Predicting Hip Fracture Type With Cortical Bone Mapping (CBM) in the Osteoporotic Fractures in Men (MrOS) Study. J Bone Miner Res. 2015;30(11):2067–2077. doi: 10.1002/jbmr.2552. [DOI] [PMC free article] [PubMed] [Google Scholar]
- 44.Treece GM, Poole KE, Gee AH. Imaging the femoral cortex: thickness, density and mass from clinical CT. Med Image Anal. 2012;16(5):952–965. doi: 10.1016/j.media.2012.02.008. [DOI] [PMC free article] [PubMed] [Google Scholar]
- 45.Vasilic B, Rajapakse CS, Wehrli FW. Classification of trabeculae into three-dimensional rodlike and platelike structures via local inertial anisotropy. Med Phys. 2009;36(7):3280–3291. doi: 10.1118/1.3140582. [DOI] [PMC free article] [PubMed] [Google Scholar]
- 46.Vercauteren T, Pennec X, Perchant A, Ayache N. Non-parametric diffeomorphic image registration with the demons algorithm. Med Image Comput Assist Interv. 2007;10(Pt 2):319–326. doi: 10.1007/978-3-540-75759-7_39. [DOI] [PubMed] [Google Scholar]
- 47.Whitmarsh T, Treece GM, Gee AH, Poole KE. Mapping Bone Changes at the Proximal Femoral Cortex of Postmenopausal Women in Response to Alendronate and Teriparatide Alone, Combined or Sequentially. J Bone Miner Res. 2015;30(7):1309–1318. doi: 10.1002/jbmr.2454. [DOI] [PubMed] [Google Scholar]
- 48.Zebaze R, Ghasem-Zadeh A, Mbala A, Seeman E. A new method of segmentation of compact-appearing, transitional and trabecular compartments and quantification of cortical porosity from high resolution peripheral quantitative computed tomographic images. Bone. 2013;54(1):8–20. doi: 10.1016/j.bone.2013.01.007. [DOI] [PubMed] [Google Scholar]


