

SUMMARY
The mammalian target of rapamycin complex 1 (mTORC1) is a master regulator of cell growth that is commonly deregulated in human diseases. Here we find that mTORC1 controls a transcriptional program encoding amino acid transporters and metabolic enzymes through a mechanism also used to regulate protein synthesis. Bioinformatic analysis of mTORC1-responsive mRNAs identified a promoter element recognized by activating transcription factor 4 (ATF4), a key effector of the integrated stress response. ATF4 translation is normally induced by the phosphorylation of eukaryotic initiation factor 2 alpha (eIF2α) through a mechanism that requires upstream open reading frames (uORFs) in the ATF4 5′ UTR. mTORC1 also controls ATF4 translation through uORFs, but independently of changes in eIF2α phosphorylation. mTORC1 instead employs the 4E-binding protein (4E-BP) family of translation repressors. These results link mTORC1-regulated demand for protein synthesis with an ATF4-regulated transcriptional program that controls the supply of amino acids to the translation machinery.
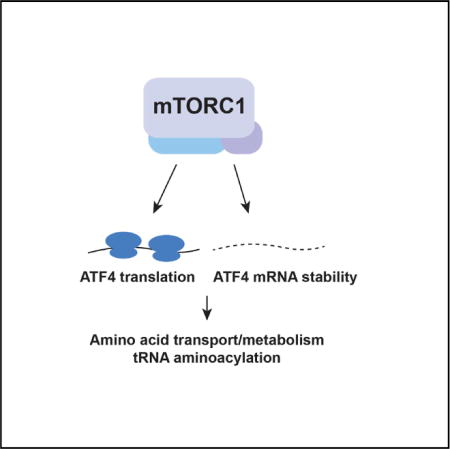
Graphical abstract
INTRODUCTION
Cell growth is an energetically intensive process that is tightly coupled to environmental conditions. Throughout eukaryotes, the multi-protein kinase called the mammalian target of rapamycin complex 1 (mTORC1) is a major regulator of the growth process (Laplante and Sabatini, 2012). mTORC1 activity responds to a wide range of growth signals, including nutrients and growth factors, and it is transmitted to an array of substrates that orchestrate the balance between anabolic and catabolic metabolism (Laplante and Sabatini, 2012). A central function of mTORC1 is to control protein synthesis, a fundamental step in the minting of new cellular material. mTORC1 communicates with the protein synthesis machinery through at least two families of substrates, the S6 kinases (S6Ks) and the 4E-binding proteins (4E-BPs). S6Ks phosphorylate multiple translation factors (e.g., RPS6), while 4E-BPs control the cytoplasmic cap-binding multi-protein complex eIF4F, a canonical translation factor that facilitates the rate-limiting step in translation initiation (Sonenberg and Hinnebusch, 2009). In the absence of mTOR activity, dephosphorylated 4E-BPs inhibit eIF4F function by binding to the cap-binding subunit (eIF4E) and preventing it from associating with the scaffold protein eIF4G, an interaction required for eIF4F translation initiation functions.
While the signaling links between mTOR and the translation machinery have been known for decades, their significance has only recently become apparent. The reason is that rapamycin, the classical mTOR inhibitor, is an unexpectedly weak inhibitor of protein synthesis in mammalian cells (Feldman et al., 2009; Thoreen et al., 2009). It is now clear that rapamycin only partially blocks the phosphorylation of many mTOR substrates, including some that are translation regulators (e.g., 4E-BPs) (Feldman et al., 2009; Thoreen et al., 2009). While the molecular details underlying this phenomenon are not entirely understood, they likely result from rapamycin’s allosteric mechanism of action, which may not affect all substrates equally (Kang et al., 2013). In contrast, inhibiting mTOR with either ATP-competitive inhibitors or by genetic means leads to sharp decreases in bulk protein synthesis and cell-cycle arrest (Feldman et al., 2009; Thoreen et al., 2009). Importantly, the activation of 4E-BPs is necessary for both outcomes (Dowling et al., 2010; Feldman et al., 2009; Thoreen et al., 2009).
The precipitous drop in protein synthesis following mTOR inhibition disrupts the balance of nutrient uptake and consumption. We wondered whether mTOR controls other mechanisms in parallel to maintain nutrient homeostasis. Here we show that mTOR inhibition triggers widespread repression of mRNAs encoding amino acid transporters and metabolic enzymes by post-transcriptionally repressing the transcription factor ATF4. ATF4, a member of the CREB/ATF family of bZIP transcription factors, is best known as the central mediator of the integrated stress response (Walter and Ron, 2011). The results described here establish a mechanism that controls its translation independently of the classical stress-induced trigger, phosphorylation of eIF2α, a translation factor. We further propose that a central function of ATF4 under non-stress conditions is to maintain the homeostatic balance between translation supply and demand by tuning the expression of the many enzymes and transporters required for delivering amino acids to the translation machinery.
RESULTS AND DISCUSSION
mTOR Controls the Expression of a Conserved Module of ATF4 Target Genes Involved in Amino Acid Metabolism and Uptake
To better understand the cellular response to growth inhibition, we used RNA sequencing (RNA-seq) to analyze changes in mRNA levels in HEK293T cells treated with vehicle or the ATP-competitive mTOR inhibitor Torin 1 for 24 hr (Thoreen et al., 2009). Significant changes in gene expression occurred throughout the transcriptome (13,570 detected, 1,004 decreased, and 895 increased; q value < 0.1) (Figure 1A; Table S1). A bioinformatic analysis of mTOR-regulated mRNAs revealed a concerted repression of mRNAs encoding proteins that maintain amino acid homeostasis, including transporters, metabolic enzymes, and tRNA aminoacyl transferases (Figure 1B). These results are consistent with previous studies of mTOR-regulated transcription in mouse and human fibroblasts (Adams, 2007; Düvel et al., 2010; Peng et al., 2002), and they indicate that mTOR controls a transcriptional program encoding the machinery for importing and processing the substrates of protein synthesis, complementing its function in regulating mRNA translation.
Figure 1. mTOR Inhibition Depletes mRNAs with Functions in AA Transport and Metabolism.

(A) Global changes in mRNA levels following 24 hr of mTOR inhibition. HEK293T cells were treated with vehicle (DMSO) or 250 nM Torin 1 for 24 hr and analyzed by RNA-seq.
(B) mTOR inhibition reduces mRNAs with functions in AA metabolism and transport. Gene set enrichment analysis (GSEA) was used to analyze changes in mRNA levels from (A). Vertical lines beneath the x axis denote the members of each gene set. (AA Metabolic process, MSIGDB M11769; AA/Oligopeptide SLC Transporters, MSIGDB 19056; tRNA Aminoacylation, MSIGDB M456).
(C) Left panel: an mTOR-regulated gene module. CCLE expression data were clustered by Pearson correlation and shown as a heatmap (increases in red and decreases in blue). Middle panel: log2-fold changes in mRNA levels from (A) were summed in a 25-gene window and plotted at each position. Right panel: a zoomed-in view of the cluster indicated is shown. mRNAs repressed upon mTOR inhibition are highlighted in red.
(D) ATF4-binding motif from the JASPAR database of transcription factor-binding sites, identified by motif analysis of promoters of genes in (C) (see the Supplemental Experimental Procedures).
(E) Extracts from cells treated as in (A) were analyzed for the indicated proteins by immunoblotting.
The coordinated repression of mRNAs with amino acid-related functions suggested a common mTOR-regulated transcription factor. To focus our search, we first sought to identify modules of consistently co-regulated mRNAs that are also subject to mTOR-dependent control. We reasoned that the promoters of these mRNAs would be most enriched for a common regulatory element that could be robustly detected by bioinformatic analysis. Along these lines, we obtained transcriptome profiles of 1,037 cancer cell lines from the Cancer Cell Line Encyclopedia (CCLE), and we clustered mRNAs by similarities in their expression patterns (Pearson correlation) (Barretina et al., 2012) (Figure 1C; Table S2). We then scanned this clustered list using a 25-gene window, summing the mTOR-regulated changes in mRNA levels at each position. This approach identified a clear cluster of 30 mRNAs (Figure 1C). Of these, 20 are included in the amino acid-related categories identified in Figure 1B, including the following components of major amino acid transport systems: CAT1 (SLC7A1), a transporter of cationic amino acids; LAT1 (SLC7A5), a transporter for branched chain amino acids; and SLC3A2, a chaperone for multiple amino acid transporters, including SLC7A5. Many of the remaining ten genes also have clear amino acid-related functions (e.g., SLC6A9, glycine transporter; XPOT, tRNA nuclear export protein; and SESN2, a leucine sensor). This dominant functional signature suggests that these mRNAs are a tightly co-regulated subset of the larger mTOR-regulated transcriptional program of mRNAs with amino acid-related functions identified in Figure 1B. Bioinformatic analysis of their promoter sequences revealed significant enrichment for binding sites of activating transcription factor 4 (ATF4) (Figure 1D). We confirmed that ATF4 is depleted following 24 hr of mTOR inhibition (Figure 1E).
Because 24 hr of mTOR inhibition has the potential to cause indirect effects, we tested whether ATF4 protein is depleted at earlier time points. ATF4 protein levels decreased within 30 min of mTOR inhibition, and it became undetectable by 4 hr (Figure 2A). Rapamycin, a specific inhibitor of mTORC1 at short time points (<8 hr), also depleted ATF4 protein levels (Figure S1A). However, the magnitude of the depletion was slightly less than that caused by maximal concentrations of Torin 1, suggesting a role for rapamycin-resistant mTOR functions. mRNAs from the module identified in Figure 1D (SLC7A1, SLC7A5, SLC3A2, SESN2, and CHAC1), as well as an additional known ATF4 target that is depleted by mTOR inhibition (SLC7A11), were similarly reduced, although with varying kinetics (Figure 2B; Figure S1B) (Crawford et al., 2015; Harding et al., 2003; Sato et al., 2004; Ye et al., 2015). ATF4 has also been recently implicated in the control of mRNAs involved in purine biosynthesis (e.g., MTHFD2, PSAT1, and PHGDH) (Ben-Sahra et al., 2016). Many of these mRNAs were depleted in HEK293T cells by 24 hr (Table S1), although not as rapidly as amino acid (AA)-related transcripts (Figure S1C).
Figure 2. mTOR Inhibition Causes Rapid ATF4-Dependent Reductions in AA-Related mRNAs.

(A) mTOR inhibition rapidly reduces ATF4 protein level. Extracts were prepared from HEK293T cells treated with vehicle (DMSO) or 250 nM Torin 1 for the indicated times and analyzed by immunoblotting.
(B) mTOR inhibition depletes ATF4 target mRNAs. qPCR analysis of RNA isolated from cells treated with vehicle (DMSO) or 250 nM Torin 1 for the indicated durations is shown. RNA levels were normalized to that of GAPDH (n = 3, error bars are SEM).
(C) ATF4−/− HEK293T cells generated using CRISPR/Cas9 lack ATF4 protein. Cell extracts were analyzed by immunoblotting for the indicated proteins.
(D) mTOR control of AA-related mRNAs in ATF4+/+ and ATF4−/− HEK293T cells. Left panel: changes in mRNA levels in the indicated cell lines treated with 250 nM Torin 1 for 6 hr were analyzed by RNA-seq. Red, mRNAs that are mTOR-regulated in ATF4+/+ cells (q < 0.1); blue, mTOR-repressed mRNAs (q < 0.1) encoding proteins with AA-related functions (transport, metabolism, and tRNA aminoacylation from Figure 1B) (n = 2). Right panel: boxplot shows change in expression of mTOR-repressed mRNAs with AA-related functions in ATF4+/+ and ATF4−/− HEK293T cells. Boxplots are displayed with standard definitions: upper and lower hinges are 25th and 75th percentile, respectively. The bar represents the median.
(E) Comparison of mRNA changes induced by Torin 1 and Tunicamycin (Tm). Left panel: changes in mRNA levels in HEK293T cells treated with either 250 nM Torin 1 or 1 μM tunicamycin for 6 hr were analyzed by RNA-seq. Blue, mTOR-regulated mRNAs (q < 0.1) with AA-related functions, as in (D); green, mRNAs induced by tunicamycin (q < 0.1) with ER stress-related functions (MSIGDB M10844) (n = 2). Right panel: boxplot shows change in expression of AA-related and ER-stress mRNAs in HEK293T cells treated with 250 nM Torin 1 or 1 μM tunicamycin for 6 hr (n = 2). Boxplots are displayed with standard definitions: upper and lower hinges are 25th and 75th percentile, respectively. The bar represents the median.
(F) mTOR regulation of ATF4-target transcripts in ATF4−/− cells. RNA was isolated from ATF4+/+ and ATF4−/− HEK293T cells treated with vehicle (DMSO) or 250 nM Torin 1 for 4 hr and analyzed by qPCR. Values for each mRNA are normalized to GAPDH and are relative to levels in untreated wild-type cells (n = 3, error bars are SD).
(G) Loss of ATF4 reduces AA uptake. Uptake of 14C-labeled AAs was measured in ATF4+/+, ATF4−/−, or ATF4−/− HEK293T cells expressing ectopic ATF4 by scintillation counting and normalized to DNA content. n = 3, error bars are SD, significance by t test.
(H) mTOR inhibition reduces AA uptake. ATF4+/+ and ATF4−/− HEK293T cells were treated with vehicle (DMSO) or 250 nM Torin 1 for 24 hr. AA uptake was assessed as in (G). n = 3, error bars are SD, significance by t test.
To better understand the contribution of ATF4 to mTOR regulation of mRNAs with AA-related functions (AA-related: AA metabolism, transport, and tRNA aminoacylation from Figure 1B; Table S4), we used CRISPR/Cas9 to generate ATF4-null HEK293T cells (Figure 2C) (Cong et al., 2013; Mali et al., 2013). RNA-seq was then used to analyze the transcriptional response to mTOR inhibition in ATF4-null and wild-type HEK293T cells (Figure 2D; Table S3). These results revealed that the loss of ATF4 significantly impaired the mTOR regulation of this class of mRNAs (Figure 2D). Many forms of cell stress, including endoplasmic reticulum (ER) stress, strongly induce ATF4 production (Walter and Ron, 2011). Because mTOR reduces the expression of these AA-related mRNAs by depleting ATF4, we reasoned that the induction of ER stress might increase their expression by increasing levels of ATF4 (Figure S1D). Surprisingly, the induction of ER stress with tunicamycin only mildly affected the expression of mTOR-regulated AA-related mRNAs while strongly increasing expression of established ER-stress mRNAs (Figure 2E; Table S4). Thus, basal levels of ATF4 appear to target different genes than those induced by ER stress, where levels of ATF4 are significantly elevated.
Closer inspection of mTOR-regulated mRNAs by qPCR showed some heterogeneity in their dependence on ATF4. Control of some transcripts (CHAC1, SLC7A11, and SESN2) was almost completely abolished in ATF4-null cells, while others (SLC7A5, SLC3A2, and SLC7A1) retained varying degrees of sensitivity (Figure 2F). These data argue that some of these mRNAs are exclusive ATF4 targets, while others are redundantly controlled by transcription factors with overlapping specificity that are also mTOR regulated. As some of these encode major AA transporters, we also assessed the function of ATF4 in AA uptake. Loss of ATF4 reduced the uptake of a mixture of 15 AAs, establishing that decreased ATF4 expression is sufficient to reduce basal AA uptake (Figure 2G). However, AA uptake remained sensitive to mTOR activity in ATF4-null cells, indicating that mTOR controls AA uptake through both ATF4-dependent and -independent mechanisms (Figure 2H). As these measurements were made using a partial mixture of AAs, the transport of specific AAs may be significantly more (or less) subject to ATF4-dependent control.
mTOR Controls ATF4 mRNA Stability
We next sought to understand how mTOR controls ATF4 expression. Analysis of HEK293T cells treated with Torin 1 revealed reductions in both ATF4 mRNA and protein but that the decline in protein precedes changes in mRNA levels by ~1 hr, consistent with recent work from Manning and colleagues (Figures 2A and 3A) (Ben-Sahra et al., 2016). This observation indicates that mTOR controls ATF4 expression through at least two distinct mechanisms, one targeting ATF4 mRNA and the other ATF4 protein. We first wondered whether mTOR controls ATF4 transcription. To test this possibility, HEK293T cells were pulse-labeled with 4-thiouridine (4sU), a nucleoside analog that is rapidly incorporated into newly synthesized mRNAs and can be derivatized after RNA isolation by thiol-specific biotinylation using MTS-biotin (Duffy et al., 2015). Analysis of 4sU-labeled mRNA showed reductions in the synthesis rates of ATF4 target mRNAs (SLC3A2, SLC7A1, and CHAC1) that mirrored the decrease in steady-state levels (Figure 3B). In contrast, the synthesis rate of ATF4 was reduced only by ~25%, indicating that transcriptional changes cannot account for the ~75% decrease in ATF4 mRNA levels following mTOR inhibition (Figure 3B).
Figure 3. mTOR Controls ATF4 Translation and mRNA Stability.

(A) mTOR reduces ATF4 mRNA levels. RNA was isolated from cells treated with vehicle (DMSO) or 250 nM Torin 1 for the indicated times and analyzed by qPCR. RNA levels were normalized to GAPDH (n = 3, error bars are SD).
(B) mTOR activity has little effect on ATF4 transcription. HEK293T cells were treated with vehicle or 250 nM Torin 1 for 4 hr and then pulsed for 15 and 30 min with 100 μM 4sU. RNA was reacted with MTS-biotin, isolated by streptavidin-affinity purification, and analyzed by qPCR. Synthesis rates were determined by comparing 4sU labeling at 15 and 30 min and compared to changes in steady-state mRNA levels (n = 3, error bars are SD).
(C) mTOR inhibition decreases the half-life of ATF4 mRNA. ATF4−/− HEK293T cells simultaneously expressing doxycycline-repressible constructs encoding ATF4 and GFP were pre-treated with vehicle or 250 nM Torin 1 for 30 min, and then 1 μg/mL doxycycline. mRNA was collected at 0 and 6 hr post-doxycycline addition and analyzed by qPCR. mRNA levels were normalized to GAPDH (n = 3, error bars are SD, but are too small to be visible).
(D) ATF4 protein stability is unaffected by mTOR inhibition. Extracts were prepared from HEK293T cells pre-treated with 100 μg/mL cycloheximide for 5 min and then with vehicle (DMSO) or 250 nM Torin 1 for the indicated times, and they were analyzed for the indicated proteins by immunoblotting (left panel) and quantified by normalizing levels of ATF4 to EIF3B (right panel) (n = 3, error bars are SD).
(E) mTOR inhibition preferentially decreases translation of the ATF4-coding ORF. Top panel: ribosome profiling data from HEK293T cells treated for 24 hr with vehicle (DMSO) or 250 nM Torin 1 are shown. Bar heights are reads per million (RPM) for each position in the spliced ATF4 transcript, and they are the combined values of two replicate libraries. Bottom panel: organization of ORFs in the ATF4 mRNA is shown.
(F) mTOR-regulated change in the translation efficiency of ATF4 ORFs. Translation efficiencies of ATF4 uORF3 and main ORF (mORF) were calculated by normalizing ribosome-protected fragment (RPF) reads from (E) from non-overlapping segments of uORF3 or mORF to RNA levels in DMSO- and Torin 1-treated conditions (n = 2, error bars are SD, significance calculated by t test).
(G) Top panel: reporter design. 5′ UTRs are from wild-type human ATF4 (WT), ATF4 with start codon of uORF3 mutated to TAC (DuORF3), or ACTB. Bottom panel: cells were treated with 10 μM TMP to stabilize YFP concurrently with vehicle (DMSO) or 250 nM Torin 1, and they were monitored for fluorescence at the indicated times (n = 9, error bars are SEM).
(H) uORF3 is required for mTOR control of full-length ATF4. ATF4−/− HEK293T cells stably expressing dox-inducible WT or DuORF3 ATF4 were treated with 1.0 μg/mL (WT) or 0.5 μg/mL (ΔuORF3) doxycycline for 40 hr, and then with vehicle (DMSO) or 250 nM Torin 1 for 1 hr. Cell extracts were prepared and analyzed by immunoblotting for the indicated proteins.
(I) Gcn2 is required for mTOR control of eIF2α phosphorylation, but not ATF4 translation. Extracts were prepared from Gcn2+/+ or Gcn2−/− MEFs treated with vehicle (DMSO) or 250 nM Torin 1 for 4 hr, and they were analyzed by immunoblotting for the indicated proteins.
To assess whether mTOR instead controls ATF4 mRNA stability, we generated doxycycline-repressible (Dox-off) constructs encoding either ATF4 or, as a control, GFP. ATF4-null cells simultaneously expressing both reporters were pre-treated with vehicle (DMSO) or Torin 1 and then with doxycycline to prevent further transcription. Analysis of reporter decay rates revealed a significant decrease in ATF4 mRNA half-life when mTOR was inhibited (Figure 3C). mTOR inhibition also decreased the stability of the control (GFP) mRNA, although to a lesser degree than ATF4, indicating that mTOR signaling might have general effects on mRNA stability (Figure 3C). Indeed, ATF4 mRNA may be hyper-sensitive to an mTOR-regulated mechanism that controls the stability of many mRNAs. Nonetheless, these results indicate that decreased mRNA stability is a significant component of mTOR regulation of ATF4 mRNA levels. We also note that ATF4 mRNA is a known target of nonsense-mediated decay (NMD) (Mendell et al., 2004). However, RNAi depletion of UPF1, a factor required for NMD, increased baseline ATF4 levels (and that of GAS5, a known target of NMD), but it failed to rescue mTOR-dependent regulation (Figure S2) (Smith and Steitz, 1998). We therefore conclude that mTOR inhibition primarily decreases ATF4 mRNA levels by increasing its rate of degradation through UPF1-independent mechanisms.
mTOR Control of ATF4 Translation Requires Upstream Open Reading Frames but Is Independent of eIF2α Phosphorylation
mTOR also controls ATF4 protein levels through a mechanism that acts prior to changes in mRNA levels (Figures 2A and 3A). Previous studies found that proteasome inhibitors failed to prevent mTOR regulation of ATF4 levels, arguing against control of proteasome-dependent degradation (Ben-Sahra et al., 2016). We found that ATF4 protein levels declined at similar rates in control or Torin 1-treated cells when protein synthesis was blocked with the translation inhibitor cycloheximide, confirming that ATF4 protein stability is unaffected by mTOR signaling (Figure 3D).
We next considered whether mTOR controls ATF4 translation. Translation of ATF4 is known to be regulated by a well-studied and complex mechanism that requires several upstream open reading frames (uORFs) in the ATF4 5′ UTR (two in mouse and three in human) (Lu et al., 2004; Vattem and Wek, 2004). The third uORF (uORF3) overlaps, out of frame, with the primary ORF (Figure 3E). Under normal growth conditions, uORF3 is translated with high efficiency, precluding the translation of the main ORF. Stress conditions, including ER stress and AA starvation, trigger a mechanism that causes ribosomes to skip uORF3 and instead initiate translation at the ORF encoding ATF4. We noticed, using ribosome profiling, that mTOR inhibition preferentially depleted ribosome density from the ATF4-encoding ORF (Figures 3E and 3F). Ribosome density was also reduced in uORF3, but this primarily reflected a decrease in ATF4 mRNA (~60% in this experiment) and not a significant reduction in translation efficiency (Figure 3F).
To test whether mTOR regulates ATF4 through the uORF selection mechanism, we constructed reporters programmed with either wild-type ATF4 5′ UTR or a version lacking the start codon for uORF3. These were inserted upstream of a sequence encoding YFP appended to a destabilized domain derived from Escherichia coli dihydrofolate reductase (ecDHFR) (Iwamoto et al., 2010). The YFP-ecDHFR fusion protein accumulates in cells only following the addition of the DHFR ligand, trimethoprim (TMP), allowing precise measurements of synthesis rates. Analysis of cells expressing these reporters confirmed that the ATF4 5′ UTR was sufficient to confer mTOR-regulated translation but that it required an intact uORF3 (Figure 3G; Figure S3A). We also introduced ATF4 alleles with wild-type or uORF3 mutant 5′ UTRs into ATF4-null cells. These constructs behaved similarly to the YFP-ecDHFR reporters, confirming a critical function for uORF3 in mTOR regulation of ATF4 (Figure 3H; Figure S3B).
Stress signals normally trigger ATF4 translation through phosphorylation of the translation factor eIF2α (Walter and Ron, 2011). How eIF2α phosphorylation controls ORF selection in the ATF4 5′ UTR is complex. To begin with, the small ribosomal subunit is recruited to mRNAs along with the ternary complex (TC), which consists of eIF2, GTP, and Met-tRNA(i). Recognition of the start codon of uORF1 or uORF2 triggers hydrolysis of eIF2α-bound GTP and dissociation of eIF2α-GDP from the ribosome. Translation re-initiation can occur at later ORFs but requires the 40S ribosome to bind new TC. High concentrations of TC preferentially drive initiation at the most proximal start codon (uORF3), while low concentrations cause preferential initiation at the distal start codon (the ATF4-encoding ORF). Phosphorylation of eIF2α reduces the cellular concentration of TC by trapping eIF2 in its GDP-bound state, thereby causing preferential initiation at the distal ORF encoding ATF4. We found that mTOR inhibition decreases eIF2α phosphorylation slightly (Figure 2A), but that this appears to reflect a transient increase in aminoacylated tRNAs that accompanies the inhibition of translation and deactivates GCN2, an eIF2α kinase that is activated by AA starvation (Harding et al., 2000). In GCN2-null cells, mTOR inhibition continued to deplete ATF4 protein with no effect on eIF2α phosphorylation (Figure 3I). Additionally, Manning and colleagues found that mTOR still controls ATF4 protein levels even in cells where the Ser51 phosphorylation site on eIF2α is mutated to alanine (Ben-Sahra et al., 2016). mTOR therefore controls ATF4 translation through a uORF-dependent mechanism that does not require eIF2α a phosphorylation, its normal trigger.
4E-BPs Are Required for mTOR-Regulated Inhibition of ATF4 Translation
An alternative explanation is that mTOR modulates the concentration of TC independently of eIF2α phosphorylation. mTOR controls general protein synthesis primarily through 4E-BP-dependent regulation of eIF4F, which facilitates the initial and rate-limiting step of translation initiation. Inhibiting mTOR (and eIF4F) would thus decelerate the use of translation factors acting downstream of eIF4F, including the TC. The consequent increase in TC concentration would be expected to decrease ATF4 translation through the same ORF selection mechanism that is controlled by eIF2α phosphorylation.
To test this model, we monitored ATF4 translation in wild-type and 4E-BP-deficient mouse embryonic fibroblasts (MEFs) treated with Torin 1. Previous studies have shown that mTOR inhibition has little effect on general protein synthesis and eIF4F function in cells lacking 4E-BPs (Dowling et al., 2010; Thoreen et al., 2012). Indeed, mTOR inhibition strongly depleted ATF4 protein levels in wild-type MEFs, but it caused negligible changes in 4E-BP-deficient cells (Figure 4A). Overexpression of a dominant-negative 4E-BP1 allele (4E-BP1-4A) in HEK293T cells similarly reduced ATF4 levels (Figure 4C). In contrast, mTOR inhibition reduced ATF4 mRNA levels in both wild-type and 4E-BP-deficient MEFs (Figure 4B), indicating a 4E-BP-independent mechanism for controlling transcript levels that may become significant at later time points (>4 hr). ATF4 mRNA was slightly reduced by 4E-BP1-4A overexpression in HEK293T cells, although this may be a secondary consequence of the relatively long (>24 hr) period of transgene induction required to achieve sufficient expression (Figure 4D). Conversely, overexpression of eIF4E significantly increased ATF4 levels (Figure 4E). Excess eIF4E was unable to prevent mTOR-regulated depletion of ATF4 (Figure S4A), but this likely reflects an inability to overcome the significantly greater abundance of 4E-BPs. While we cannot rule out contributions from additional mTOR-regulated mechanisms, these data firmly argue that eIF4F is a central mediator of mTORC1-dependent regulation of ATF4 translation.
Figure 4. mTOR Controls ATF4 Translation through 4E-BPs.
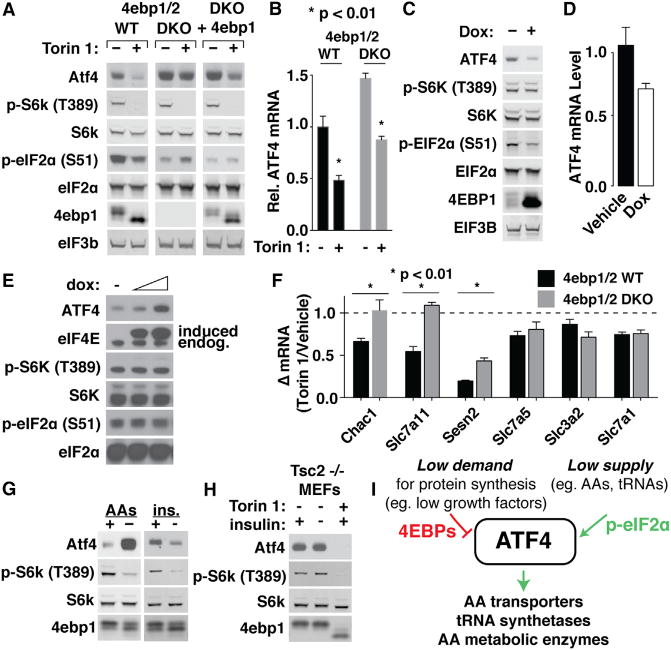
(A) 4E-BPs are required for mTOR control of ATF4. 4E-BP1/2 wild-type (WT), double knockout (DKO), or DKO MEFs stably expressing 4ebp1 (DKO + 4ebp1) were treated with vehicle (DMSO) or 250 nM Torin 1 for 4 hr. Cell extracts were analyzed by immunoblotting for the indicated proteins.
(B) mTOR control of ATF4 mRNA in MEFs is independent of 4E-BPs. RNA was isolated from wild-type or 4E-BP-deficient cells treated as in (A) and analyzed by qPCR for levels of ATF4 mRNA, normalized to RPS20 mRNA (n = 3, error bars are SD).
(C) 4E-BP1 is sufficient to deplete ATF4 protein in HEK293T cells. HEK293T cells stably expressing a doxycycline-inducible 4× Ala 4E-BP1 mutant were treated with dox for 48 hr. Cell extracts were analyzed by immunoblotting for the indicated proteins.
(D) 4E-BP1 reduces ATF4 mRNAs in HEK293T cells. RNA was isolated from cells treated as in (C) and analyzed by qPCR for ATF4 mRNA levels, normalizing it to GAPDH (n = 3, error bars are SD).
(E) Overexpression of EIF4E increases ATF4 protein levels. HEK293T cells stably transduced with dox-inducible EIF4E were treated with 0.1 or 1.0 μg/mL doxycycline for 24 hr, and they were analyzed by immunoblotting for the indicated proteins.
(F) 4E-BPs are required for mTOR control of ATF4 target mRNAs in MEFs. RNA was isolated from 4E-BP1/2 WT or DKO MEFs treated with vehicle (DMSO) or 250 nM Torin 1 and analyzed by qPCR for the indicated mRNAs. All mRNAs were normalized to Gapdh (n = 3, error bars are SD).
(G) Growth factor and AA starvation have opposite effects on ATF4 protein levels. Left panel: WT MEFs were incubated in media with or without AAs + 10% dialyzed FBS for 4 hr. Cell extracts were analyzed by immunoblotting for the indicated proteins. Right panel: WT MEFs were incubated in serum-free media for 24 hr and then stimulated with 500 nM insulin for 4 hr. Cell extracts were analyzed by immunoblotting for the indicated proteins.
(H) Depletion of ATF4 by serum deprivation is mTORC1 dependent. Cell extracts were prepared from Tsc2−/− MEFs serum-starved for 24 hr, and then stimulated with 500 nM insulin ± 250 nM Torin 1 and analyzed by immunoblotting for the indicated proteins.
(I) Model for cellular control of ATF4.
We also wondered whether 4E-BPs were required for mTOR control of ATF4 target mRNAs analyzed in Figure 2F. Interestingly, measurements of these mRNAs in wild-type or 4E-BP-deficient MEFs treated with mTOR inhibitors revealed that 4E-BPs were necessary for the full repression of some transcripts (CHAC1, SLC7A11, and SESN2), while completely dispensable for others (SLC7A5, SLC7A1, and SLC3A2) (Figure 4F). Additionally, the most 4E-BP-regulated mRNAs in MEFs were the same as those that mTOR controls primarily through ATF4 in HEK293T cells (Figure 2F). These results are consistent with a model where mTOR controls ATF4 primarily through 4E-BPs but also a second transcription factor with overlapping specificity through a 4E-BP-independent mechanism. The variable dependence on 4E-BPs likely reflects the varying dependence on ATF4, an attribute that is apparently conserved between mouse and human.
ATF4 Translation Is Modulated by the Demand for Protein Synthesis
A paradox in our model is that the mTOR and eIF2α pathways are both controlled by AA availability, but they have opposite effects on ATF4 translation. In cells, AA starvation consistently increases ATF4 translation, arguing that the eIF2α-regulated mechanism is dominant over the mTOR-regulated one (Figure 4G). This is a logical response, since ATF4 drives the transcription of AA transporters and tRNA synthetases needed to remedy the source of stress; but then, what is the function of mTOR control of ATF4? Unlike eIF2α, mTOR activity also responds to other nutrient signals, including growth factor availability, that impact the demand for protein synthesis (e.g., insulin). Indeed, serum starvation depleted ATF4 protein levels (Figure 4G), consistent with previous reports (Adams, 2007). Serum deprivation had no effect on ATF4 levels in MEFs lacking TSC2, an upstream negative regulator that transmits growth factor signals to mTORC1, confirming mTORC1 as the primary regulator of ATF4 levels in response to growth factor signals (Figure 4H). This response has a similar logic: serum starvation-induced growth arrest results in an excess of AAs because the demand for protein synthesis is reduced.
Based on these results, we propose that ATF4 is a central regulator of AA homeostasis under non-stress conditions where demand for protein synthesis—and consequently AAs—can nonetheless fluctuate (Figure 4I). Under this model, the unique uORF mechanism encoded in the ATF4 5′ UTR acts as a sensor of the balance between the cellular demand for protein synthesis and substrate availability. mTOR inhibition of eIF4F triggers this mechanism by drastically repressing the demand for protein synthesis. The increase in unused factors required for re-initiation (e.g., TC) mimics a decrease in eIF2α phosphorylation and reduces ATF4 translation through the same uORF-dependent mechanism. Finally, it is notable that several ATF4 targets (SESN2, 4E-BP1, and DDIT4/REDD1) are known components of the mTOR-signaling pathway (Walter and Ron, 2011; Yamaguchi et al., 2008; Ye et al., 2015). mTOR control of ATF4 may, therefore, regulate a feedback circuit that tunes the architecture of the pathway in response to its activity.
EXPERIMENTAL PROCEDURES
Materials
Reagents were obtained from the following sources: antibodies for ATF4, S6K, phospho-T389-S6K, eIF2α, phospho-Ser51-eIF2α, 4E-BP1, GCN2, and UPF1 from Cell Signaling Technology; primary antibodies for eIF3b and horseradish peroxidase (HRP)-labeled secondary antibodies from Santa Cruz Biotechnology; IRDye secondary antibodies from LI-COR Biosciences; 14C-labeled AA mixture (011014750) from MP Biomedicals; Trizol and DMEM from Life Technologies; heat-inactivated fetal bovine serum (FBS), recombinant 4E-BP1, and 7mGDP from Sigma-Aldrich; RNase If, polynucleotide kinase, Proto-script II reverse transcriptase, and streptavidin-coated magnetic beads from New England Biolabs; iTaq Universal SYBR Green Supermix and Bradford Protein Assay from Bio-Rad; MTSEA biotin-XX from Pierce/Thermo Fisher Scientific; RNeasy Plus Mini Kit from QIAGEN; and XtremeGENE 9 transfection reagent from Roche.
Cell Culture and Preparation of Cell Extracts
All HEK293T cells and MEFs were grown in high-glucose DMEM supplemented with 10% (v/v) heat-inactivated FBS and penicillin-streptomycin. 4E-BP1/2+/+ and 4E-BP1/2−/− MEFs were kindly provided by N. Sonenberg (McGill University) and GCN2+/+ and GCN2−/− MEFs by D. Ron (University of Cambridge). To prepare extracts, cells rinsed once with ice-cold PBS were lysed in ice-cold lysis buffer (40 mM HEPES [pH 7.4], 2 mM EDTA, 10 mM pyrophosphate, 10 mM glycerophosphate, and 1.0% Triton X-100). The soluble fractions of cell lysates were isolated by centrifugation at 13,000 rpm for 10 min in a microcentrifuge. Protein concentrations were normalized using the Bradford Protein Assay. Isolated proteins were denatured by the addition of sample buffer and boiling for 2 min, followed by immunoblotting.
Mammalian Lentiviral shRNAs and cDNAs
The small hairpin RNA (shRNA) vector for human UPF1 was a gift from Joan Steitz, and it is based on the Sigma/TRC MISSION pLKO.1 vector (TRCN0000413098) but modified to confer blasticidin resistance. Lentivirus was prepared as described previously (Thoreen et al., 2012). The 4E-BP1-4A mutant was constructed by mutating T36, T47, S65, and T70 residues of rat 4E-BP1 to alanines, which was then inserted into a Tet-On plasmid, as described previously (Thoreen et al., 2012). Similarly, wild-type or DuORF3 ATF4 was amplified from cDNA and inserted into a Tet-On version of this plasmid.
Generation of ATF4-Null HEK293T Cells
To generate ATF4-null HEK293T cells, the small guide RNA (sgRNA) sequence TCTCTTAGATGATTACCTGG was inserted into the px330 vector (Cong et al., 2013) and transfected into cells. Then 48 hr after transfection, cells were sorted via fluorescence-activated cell sorting (FACS) into 96-well plates with no more than one cell per well, and they were allowed to form colonies. Colonies were screened for successful ATF4 deletion by immunoblotting.
RNA-Seq and Ribosome Profiling
RNA-seq libraries for HEK293T cells treated with Torin 1 or tunicamycin for 6 hr were prepared using the Clontech SMARTer Stranded Total RNA kit. RNA-seq and ribosome profiling sequencing libraries for HEK293T cells treated with Torin 1 for 24 hr were prepared similarly to previous reports (Ingolia et al., 2012; Thoreen et al., 2012), but with some modifications that are detailed in the Supplemental Experimental Procedures.
Supplementary Material
Highlights.
mTORC1 transcriptionally regulates amino acid transporters and enzymes via ATF4
mTORC1 controls ATF4 by regulating the translation and stability of its mRNA
Control of ATF4 translation requires uORFs, but not changes in eIF2α phosphorylation
mTORC1 control of ATF4 translation instead employs the 4E-BP translation repressors
Acknowledgments
We would like to thank David Ron for the gift of Gcn2+/+ and Gcn2−/− MEFs, David Kwiatkowski for the gift of TSC2−/− MEFs, and Nahum Sonenberg for the gift of 4E-BP1/2+/+ and 4E-BP1/2−/− MEFs. We also thank Nancy Carrasco for assisting with measurements of AA uptake, Mariana Nigro for helpful discussions and technical assistance, and Andrei Alexandrov and Joan Steitz for providing the shRNA vector targeting UPF1. This work is supported by the Yale Top Scholar Award (C.C.T.) and an Institutional Pilot Grant from the American Cancer Society (C.C.T.).
Footnotes
AUTHOR CONTRIBUTIONS
C.C.T. generated RNA-seq and ribosome profiling libraries and conducted bioinformatic analyses. C.C.T. and A.R.-N. conducted AA uptake experiments. L.P. assisted with western blotting and the construction of plasmids. Y.P. performed all remaining experiments. C.C.T and Y.P. designed all experiments and wrote the manuscript.
SUPPLEMENTAL INFORMATION
Supplemental Information includes Supplemental Experimental Procedures, four figures, and four tables and can be found with this article online at http://dx.doi.org/10.1016/j.celrep.2017.04.042.
References
- Adams CM. Role of the transcription factor ATF4 in the anabolic actions of insulin and the anti-anabolic actions of glucocorticoids. J Biol Chem. 2007;282:16744–16753. doi: 10.1074/jbc.M610510200. [DOI] [PubMed] [Google Scholar]
- Barretina J, Caponigro G, Stransky N, Venkatesan K, Margolin AA, Kim S, Wilson CJ, Lehár J, Kryukov GV, Sonkin D, et al. The Cancer Cell Line Encyclopedia enables predictive modelling of anticancer drug sensitivity. Nature. 2012;483:603–607. doi: 10.1038/nature11003. [DOI] [PMC free article] [PubMed] [Google Scholar]
- Ben-Sahra I, Hoxhaj G, Ricoult SJ, Asara JM, Manning BD. mTORC1 induces purine synthesis through control of the mitochondrial tetrahydrofolate cycle. Science. 2016;351:728–733. doi: 10.1126/science.aad0489. [DOI] [PMC free article] [PubMed] [Google Scholar]
- Cong L, Ran FA, Cox D, Lin S, Barretto R, Habib N, Hsu PD, Wu X, Jiang W, Marraffini LA, Zhang F. Multiplex genome engineering using CRISPR/Cas systems. Science. 2013;339:819–823. doi: 10.1126/science.1231143. [DOI] [PMC free article] [PubMed] [Google Scholar]
- Crawford RR, Prescott ET, Sylvester CF, Higdon AN, Shan J, Kilberg MS, Mungrue IN. Human CHAC1 Protein Degrades Glutathione, and mRNA Induction Is Regulated by the Transcription Factors ATF4 and ATF3 and a Bipartite ATF/CRE Regulatory Element. J Biol Chem. 2015;290:15878–15891. doi: 10.1074/jbc.M114.635144. [DOI] [PMC free article] [PubMed] [Google Scholar]
- Dowling RJ, Topisirovic I, Alain T, Bidinosti M, Fonseca BD, Petroulakis E, Wang X, Larsson O, Selvaraj A, Liu Y, et al. mTORC1-mediated cell proliferation, but not cell growth, controlled by the 4E-BPs. Science. 2010;328:1172–1176. doi: 10.1126/science.1187532. [DOI] [PMC free article] [PubMed] [Google Scholar]
- Duffy EE, Rutenberg-Schoenberg M, Stark CD, Kitchen RR, Gerstein MB, Simon MD. Tracking Distinct RNA Populations Using Efficient and Reversible Covalent Chemistry. Mol Cell. 2015;59:858–866. doi: 10.1016/j.molcel.2015.07.023. [DOI] [PMC free article] [PubMed] [Google Scholar]
- Düvel K, Yecies JL, Menon S, Raman P, Lipovsky AI, Souza AL, Triantafellow E, Ma Q, Gorski R, Cleaver S, et al. Activation of a metabolic gene regulatory network downstream of mTOR complex 1. Mol Cell. 2010;39:171–183. doi: 10.1016/j.molcel.2010.06.022. [DOI] [PMC free article] [PubMed] [Google Scholar]
- Feldman ME, Apsel B, Uotila A, Loewith R, Knight ZA, Ruggero D, Shokat KM. Active-site inhibitors of mTOR target rapamycin-resistant outputs of mTORC1 and mTORC2. PLoS Biol. 2009;7:e38. doi: 10.1371/journal.pbio.1000038. [DOI] [PMC free article] [PubMed] [Google Scholar]
- Harding HP, Novoa I, Zhang Y, Zeng H, Wek R, Schapira M, Ron D. Regulated translation initiation controls stress-induced gene expression in mammalian cells. Mol Cell. 2000;6:1099–1108. doi: 10.1016/s1097-2765(00)00108-8. [DOI] [PubMed] [Google Scholar]
- Harding HP, Zhang Y, Zeng H, Novoa I, Lu PD, Calfon M, Sadri N, Yun C, Popko B, Paules R, et al. An integrated stress response regulates amino acid metabolism and resistance to oxidative stress. Mol Cell. 2003;11:619–633. doi: 10.1016/s1097-2765(03)00105-9. [DOI] [PubMed] [Google Scholar]
- Ingolia NT, Brar GA, Rouskin S, McGeachy AM, Weissman JS. The ribosome profiling strategy for monitoring translation in vivo by deep sequencing of ribosome-protected mRNA fragments. Nat Protoc. 2012;7:1534–1550. doi: 10.1038/nprot.2012.086. [DOI] [PMC free article] [PubMed] [Google Scholar]
- Iwamoto M, Björklund T, Lundberg C, Kirik D, Wandless TJ. A general chemical method to regulate protein stability in the mammalian central nervous system. Chem Biol. 2010;17:981–988. doi: 10.1016/j.chembiol.2010.07.009. [DOI] [PMC free article] [PubMed] [Google Scholar]
- Kang SA, Pacold ME, Cervantes CL, Lim D, Lou HJ, Ottina K, Gray NS, Turk BE, Yaffe MB, Sabatini DM. mTORC1 phosphorylation sites encode their sensitivity to starvation and rapamycin. Science. 2013;341:1236566. doi: 10.1126/science.1236566. [DOI] [PMC free article] [PubMed] [Google Scholar]
- Laplante M, Sabatini DM. mTOR signaling in growth control and disease. Cell. 2012;149:274–293. doi: 10.1016/j.cell.2012.03.017. [DOI] [PMC free article] [PubMed] [Google Scholar]
- Lu PD, Harding HP, Ron D. Translation reinitiation at alternative open reading frames regulates gene expression in an integrated stress response. J Cell Biol. 2004;167:27–33. doi: 10.1083/jcb.200408003. [DOI] [PMC free article] [PubMed] [Google Scholar]
- Mali P, Yang L, Esvelt KM, Aach J, Guell M, DiCarlo JE, Norville JE, Church GM. RNA-guided human genome engineering via Cas9. Science. 2013;339:823–826. doi: 10.1126/science.1232033. [DOI] [PMC free article] [PubMed] [Google Scholar]
- Mendell JT, Sharifi NA, Meyers JL, Martinez-Murillo F, Dietz HC. Nonsense surveillance regulates expression of diverse classes of mammalian transcripts and mutes genomic noise. Nat Genet. 2004;36:1073–1078. doi: 10.1038/ng1429. [DOI] [PubMed] [Google Scholar]
- Peng T, Golub TR, Sabatini DM. The immunosuppressant rapamycin mimics a starvation-like signal distinct from amino acid and glucose deprivation. Mol Cell Biol. 2002;22:5575–5584. doi: 10.1128/MCB.22.15.5575-5584.2002. [DOI] [PMC free article] [PubMed] [Google Scholar]
- Sato H, Nomura S, Maebara K, Sato K, Tamba M, Bannai S. Transcriptional control of cystine/glutamate transporter gene by amino acid deprivation. Biochem Biophys Res Commun. 2004;325:109–116. doi: 10.1016/j.bbrc.2004.10.009. [DOI] [PubMed] [Google Scholar]
- Smith CM, Steitz JA. Classification of gas5 as a multi-small-nucleolar-RNA (snoRNA) host gene and a member of the 5′-terminal oligopyrimidine gene family reveals common features of snoRNA host genes. Mol Cell Biol. 1998;18:6897–6909. doi: 10.1128/mcb.18.12.6897. [DOI] [PMC free article] [PubMed] [Google Scholar]
- Sonenberg N, Hinnebusch AG. Regulation of translation initiation in eukaryotes: mechanisms and biological targets. Cell. 2009;136:731–745. doi: 10.1016/j.cell.2009.01.042. [DOI] [PMC free article] [PubMed] [Google Scholar]
- Thoreen CC, Kang SA, Chang JW, Liu Q, Zhang J, Gao Y, Reichling LJ, Sim T, Sabatini DM, Gray NS. An ATP-competitive mammalian target of rapamycin inhibitor reveals rapamycin-resistant functions of mTORC1. J Biol Chem. 2009;284:8023–8032. doi: 10.1074/jbc.M900301200. [DOI] [PMC free article] [PubMed] [Google Scholar]
- Thoreen CC, Chantranupong L, Keys HR, Wang T, Gray NS, Sabatini DM. A unifying model for mTORC1-mediated regulation of mRNA translation. Nature. 2012;485:109–113. doi: 10.1038/nature11083. [DOI] [PMC free article] [PubMed] [Google Scholar]
- Vattem KM, Wek RC. Reinitiation involving upstream ORFs regulates ATF4 mRNA translation in mammalian cells. Proc Natl Acad Sci USA. 2004;101:11269–11274. doi: 10.1073/pnas.0400541101. [DOI] [PMC free article] [PubMed] [Google Scholar]
- Walter P, Ron D. The unfolded protein response: from stress pathway to homeostatic regulation. Science. 2011;334:1081–1086. doi: 10.1126/science.1209038. [DOI] [PubMed] [Google Scholar]
- Yamaguchi S, Ishihara H, Yamada T, Tamura A, Usui M, Tominaga R, Munakata Y, Satake C, Katagiri H, Tashiro F, et al. ATF4-mediated induction of 4E-BP1 contributes to pancreatic beta cell survival under endoplasmic reticulum stress. Cell Metab. 2008;7:269–276. doi: 10.1016/j.cmet.2008.01.008. [DOI] [PubMed] [Google Scholar]
- Ye J, Palm W, Peng M, King B, Lindsten T, Li MO, Koumenis C, Thompson CB. GCN2 sustains mTORC1 suppression upon amino acid deprivation by inducing Sestrin2. Genes Dev. 2015;29:2331–2336. doi: 10.1101/gad.269324.115. [DOI] [PMC free article] [PubMed] [Google Scholar]
Associated Data
This section collects any data citations, data availability statements, or supplementary materials included in this article.