

Abstract
Homogeneous assays are characterized by rapidity, low cost, and simple workflows. However, relatively few specialized homogeneous platforms have garnered significant use in biological studies. Inconsistencies in matrix interferences, limited multiplexability, and the requirement for specialized instrumentation are among the various reasons for delayed acceptance. Recently, we have shown that DNA-driven protein assays using thermofluorimetric analysis (TFA) can limit matrix interference and promote multiplexing, all while requiring only a standard qPCR instrument for readout. Here, we show that homogeneous, one step (mix-and-read) TFA methods can be extended to the analysis of both a small molecule second messenger, cyclic adenosine monophosphate (cAMP), and a downstream cell-secreted hormone, insulin. Differential thermal analysis of DNA melting in these assays allowed analytical discrimination of background and signal without physical separation. The direct-readout, differential nature of TFA also promoted assay consistency and minimized calibration burden; analyte response curves were shown to be highly repeatable for up to 7 months. TFA protocols were validated by homogeneous quantification of both cAMP and insulin from single pancreatic islets undergoing a variety of treatments (glucose, KCl, glucose-responsive insulinotropic peptide (GIP), forskolin) that act upon glucose transporters, potassium and calcium channels, and G-protein-coupled receptors to modulate exocytosis. The results of this study suggest that TFA should be applicable to homogeneous quantification of a variety of small molecule messengers and protein analytes with standard instrumentation, thereby simplifying workflows in studies of cell-signaling cascades.
Graphical abstract

In terms of analytical workflow, biochemical assays can be characterized as heterogeneous (requiring separation or washing steps) or homogeneous (no separation or washing). Since a common ambition of bioanalytical scientists is to simplify workflows by limiting user interaction and providing rapid sample-to-answer time, homogeneous assay formats have become increasingly desirable. However, these formats often suffer from the inability to discriminate target-dependent signal from target-independent background. Thus, heterogeneous assay formats have largely prevailed, particularly in studies on cell signaling. In this case, users typically require a combination of bioanalytical platforms, immunoassays, coupled enzyme assays, DNA/RNA amplification, separations, and so on, along with suites of instruments that are specialized to each assay. Consequently, opportunities exist for analytical scientists to customize molecular assays in a way that not only simplifies workflow, but also minimizes instrumentation. A desirable solution would be a single-step (mix-and-read), homogeneous assay with good background rejection that is compatible with standard instrumentation.
For biomolecule detection, immunoassays or aptamer-based assays are often preferred due to specificity. The perennial gold standard in protein quantification is a heterogeneous immunoassay, the enzyme-linked immunosorbent assay (ELISA). ELISA is highly flexible and demonstrates good sensitivity and selectivity for antigen detection, yet the method requires several hours of incubation and washing steps and has limited multiplexability. Various alternatives have been devised, such as exquisitely sensitive heterogeneous digital immunoassays such as Simoa,1 highly multiplexable homogeneous assays such as AlphaLISA,2 electrochemical immunoassays,3–6 and others. While several of these alternatives show high performance, a common disadvantage is the need for specialized equipment and reagents, which increases costs and reduces the probability of use in the average research laboratory.
One promising approach is to modify recently developed DNA-driven protein4,5,7–13 and small-molecule assays14,15 toward readout on a single instrument. Since these assays effectively translate analyte quantities into measurable DNA hybridization, fluorescence quenching, and DNA melting analysis is ideal for this purpose and requires only standard instrumentation such as a qPCR instrument that enables temperature scanning during fluorescence readout. Indeed, our recent work has shown that antibody-oligonucleotide10 or aptamer10,13 probes can be interrogated by thermofluorimetric analysis (TFA) to permit facile discrimination of signal and background in protein assays. A key concept in TFA is that “signal complexes” consisting of probe-bound protein targets can be analytically separated from “background complexes” (probes only, no target) using DNA melting analysis. Particularly for DNA hybridization driven assays, protein quantities can be effectively translated into DNA melting transitions due to the thermodynamic stability imparted by target binding. This differential approach also permits rejection of background fluorescence interferences in matrices such as human serum or cell lysates.
In this work, we show that thermofluorimetric analysis (TFA) using a standard qPCR instrument can be further adapted to analyze two types of molecules of high importance to cell signaling studies: hormones and second-messengers. Previously developed DNA-driven assays for cyclic adenosine monophosphate (cAMP)15 and insulin8,9 are shown to exhibit improved performance when adapted to our TFA readout methodology.10,13 Differential thermal analysis allowed discrimination of signal and background without physical separation and negated matrix effects in cell lysates or cell perfusates, allowing both cAMP and insulin to be quantified from single pancreatic islets under various treatments and in a temporally resolved manner. Finally, an additional albeit unexpected benefit of TFA was discovered. Presumably due to the direct- readout mechanism (nonamplified) and the corrective differential analysis, signal magnitudes and, thus, calibration curves, were highly repeatable over a period as long as 7 months. Overall, this approach simplifies quantitative readout of proteins and small molecules to a single instrument that can also be used for DNA and RNA analyses, it provides a homogeneous mix-and-read workflow, and it minimizes calibration burden in cell signaling studies.
EXPERIMENTAL DESIGN
Reagents and Instrument
Bridge-It Cyclic AMP (cAMP) all in one Assay Kits and Human Insulin FRET-PINCER Assay Kits were purchased from Mediomics, LLC (St. Louis, MO). Rat/Mouse Insulin ELISA kits (EZRMI-13K), Human Insulin solution, and bovine serum albumin (BSA) were all obtained from Millipore Sigma. Heat inactivated HyClone Fetal Bovine Serum (FBS) was from Gel Healthcare Life Sciences. The human insulin concentration was confirmed by protein absorbance at 280 nm (A280) using a NanoDrop 1000 spectrophotometer (Thermo Fisher). Hanks’ Balanced Salt Solution (HBSS) was purchased from Lonza. D-Glucose, HEPES (4,2-hydroxyethyl-1-piperazineethanesulfonicacid), penicillin-streptomycin, NaCl, CaCl2·2H2O, KCl, and MgCl2·6H2O were purchased from Sigma-Aldrich (St. Louis, Missouri). Roswell Park Memorial Institute (RMPI) 1640, 1× with L-glutamine/without glucose is from the Corning cellgro (MT-10043CV). Collagenase P was from Roche. Glucose- responsive insulinotropic peptide (GIP) was obtained from Bachem Americas (Torrance, CA). Forskolin (>95.0%, HPLC) was purchased from TCI America. The real-time quantitative PCR (qPCR) instrument used in all experiments was a Bio-Rad CFX96.
TFA Insulin Assay
To prepare assay probe solutions with the dual antibody-oligo probes, Pincer A and B stock solutions were diluted 25-fold and mixed using buffer C in the PINCER assay kit (Mediomics, LLC). A total of 10 different concentrations of insulin used for the standard curve were made from the stock insulin solution by dilution in BMHH buffer with 0.1% BSA, containing 10 mM HEPES, 125 mM sodium chloride, 5.7 mM potassium chloride, 2.5 mM calcium chloride, and 1.2 mM magnesium chloride. A 10 μL assay probe solution and 10 μL insulin standard were mixed and incubated at room temperature for 30 min and then loaded into the qPCR instrument. In cell assays, 4–5 islets were incubated in 40 μL of various treatment solutions for 1 h, and supernatants were collected. Aliquots of these samples were diluted 1-4-fold with buffer to a total of 10 μL and then mixed with 10 μL assay probe solution and loaded into the instrument. Using the qPCR instrument for TFA, the mixtures were incubated at 4 °C for 10 min and then scanned thermally from 4 to 50 °C with a 0.5 °C increment and a 10 s delay before each fluorescence emission measurement. The FAM channel (λexcitation = 470 ± 20 nm, λemission = 522 ± 8 nm) was chosen for fluorescence excitation and emission quantification for each solution during thermal scanning. The FRET donor and acceptor in this assay was FAM (a fluorescein derivative) and Cy5, respectively, although Cy5 was used merely as a FAM emission quencher within this work.
TFA cAMP Assay
To prepare assay probe solutions, the all in one assay solution and the 10× lysis buffer from the assay kit were warmed at 37 °C for 30 min then mixed together. A total of 10 different concentrations of cAMP used for the standard curve were made from the stock cAMP solution using 1× KRB- IBMX buffer. A 10 μL assay solution and 10 μL cAMP standard solution were mixed and incubated at room temperature for 45 min, then loaded into the qPCR instrument. Cell sampling for cAMP assays were carried out on single islets as described below. For TFA readout, the solutions were incubated at 4 °C for 10 min and then scanned thermally from 4 to 94 °C with 0.5 °C temperature increment and a 10 s delay before each fluorescence emission measurement using the FAM channel, as noted above. The FRET donor and quencher in this assay was FAM and DABCYL, respectively.
Tissue Extraction
Pancreatic tissues were extracted and islets were isolated as described previously16,17 from live C57BL/6J male mice. After extraction, islets were transferred and cultured in islet medium (RPMI 1640 with 10% heat inactivated FBS, 10 μg/mL penicillin-streptomycin and 11 mM glucose) at 37 °C under humidified 5% CO2 overnight before using.
Single Islet Assays
For a given single-islet experiment, cultured islets were picked up and starved in the 3 mM glucose solution at 37 °C under humidified 5% CO2 for 1 h and then equilibrated in KRB-IBMX buffer for 15 min at room temperature. Later, a single islet was taken out and placed in an 8 μL solution with different treatments at 37 °C for 30 min. A total of 5 μL of the supernatants were collected for insulin secretion quantification by insulin TFA as detailed above. The remaining islet was lysed in a total of 20 μL lysis/assay buffer, and two 10 μL aliquots were analyzed by cAMP TFA as described above. For the dynamic, time-resolved studies, 21 different sets of single islets (all in different tubes with 8 μL of solution) were treated for different time periods (from 0 to 60 min, 3 min increment) in duplicate or triplicate; sample collection and cell lysis methods were the same as above.
Statistical Analysis Methods
The Student’s unpaired t test with heterogeneous variance was used to process data for islet experiments. The Deming’s regression method was used for the correlation plot between the TFA assay and ELISA for insulin.
RESULTS AND DISCUSSION
Single Instrument for Second Messengers and Hormones
Studies on the biology of cell signaling often necessitate confirmation of mechanistic pathways that signal through second messengers and lead to a cellular outcome such as hormone secretion. With current methodology, these studies typically require a combination of multistep techniques with customized instruments, resulting in prolonged analytical workflow and a need for additional expertise. As depicted in Figure 1, our approach permits quantification of intracellular signals and secreted hormones from the same cells by leveraging thermofluorimetric analysis (TFA) with a standard qPCR instrument.
Figure 1.
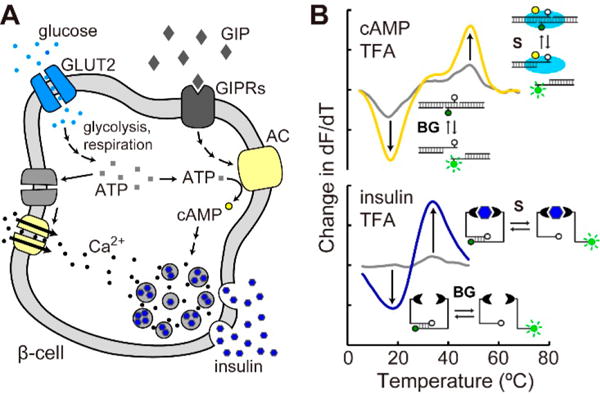
Thermofluorimetric analysis (TFA) for homogeneous, mix-and-read, bioanalysis of second messengers and secreted hormones with a standard qPCR instrument. (A) Schematic of pancreatic β-cell signaling that is interrogated by TFA in this work. (B) Differential thermal analysis of fluorescence signals can be used to quantify either intracellular cAMP or secreted insulin using DNA-driven assay formats. Changes in signal (S) and background (BG) melting transitions are shown alongside schematics of both assay formats.
In this work, we chose to interrogate insulin secretion pathways in pancreatic islets to demonstrate the benefits of TFA. Insulin is well-known as a dominant endocrine hormone which is secreted by β-cells within pancreatic islets. The hormone serves as a signal to various other tissues such as muscle, adipose, liver, and brain,18,19 and it is the key hormone that encounters disrupted signaling in obesity, diabetes, and metabolic syndrome.20 Glucose stimulates insulin secretion in a cascade through glucose transporters (GLUT2), glycolysis and respiration, depolarization of the cell membrane (K+ and Ca2+ channels), and exocytosis (Figure 1A). The “incretin effect” is a more recently discovered phenomenon defined by the significantly larger amount of insulin secreted after oral glucose input compared to intravenous glucose challenge. Gut-secreted glucose-responsive insulinotropic peptide (GIP) was discovered as one of the incretin hormones,21–25 and it is a potent stimulant of insulin release in the hyperglycemic state. GIP signals through its receptor and increases cyclic AMP (cAMP), which affects various pathways in β-cell depolarization to amplify both the first and the second phases of insulin secretion26 (Figure 1A). To study GIP related signaling in β- cells or pancreatic islets, cAMP and insulin assays are obligatory. As depicted in Figure 1B, we have developed homogeneous, mix-and-read TFA protocols using two DNA- driven assays, allowing insulin and cAMP levels to be quantified with a single instrument. Fluorescence emission readout during thermal scanning allows differential thermal analysis (dF/dT) to be applied. We have previously shown that this approach allows separation of signal and background (two peaks for each trace in Figure 1B) and effectively negates matrix-based interferences.10,13
TFA Using DNA-Driven Assays for Insulin and cAMP
The insulin assay used in this work was originally designed for isothermal fluorescence readout. Antibody-oligonucleotide probes (Figure 1B, bottom) provide a fluorescence resonance energy transfer (FRET) response in proportion to insulin,8,9 driven by a target-dependent entropic stabilization often referred to as the “proximity effect”.4,5,10,12,27 FRET occurs from a fluorophore labeled oligo to either a quencher molecule or a FRET pair on the other oligo. We hypothesized that adaptation of our TFA methodology10,13 to these probes would improve consistency and limit of detection while helping negate potential background interferences in cell perfusates.
Differential thermal analysis with these probes in the presence of varied insulin concentrations is shown in Figure 2A. Details of data collection and analysis are shown in Figure S-1 in a stepwise fashion. These results show melting transitions that represent analytical separation of background (peak at ∼20 °C) and signal (peak at ∼33 °C). The melting peaks represent fluorescence dequenching transitions as the antibody-oligos dissociate, and this peak shifts to a higher temperature when insulin provides increased thermodynamic stability to the complex. As insulin concentration was increased, the background peak decreased as the signal peak emerged and grew larger. Interestingly, the quality of this separation was comparable to our prior results using thrombin aptamer pairs yet was significantly improved compared to our in-house synthesized antibody-oligos.10 This enhancement could be a result of either the improved purification of the probes or the simplification of the proximity assembly in this version of the assay, which does not require connector oligos. Leveraging the blank (zero insulin) subtraction method approach presented in our prior work,13 the insulin-dependent portions of the TFA curves could then be easily visualized (Figure 2B) and applied for the quantitative analysis presented below.
Figure 2.
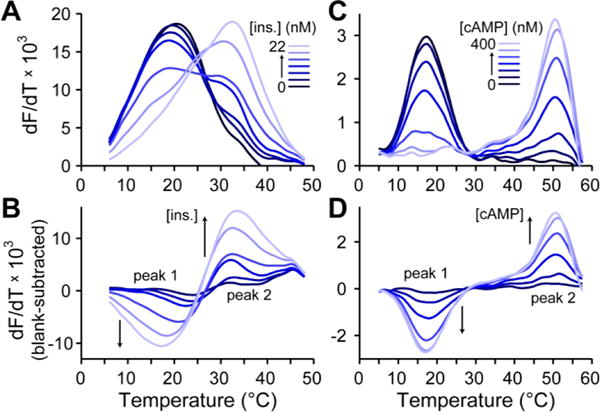
Representative data from insulin and cAMP TFA. (A) dF/dT curves with antibody-oligo probes show melting transitions that shift and change intensity in proportion to insulin levels. (B) Blank-subtracted dF/dT curves show clear insulin-dependent changes and allow removal of background interferences. (C) dF/dT curves with DNA-binding protein and oligo probes exhibit melting transitions that are cAMP-dependent. (D) Similar, blank-subtracted curves for cAMP quantification.
The cAMP assay used in this work was originally designed for isothermal fluorescence readout as well. In this case, cAMP serves as a ligand that stabilizes a DNA-binding protein toward associating with its recognition sequence.14,15 The recognition sequence of DNA is thus thermodynamically stabilized by the presence of cAMP, and a FRET pair can be used for readout. Again, we hypothesized that adaptation of our TFA method ology10,13 to these probes would result in the concomitant improvements in performance.
Differential thermal analysis with these probes in the presence of varied cAMP concentrations is shown in Figure 2C. Data collection and analysis is detailed in Figure S-1. This assay showed nicely separated melting transitions. Background peaks were observed at ∼17 °C and signal peaks at ∼51 °C, representing the best separation (ΔT = 34 °C) achieved thus far with our TFA protocols. This separation quality is due to the high affinity of DNA-binding protein to its target DNA in the presence of the cAMP ligand28 (∼0.1 nM). Increases in cAMP concentration thus resulted in decreased background peak heights and increased signal peak heights, which is more easily visualized using the blank subtraction approach (Figure 2D). To our knowledge, these data represent the first application of TFA to a DNA hybridization driven small molecule assay. Blank-subtracted data, as shown in Figure 2B,D, allowed removal of matrix effects13 and was used for the subsequent calibrations and quantitative analysis of insulin and cAMP during cell signaling.
Highly Repeatable Standard Curves for Insulin and cAMP
Blank-subtracted data, such as that shown in Figure 2B,D, were used to generate TFA-derived standard curves for both insulin (Figure 3) and cAMP (Figure 4). This method allowed robust confirmation of the target-dependent response and the mechanism of binding. For instance, the insulin calibration curve shown in Figure 3A could be generated by calculating the difference between the blank-subtracted dF/dT values of Peaks 2 and 1 (from Figure 2B). The data can also be used to confirm that the total amount of probes remains constant (target-bound and unbound) by plotting the sum of Peak 2 and Peak 1 intensities in Figure 3B. The fact that this sum is statistically equal to zero and is unchanged by analyte concentration proves that the analyte (insulin) is simply shifting the probes from a lower stability state (background peak, Peak 1) to a higher stability state (signal peak, Peak 2), but not altering the total number of probes.
Figure 3.

Repeatable insulin TFA calibrations for minimized calibration burden. (A) Over a seven-month period, insulin TFA assays were highly reproducible (R2 = 0.989 for Hill equation fitting, dashed curve). Inset is a log-scale plot of the same data. (B) TFA peak sums were statistically equal to zero and unchanged by analyte concentration, confirming that insulin simply shifts the probes from the unquenched state to the quenched state without altering the total number of probes.
Figure 4.

Repeatable cAMP TFA calibrations also minimized calibration burden. (A) Over a four-month period, cAMP TFA assays were highly reproducible (R2 = 0.988 for Hill equation fitting, dashed curve). Inset is a log-scale plot of the same data. (B) TFA peak sums were statistically equal to zero and unchanged by analyte concentration, as before with insulin (Figure 3B).
Interestingly, the blank-subtraction method imparted unexpected consistency to the assay response. The three calibration curves shown in Figure 3A were collected over a period of 7 months, yet the response (Peak 2 - Peak 1) was essentially equivalent. Even when combining all data over 7 months into a three-parameter Hill eq (eq 1) for a nonlinear least-squares fitting, the data was highly correlated (R2 = 0.989), with well-defined calibration parameters (a = 0.7391 ± 0.0671; b = 1.1142 ± 0.0965; c = 8.71 ± 1.69). The Hill equation was used due to the lack of an adequate analytical model for this assay, and the b value above 1.0 suggests a mild degree of cooperativity in binding of the antibody-oligo probes with target proteins. The 3σ limit of detection (LOD) was calculated to be 0.82 nM using the linear portion of this curve at lower concentrations, and the dynamic range extends to 22 nM under these conditions.
| (1) |
Similar trends were observed using the blank-subtracted data from the cAMP TFA experiments. Peak difference data (Figure 4A) was responsive to cAMP levels, while peak sum data (Figure 4B) remained near zero and constant. Although the peak sum data did seem to deviate slightly from zero at a few points, the overall response was not correlated. Likewise, the three calibrations shown in Figure 4A were collected over a period of four months, and the response was essentially equivalent. The combination of all data gave a nicely correlated (R2 = 0.988) response when fit to eq 1, with well-defined parameters (a = 0.1337 ± 0.0029; b = 1.9022 ± 0.1379; c = 43.1945 ± 2.0399). The b value near 2.0 suggests significant cooperativity in binding, which is to be expected in this multicomponent assay format. The 3σ limit of detection (LOD) was calculated to be 10.8 nM using the linear portion of the curve at lower concentrations, and the dynamic range extends to 200 nM.
In general, this high level of repeatability for both insulin and cAMP TFA adds to the practical value of the homogeneous, mix-and-read methodology. In our laboratory, this benefit allowed us to minimize the burden of calibrations during cell signaling studies. It was not necessary to carry out full range, multipoint calibrations on a day-to-day basis. In practice, we would run one or two standards (blank and high concentration) for quality control with each set of samples, then run a more thorough, 10-point system calibration (as shown in Figures 3 or 4) every few weeks. Indeed, in validation experiments comparing insulin TFA with insulin ELISA on cell secretion samples, the methods were highly correlated despite having run samples for several months on a single TFA calibration curve (Deming’s regression, Figure S-1).
Insulin Secretion Quantification from Islets with TFA
These simplified workflows, the minimized calibration require ments, and the low-volume sample compatibility permitted a number of biological experiments to be performed, even on single pancreatic islets. Following a variety of treatments on groups of 4-5 islets, supernatant was collected for insulin secretion quantification by TFA. As shown in Figure 5A, islets responded to increases in glucose (3-11 mM) by secreting more insulin, as expected. The 100 μM diazoxide, a potassium channel activator that repolarizes the β-cells, decreased insulin secretion even at high glucose. Finally, 25 mM KCl effectively depolarized the cells further, promoting additional insulin secretion at high glucose.
Figure 5.

Biological validation of insulin TFA with antibody-oligo probes for assays on single pancreatic islets. (A) Single islets under various treatments were successfully assayed by TFA, with expected responses recorded. (B) GIP-dependent amplification of insulin secretion was also observed to be glucose-dependent, with (C) amplification ratios that showed at least 50% amplification at stimulatory glucose concentrations, but no amplification at low glucose. **denotes p < 0.01 by student’s t test.
The incretin effect was also evaluated with single-islet experiments using GIP treatments. As shown in Figure 5B,C, the glucose dependence of GIP-amplified insulin secretion was confirmed with single islets. More than 50% increases in insulin secretion were observed at all stimulatory glucose concentrations in the presence of 250 nM GIP, but there was no amplification observed at low glucose (3 mM), in agreement with previous studies on the incretin effect.21–25
Our simple, mix-and-read insulin TFA protocols were thus validated with single islets undergoing treatments that modulate exocytosis by acting on glucose transporters, potassium and calcium channels, and G-protein-coupled receptors.
Insulin and cAMP Assays on Single Islets with TFA
Both GIP and glucagon-like peptide-1 (GLP-1) are important incretin hormones synthesized and secreted by the gastro intestinal cells following meal ingestion. The principal function of GIP and GLP-1 in pancreatic β-cells is to elevate glucose-induced insulin secretion,21,24 as validated with our method in Figure 5B,C. Akin to GLP-1, the incretin effect of GIP is through the incretin/cAMP pathway.22,29 As depicted in Figure 1A, GIP binds to the GIP receptor (GIPR), a G protein- coupled receptor which further activates adenylyl cyclase (AC) to stimulate the formation of cAMP from ATP. cAMP activates various downstream pathways, and its combined effects with glycolysis results in a GIP-potentiated insulin secretion that only functions at high glucose levels.30,31 Glucose alone is insufficient at raising cAMP, as GIP alone is insufficient in amplifying insulin secretion, but these treatments together result in amplified insulin secretion.
Consequently, the glucose-dependent, GIP-amplified insulin secretion pathways in β-cells of pancreatic islets are ideal for validation of our TFA methodology capable of measuring both insulin and cAMP with a single qPCR instrument. In each experiment, a single islet was stimulated, supernatant was sampled for insulin TFA, then the islet was lysed, and intracellular contents were sampled for cAMP TFA. Forskolin was chosen as a pharmacological cAMP-raising reagent on pancreatic islets, since it boosts intracellular cAMP through adenylyl cyclase (AC)32 and has been shown to have a significant effect on enhancing cAMP levels in islets.33 Forskolin can thus be used as a GIP mimicking reagent. The cAMP TFA results shown in Figure 6A provide clear affirmation of these effects in single islets. Forskolin at both 1 μM and 10 μM strongly stimulated cAMP production within islets at both low (3.0 mM) and high (16.8 mM) glucose levels. GIP, however, only significantly increased cAMP at high glucose levels.
Figure 6.
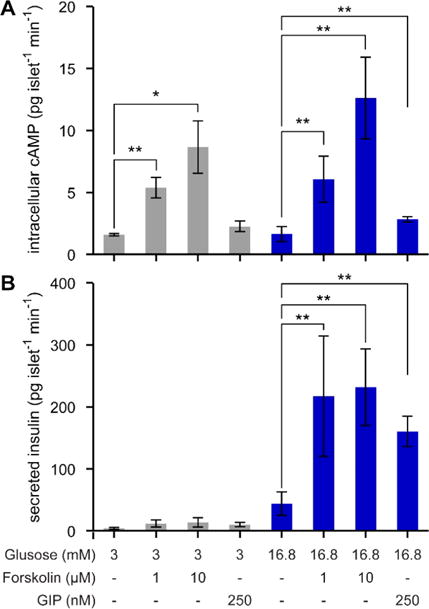
Quantitative analysis of cell signaling in single islets using TFA for both insulin and cAMP. (A) At low and high glucose levels, forskolin strongly stimulated cAMP at both 1 μM and 10 μM. GIP only significantly increased cAMP at high glucose levels. (B) The glucose-dependence of GIP-potentiated insulin secretion was validated, since the amplification only occurred at high glucose for either forskolin or GIP treatments. **p < 0.01 by student’s t test.
The insulin TFA results shown in Figure 6B show the glucose-dependent nature of GIP-potentiated secretion. No significant increases in single-islet insulin secretion were observed at low glucose, using either forskolin or GIP. However, at high glucose levels, insulin secretion was strongly amplified by both forskolin and GIP treatments. These results validated the permissive role of cAMP in amplifying insulin secretion.30 Before the amplification pathway is initiated, the glucose-triggered pathway must first be activated.
The results in Figure 6 further validated our TFA protocols for cell signaling studies with a single instrument and simple workflows. Since TFA can eliminate most of the background interference from sample matrices, complicated and time-costing cAMP extraction steps from the lysis solution were not needed, and insulin quantification could be carried out on supernatants with little interference.
Temporally Resolved Insulin and cAMP Assays on Single Islets
The nonamplified, direct-readout nature of TFA allows small volumes to be assayed, as low as 100 picoliters in our prior work.10 This benefit permitted time-resolved studies of both insulin secretion and intracellular cAMP levels every 3 min, even on the same single islets (Figure 7). Insulin secretion was observed to increase in a biphasic manner after changing glucose from 3.0 to 16.8 mM, while cAMP levels were undetectable in single islets at this temporal resolution. However, upon addition of 10 μM forskolin, both cAMP and insulin were detectable at 3 min resolution from single islets using TFA. To our knowledge, this is the first representation of both insulin and cAMP quantification from single islets at high temporal resolution, a feat enabled by the simplicity of TFA workflows and instrumentation.
Figure 7.

Single-islet insulin and cAMP levels could be assayed with TFA at 3 min temporal resolution. These results were enabled by the simple workflow, low volume requirement, and direct readout nature of TFA with a standard qPCR instrument.
CONCLUSIONS
Thermofluorimetric analysis (TFA) has been validated herein as a promising approach for studies on cell signaling. The merits of TFA include its simple mix-and-read workflow, high calibration repeatability, small sample volume requirement, and the repurposing of a widely adopted nucleic acid analysis instrument for both hormone and second messenger quantification. These qualities distinguish TFA from previously reported methods and enable a number of biological experi ments to be conducted with ease. Although LODs are certainly lower using amplified assays with more complex workflows (e.g., ELISA), the subnanomolar to upper nanomolar detection ranges demonstrated herein compare favorably with other nonamplified, direct-readout methods in the literature.
In the short term, considering the importance of incretin effects in diabetes, obesity, and metabolic syndrome,21–25 TFA represents a robust, new tool that could immediately impact studies on incretin-amplified insulin secretion from islets or β-cells. In the future, it should be straightforward to adapt the antibody-oligonucleotide version of TFA to any protein or target with two antibodies (or aptamers), and the development of additional DNA-driven assays for small molecules and second messengers would expand the catalogue of TFA analytes. Multiplexing through spectrally resolved fluorophores and thermally resolved melting transitions has already been shown to be feasible,10 thus, further work in this area should permit small-volume, mix-and-read assays on a variety of analytes to be carried out in a single tube. Finally, due to its nonamplified, direct-readout nature, adaptation of TFA to the microfluidic platform10 is an obvious yet important field to explore in the future.
Supplementary Material
Acknowledgments
Funding for this work was provided by the National Institutes of Health, Award R01 DK093810, and by the National Science Foundation, Awards CBET-1403495 and IIP-1549771.
Footnotes
Supporting Information
The Supporting Information is available free of charge on the ACS Publications website at DOI: 10.1021/acs.anal-chem.7b02229.
Experimental details and supporting figures and tables (PDF).
ORCID
Christopher J. Easley: 0000-0002-2403-4147
Notes
The authors declare no competing financial interest.
References
- 1.Rissin DM, Kan CW, Campbell TG, Howes SC, Fournier DR, Song L, Piech T, Patel PP, Chang L, Rivnak AJ, Ferrell EP, Randall JD, Provuncher GK, Walt DR, Duffy D. Nat Biotechnol. 2010;28:595–599. doi: 10.1038/nbt.1641. [DOI] [PMC free article] [PubMed] [Google Scholar]
- 2.Ullman EF, Kirakossian H, Switchenko AC, Ishkanian J, Ericson M, Wartchow CA, Pirio M, Pease J, Irvin BR, Singh S, Singh R, Patel R, Dafforn A, Davalian D, Skold C, Kurn N, Wagner DB. Clinical Chemistry. 1996;42:1518–1526. [PubMed] [Google Scholar]
- 3.Bhimji A, Zaragoza AA, Live LS, Kelley S. Anal Chem. 2013;85:6813–6819. doi: 10.1021/ac4009429. [DOI] [PubMed] [Google Scholar]
- 4.Hu J, Wang T, Kim J, Shannon C, Easley CJ. J Am Chem Soc. 2012;134:7066–7072. doi: 10.1021/ja3000485. [DOI] [PMC free article] [PubMed] [Google Scholar]
- 5.Hu J, Yu Y, Brooks JC, Godwin LA, Somasundaram S, Torabinejad F, Kim J, Shannon C, Easley C. J Am Chem Soc. 2014;136:8467–8474. doi: 10.1021/ja503679q. [DOI] [PMC free article] [PubMed] [Google Scholar]
- 6.Xiao Y, Lubin AA, Heeger AJ, Plaxco K. Angew Chem. 2005;117:5592–5595. doi: 10.1002/anie.200500989. [DOI] [PubMed] [Google Scholar]
- 7.Fredriksson S, Gullberg M, Jarvius J, Olsson C, Pietras K, Gustafsdottir SM, Ostman A, Landegren U. Nat Biotechnol. 2002;20:473–477. doi: 10.1038/nbt0502-473. [DOI] [PubMed] [Google Scholar]
- 8.Heyduk E, Dummit B, Chang Y-H, Heyduk T. Anal Chem. 2008;80:5152–5159. doi: 10.1021/ac8004154. [DOI] [PMC free article] [PubMed] [Google Scholar]
- 9.Heyduk E, Moxley MM, Salvatori A, Corbett JA, Heyduk T. Diabetes. 2010;59:2360–2365. doi: 10.2337/db10-0088. [DOI] [PMC free article] [PubMed] [Google Scholar]
- 10.Kim J, Hu J, Bezerra AB, Holtan MD, Brooks JC, Easley C. Anal Chem. 2015;87:9576–9579. doi: 10.1021/acs.analchem.5b03432. [DOI] [PMC free article] [PubMed] [Google Scholar]
- 11.Lundberg M, Eriksson A, Tran B, Assarsson E, Fredriksson S. Nucleic Acids Res. 2011;39:e102–e102. doi: 10.1093/nar/gkr424. [DOI] [PMC free article] [PubMed] [Google Scholar]
- 12.Zhang H, Li F, Dever B, Wang C, Li X-F, Le X. Angew Chem, Int Ed. 2013;52:10698–10705. doi: 10.1002/anie.201210022. [DOI] [PubMed] [Google Scholar]
- 13.Hu J, Kim J, Easley CJ. Anal Methods. 2015;7:7358–7362. doi: 10.1039/c5ay00837a. [DOI] [PMC free article] [PubMed] [Google Scholar]
- 14.Heyduk T, Heyduk E. Nat Biotechnol. 2002;20:171–176. doi: 10.1038/nbt0202-171. [DOI] [PubMed] [Google Scholar]
- 15.Heyduk E, Fei Y, Heyduk T. Comb Chem High Throughput Screening. 2003;6:347–354. doi: 10.2174/138620703106298437. [DOI] [PubMed] [Google Scholar]
- 16.Stefan Y, Meda P, Neufeld M, Orci L. J Clin Invest. 1987;80:175–183. doi: 10.1172/JCI113045. [DOI] [PMC free article] [PubMed] [Google Scholar]
- 17.Godwin LA, Pilkerton ME, Deal KS, Wanders D, Judd RL, Easley C. Anal Chem. 2011;83:7166–7172. doi: 10.1021/ac201598b. [DOI] [PMC free article] [PubMed] [Google Scholar]
- 18.Muoio DM, Newgard C. Nat Rev Mol Cell Biol. 2008;9:193–205. doi: 10.1038/nrm2327. [DOI] [PubMed] [Google Scholar]
- 19.Seino S, Shibasaki T, Minami K. Proc Jpn Acad Ser B. 2010;86:563–577. doi: 10.2183/pjab.86.563. [DOI] [PMC free article] [PubMed] [Google Scholar]
- 20.Alegría Ezquerra E, Castellano Vázquez JM, Alegría Barrero A. Rev Esp Cardiol. 2008;61:752–764. [PubMed] [Google Scholar]
- 21.Dupre J, Ross SA, Watson D, Brown J. J Clin Endocrinol Metab. 1973;37:826–828. doi: 10.1210/jcem-37-5-826. [DOI] [PubMed] [Google Scholar]
- 22.Siegel EG, Creutzfeldt W. Diabetologia. 1985;28:857–861. doi: 10.1007/BF00291078. [DOI] [PubMed] [Google Scholar]
- 23.Drucker DJ. Cell Metab. 2006;3:153–165. doi: 10.1016/j.cmet.2006.01.004. [DOI] [PubMed] [Google Scholar]
- 24.Mohammad S, Ramos LS, Buck J, Levin LR, Rubino F, McGraw T. J Biol Chem. 2011;286:43062–43070. doi: 10.1074/jbc.M111.289009. [DOI] [PMC free article] [PubMed] [Google Scholar]
- 25.Yabe D, Seino Y. Prog Biophys Mol Biol. 2011;107:248–256. doi: 10.1016/j.pbiomolbio.2011.07.010. [DOI] [PubMed] [Google Scholar]
- 26.Seino S, Shibasaki T, Minami K. J Clin Invest. 2011;121:2118–2125. doi: 10.1172/JCI45680. [DOI] [PMC free article] [PubMed] [Google Scholar]
- 27.Kim J, Hu J, Sollie RS, Easley C. Anal Chem. 2010;82:6976–6982. doi: 10.1021/ac101762m. [DOI] [PubMed] [Google Scholar]
- 28.Lawson CL, Swigon D, Murakami KS, Darst SA, Berman HM, Ebright R. Curr Opin Struct Biol. 2004;14:10–20. doi: 10.1016/j.sbi.2004.01.012. [DOI] [PMC free article] [PubMed] [Google Scholar]
- 29.Ding W-G, Gromada J. Diabetes. 1997;46:615–621. doi: 10.2337/diab.46.4.615. [DOI] [PubMed] [Google Scholar]
- 30.Prentki M, Matschinsky FM. Physiol Rev. 1987;67:1185–1248. doi: 10.1152/physrev.1987.67.4.1185. [DOI] [PubMed] [Google Scholar]
- 31.Gheni G, Ogura M, Iwasaki M, Yokoi N, Minami K, Nakayama Y, Harada K, Hastoy B, Wu X, Takahashi H, Kimura K, Matsubara T, Hoshikawa R, Hatano N, Sugawara K, Shibasaki T, Inagaki N, Bamba T, Mizoguchi A, Fukusaki E, Rorsman P, Seino S. Cell Rep. 2014;9:661–673. doi: 10.1016/j.celrep.2014.09.030. [DOI] [PMC free article] [PubMed] [Google Scholar]
- 32.Alasbahi RH, Melzig MF. Pharmazie. 2012;67:5–13. [PubMed] [Google Scholar]
- 33.Bjorklund A, Grill V. J Endocrinol. 2000;166:537–544. doi: 10.1677/joe.0.1660537. [DOI] [PubMed] [Google Scholar]
Associated Data
This section collects any data citations, data availability statements, or supplementary materials included in this article.