Abstract
Objective
Blood flow waveforms - essential data for hemodynamic modeling - are often in practice unavailable to researchers. The objectives of this work were to assess the variability among the waveforms for a clinically relevant older population, and develop data-based methods for addressing the missing waveform data for hemodynamic studies.
Approach
We analyzed 272 flow waveforms from the internal carotid arteries of older patients (73±13 years) with moderate cardiovascular disease, and used these data to develop methods to guide new approaches for hemodynamic studies.
Main Results
Profound variations in waveform parameters were found within the aged population that were not seen in published data for young subjects. Common features in the aged population relative to the young included a larger systole- to - diastole flow rate ratio, increased flow during late systole, and absence of a dicrotic notch. Eight waveforms were identified that collectively represent the range of waveforms in the older population. A relationship between waveform shape and flow rate was obtained that, in conjunction with equations relating flow rate to diameter, can be used to provide individualized waveforms for patient specific geometries. The dependence of flow rate on diameter was statistically different between male and female patients.
Significance
It was shown that a single archetypal waveform cannot well-represent the diverse waveforms found within an aged population, although this approach is frequently used in studies of flow in the cerebral vasculature. Motivated by these results, we provided a set of eight waveforms that can be used to assess the hemodynamic uncertainty associated with the lack of patient specific waveform data. We also provided a methodology for generating individualized waveforms when patient gender, age, and cardiovascular disease state are known. These data driven approaches can be used to devise more relevant in-vitro or in-silico intra-cranial hemodynamic studies for older patients.
Keywords: individualized waveforms, hemodynamic Studies, Internal Carotid Artery, Aged Population
1 Introduction
Various hemodynamic aspects of blood flow such as wall shear stress (WSS) and oscillatory shear index (OSI) have been implicated as important driving factors for the development of intracranial vascular diseases [1–4,11] and are therefore an active topic of study, both experimentally and computationally [12,13,22,31]. Computational fluid dynamic (CFD) studies of hemodynamic phenomena, for example, are capable of providing non-invasive estimates of pressure and velocity information as well as flow-related parameters (e.g. WSS, OSI) at each of (potentially) millions of mesh nodes (analogous to non-obstructive sensors) within patient specific vascular domains. This capability is extremely important in the cerebral circulation where it is not yet possible to safely and accurately measure blood velocity and pressure in vivo using technologies such as MRA [14] with sufficient resolution to obtain hemodynamic parameters such as WSS and OSI.
Any computational model or experimental simulation of blood flow requires specification of the shape of the vascular anatomy as well as the prescription of boundary conditions in terms of inlet/outlet flow/pressure data. When geometric data of the vessel lumen is obtained, the corresponding blood waveform data in the vessel is seldom measured in practice, and as a result, the inflow and outflow data for studies of intracranial blood flow are nearly always estimated from measurements obtained from population studies or representative subjects [16–23,33]. In doing so, it is inherently assumed that differences between such a one-fits-all representative waveform and patient specific waveforms (unknown) are small enough to be neglected. However, because of the large inter- individual variability of flow regimes relevant to different cardiovascular diseases and variability with age as well as disease, this hypothesis should be confirmed for specific applications. There is therefore a critical need to carefully assess the variability among flow waveforms from a relevant patient population.
In estimating the impact of inter-individual flow rate variability, it is critical to understand the range of flow waveforms within the population of interest. For example, while the waveform shape may be relatively similar across healthy, young adults [5],[6], a much larger variation would be expected in elder based populations, due to, for example, the decrease in arterial compliance with age [7,15,24]. A study by Hoi et al. (2010), [8] found substantial differences in the common carotid artery bifurcation waveforms among young and old patients. Furthermore, with increasing age, proximal cardiovascular diseases are more common and have been found to substantially alter the cerebral vascular waveform [26]. These age associated variations in flow waveforms will be particularly important for hemodynamic studies of vascular pathologies, such as cerebral aneurysms [9,25,27] that are more common in older populations.
In this work, we identified and quantified the variability in both waveform shape and flow rate found in the left and right internal carotid arteries of an aged population with mild to moderate cardiovascular disease. Based on this analysis, we then produced results that can be utilized in one of two ways to incorporate the impact of waveform variability on hemodynamics in future ex-vivo based hemodynamic studies in the ICA. We first provide eight waveforms from our ensemble which were found to be capable of capturing the range of waveform parameters found to strongly influence flow rate; such waveforms are well suited for use in parametric uncertainty studies. We then provide data which can be used to create an individualized waveform for a patient incorporating age, gender, and known disease factors.
2 Methods
2.1 Waveform generation
2.1.1 Doppler data acquisition
Patients who underwent duplex, bilateral Doppler ultrasound of the carotid arteries at the Mayo Clinic from 1/1/2012 to 12/31/2012 were enrolled in the study. Of the 867 enrolled patients, those with greater than mild stenosis of the carotid artery, stent or patch placement, or lack of information regarding risk factors of interest were excluded from the study, leaving 352 patients for analysis.
Clinical data was collected for each patient including gender, age, hypertension status, and existence of the following cardiovascular diseases: aortic stenosis, aortic regurgitation, congestive heart failure, coronary artery disease, atrial fibrillation, diastolic dysfunction, systolic dysfunction, and paroxysmal atrial fibrillation (AFIB). Lifestyle and health information including cigarette smoking and BMI (averaged over three years prior to Doppler acquisition) were also obtained. Positive classification of hypertension was defined by a systolic blood pressure greater than 140 mmHg, or a diastolic blood pressure greater than 90 mmHg. Doppler ultrasounds were performed by dedicated sonographers. The Doppler ultrasound data in conjunction with the ICA diameters, determined to a precision of 1 mm, were obtained at a location approximately 3 cm distal to the origin of the ICA. Greyscale ultrasound images of the internal carotid arteries with velocity waveforms spanning three to eight cardiac cycles were saved by the sonographer for analysis.
2.1.2 Extraction of velocity waveform from Doppler data
The peak velocity over the cross section as a function of time, Vp(t), was obtained from the waveform ultrasound images using custom scripts written in the MATLAB Release 2012a environment (The MathWorks, Inc., Natick, Massachusetts, United States.). The scripts were designed to automate the process of the detection of the waveform envelope so as to minimize user interaction and lessen human bias. The characteristic metrics for each period were visually checked in an automatically generated figure, e.g. Figure 1. Some of the images were either of too poor resolution to be analyzed or not possible to be analyzed using the automated software and were thus excluded from the study. The metrics of the individual periods comprising the ensemble waveforms (consisting of three to eight periods per waveform) were simply averaged to produce period-averaged waveform metrics. Period-averaged waveforms which were produced for latter use in the study were produced by aligning the normalized waveforms by their maximum velocity to avoid artificial rounding or flattening of the systolic peaks which was otherwise unavoidable in many cases.
Fig. 1.
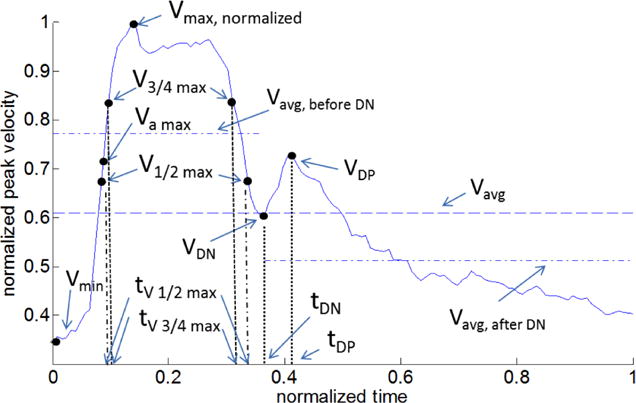
Representative waveform for the normalized velocity V(t) = Vp(t)/Vmax showing waveform metrics (see Table 1 for definitions).
2.2 Definition of characteristic waveform metrics
The waveform shape was characterized by eight metrics that were used for the young, healthy population in [6] as well as additional metrics (V3/4 max, VDP, VAvg BDN, VAvg ADN, tV 3/4max, tVDP). Pulsatility index (PI) was additionally provided. The additional metrics were chosen primarily to distinguish features in our aged population that were not present in the young, healthy population in [6]. The definitions of each metric are listed in Table 1 and depicted in Figure 1. All velocity variables were normalized by the maximum velocity Vmax, and all temporal variables by the cardiac period, Tper. The values of each characteristic metric -such as the maximum, and minimum velocities and the times at which they occurred - were automatically identified and recorded using the custom MATLAB script described above. The mean and standard deviation of each metric for each patient were then computed, as well as the population averaged means and standard deviations for the left and right ICAs. The dicrotic notch was defined as the local minimum of the waveform velocity directly following the completion of systole. More quantitatively, this is the point after the second systolic V1/2 max where the second derivative in time of the velocity is maximum. The quantities VAvg BDN and VAvg ADN were then defined as the time averaged velocities for the regions before and after the dicrotic notch, respectively.
Table 1.
Definitions of waveform characteristic metrics
| Dimensional
| |
| Vp(t) | Measured Doppler velocity (peak in space) |
| Vmax | Maximum velocity over period |
| Tper | Duration of cardiac cycle |
|
Non-Dimensional Velocity | |
| V(t) | Normalized velocity = Vp(t)/Vmax |
| Vmin | Minimum velocity over period |
| Vavg | Time-averaged velocity |
| V1/2 max | 1/2(Vmax−Vmin) +Vmin |
| V3/4 max | 3/4(Vmax−Vmin) +Vmin |
| VAmax | Velocity at instant of maximum acceleration |
| VDN | Minimum velocity of dicrotic notch |
| VDP | Maximum velocity after dicrotic notch |
| VAvg BDN | Time-average velocity before dicrotic notch |
| VAvg ADN | Time-average velocity after dicrotic notch |
| Vrec | VAvg ADN - VAvg BDN |
| Accmax | Maximum acceleration |
| PI | V*/Vavg |
|
Non-Dimensional Time | |
| tV max | Time when Vp(t)= Vmax |
| tV 1/2max | Time when Vp(t)= V1/2 max |
| tV 3/4max | Time when Vp(t)= V3/4 max |
| tV DN | Time when Vp(t)= VDN |
| tV DP | Time when Vp(t)= VDP |
2.3 Special treatment of the dicrotic notch
Special care is needed when processing the velocities of the dicrotic notch. It was found that some waveforms did not contain a discernible dicrotic notch (to within the resolution of 1 cm/s). These waveforms were excluded from metrics directly measuring the dicrotic notch velocities (VDN, VDP, and Vrec). In patients where only one of the carotid vessels had an identifiable dicrotic notch, Vrec was set to zero for the side with no dicrotic notch.
2.4 Contralateral variability
The contralateral variability of a given waveform metric between the left and right ICAs in each patient was quantified as the contralateral difference (mdiff ≥ 0) defined as
| (1) |
where Abs stands for the absolute value of the quantity, ml and mr are the left and right side values of the metric, respectively. This metric was used to compare the magnitude of the difference in waveform metric between left and right vessels relative to their mean value.
2.5 Relationship between velocity waveforms and flow rate waveforms
Flow rate Q(t) and time averaged flow rate were defined as
| (2) |
where, in Eq. 2(a), the velocity profile has been approximated as parabolic in space, and d is the arterial diameter, which was assumed to be constant in time. As the information to directly obtain Vp(t) was contained within the ensemble data, we first made use of 2(a) to transform our data from a velocity quantity to a flow rate quantity. We could then make use of Eq. 2(b) to obtain a flow quantity that is averaged in time, .
2.6 Representative waveforms for parametric studies
To explore the impact of waveform shape on flow in downstream vessels, it is helpful to identify representative waveforms from a feasible, manageable number of parameters that can be used in parametric studies. These representative parameters should be chosen in a way that they are able to capture the most basic features of the waveform. As motivated below, after providing a qualitative evaluation of the range of waveforms in the older population, we concentrate on three primary waveform parameters, rather than the more extensive list given in Table 1. These are (V*,T*, Vmax), Figure 2. V* is defined as the difference between the maximum and minimum normalized velocities, or
| (3) |
V* is therefore, the same as the commonly referenced resistance index ([5],[8],[10], [28]). T* is the nondimensional time interval between the first and second occurences of V1/2 max, Fig. 1.
Fig. 2.

Representative normalized velocity waveform with nondimensional metrics V*, T*. Shown are (a) Velocity waveform with metrics, (b) Corresponding square waveform with equivalent values of V*, T* used to estimate .
These metrics are defined as high or low if they are, respectively, above or below the mean value for the population. On this basis, each waveform was placed into one of eight sub-populations consisting of combinations of low and high values of (V*, T*, Vmax) for which averages of , V*, T*, and Vmax were computed. Further sub-categorization based on diameter was also considered to explore the influence of diameter on waveform parameters V*, T*, and Vmax and is presented in supplementary material.
2.6.1 Choice of (V*, T*, Vmax) as primary variables for parametric studies
With the expectation that the dependence of average flow rate on waveform shape is dominated by the parameters (V*, T*, Vmax), we introduced an idealized square waveform with equivalent values (V*, T*, Vmax), Figure 2(b). The time averaged flow rate for such an idealized square wave is
| (4) |
where we have again approximated the flow as parabolic at each instant in time. The closeness of this approximation to the measured flow rate was evaluated by determining a correction factor (i.e., a slope , and the correlation coefficient of the resulting linear equation.
2.6.2 Selection of representative waveforms for parametric study
Representative waveforms for each of the eight sub-populations were then determined by selecting the waveform within each sub-population with values of (V*, T*, Vmax) collectively closest to the sub-population averages of (V*, T*, Vmax). In particular, the waveform was chosen with the minimum value of the sum of the magnitude of these differences, each normalized by the sub-population average for that variable.
2.7 Generation of individualized waveforms
In many cases, although the patient waveform is not known, the vessel geometry and some patient data is known, for example age, gender, heart rate and existence of various types of cardiovascular diseases. As described below, this patient specific information can be used to select individualized values of , V*, T*, and Vmax. As for the parametric studies, these values can then be used to obtain a individualized waveform by morphing a standardized waveform such as the population averaged waveform to match these values.
2.7.1 Obtaining individualized values of , V*,T*,Vmax
In this method of generating individualized waveforms, individualized diameter- was first determined by curve-fitting a relationship for the ensemble. Then, to determine how age, disease, and the cardiovascular risk factors described in Section 2.1.1 affected waveforms, the ensemble was divided into patients with and without each disease or risk factor. If a statistically significant difference (p ≤ 0.05) in the mean values of (V*,T*,Vmax) was found between the groups with and without a disease characteristic, then a disease-specific mean was identified. A multiplicative scaling (defined as the mean of the disease group divided by the mean of the group free of that particular disease), was then created for the purpose of adjusting the waveform parameters to better approximate the waveform for patients harboring the disease. In the case of being significantly influenced by a disease, a unique diameter flow rate curve was fit for the population harboring the disease.
3 Results
3.1 Range of patient characteristics across the aged adult database
The analyzed population consisted of 53 males and 83 females between the ages of 51 and 94 with a mean age of 73 ± 13 years; 68% of whom were hypertensive. The prevalence of various cardiovascular diseases are tabulated in Table 2.
Table 2.
Prevalence of cardiovascular risks/disease within ensemble (as % of population (Note UW = underweight, NW = normal-weight, OW = overweight, O = obese).
| Risk factors
| |
| BMI | 3%:UW, 30%:NW, 38%:OW, 29%:O |
| Tobacco use (smoking) | 54%:never, 5%:smokes, 41%:quit |
| Hypertension | 68% |
|
Cardiovascular Disease | |
| Aortic Stenosis | 13% |
| Aortic Regurgitation | 1% |
| Mitral Valve Regurgitation | 10% |
| Congestive Heart Failure | 6% |
| Coronary Artery Disease | 28% |
| Atrial Fibrillation | 11% |
| Diastolic Dysfunction | 4% |
| Systolic Dysfunction | 3% |
| Paroxysmal Atrial Fibrillation | 2% |
3.2 Range in waveforms across the aged adult database
3.2.1 Aged versus young adult populations
The range in waveform shape across the ensemble of 272 vessels from older adults can be seen in Figure 3(a) where a subset of 32 waveforms are chosen to reflect the range of variability of V* and T* without crowding the figure. The aged population (a) shows relatively large variability across waveforms compared with the young, healthy adult population, (b). This is most evident in the region of peak velocity, Vmax (P1 in Fig. 3(b)). The flow rate beyond this point decays more slowly in the aged population. Furthermore, the dicrotic notch, which is visible in the averaged curve for the young, healthy population, is absent in the average curve for the aged population. This point will be discussed in more detail in Sec. 3.2.3.
Fig. 3.
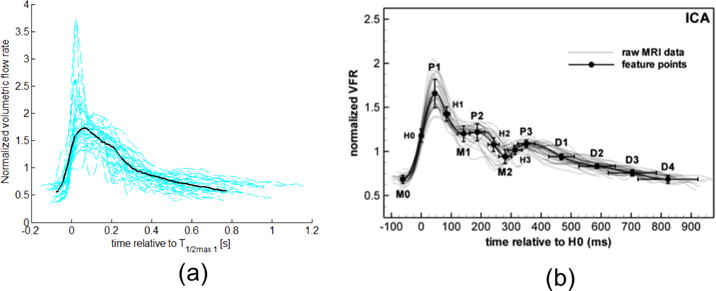
Normalized velocity waveforms (dashed lines) and mean waveform (solid line) for (a) representative subset of older population from this study, and (b) healthy, young adults, reproduced from [5] with permission of IOP Publishing. All rights reserved. Only a subset of the 272 waveforms from aged adults and the corresponding average are shown in (a) to avoid crowding the figure. The volumetric flow rate was calculated by assuming Poiseuille flow, and therefore, the normalization in (a) and (b) are equivalent, though it should be noted these axis are scaled differently. Collective patient waveforms in both (a) and (b) are aligned by the point of mid-acceleration V1/2 max, denoted as H0 in (b).
3.2.2 Waveform metrics for aged population
The average, standard deviation, and extrema of the normalized characteristic metrics for each of the 272 analyzed waveforms are given in Table 3. All kinematic variables were normalized by the vessel specific Vmax and all times were normalized by their respective period, Tper. A Wilcoxon rank sum test revealed no significant differences in any of the metrics considered here between the contralateral vessels (lowest p-value was 0.13 for VDP).
Table 3.
Average characteristic parameter values for data ensemble
| Variable | Average ± SD | Min,Max | |
|---|---|---|---|
|
| |||
| Primary Waveform Parameters
| |||
|
|
3.94±1.61 | [0.91, 12.3] | |
| Vmax[cm/s] | 70.7±18.5 | [18, 134] | |
| T* [] | 0.28 ±0.06 | [0.07, 0.42] | |
| V* [] | 0.71 ±0.07 | [0.50, 0.92] | |
|
Dimensional | |||
| Vavg[cm/s] | 38.2 ± 10.5 | [7.64, 73.9] | |
| Accmax [cm/s2] | 5260± 2460 | [1880, 16700] | |
| Tper[s] | 0.92± 0.15 | [0.55, 1.35] | |
|
Non-Dimensional Velocity, Acceleration | |||
| Vmin | 0.29± 0.07 | [0.08, 0.50] | |
| Vavg | 0.55± 0.07 | [0.25, 0.71] | |
| V1/2 max | 0.65 ± 0.03 | [0.55, 0.75] | |
| V3/4 max | 0.82± 0.20 | [0.77, 0.87] | |
| VAmax | 0.57± 0.11 | [0.27, 0.87] | |
| VDN | 0.45 ± 0.18 | [0.18, 0.75] | |
| VDP | 0.52± 0.19 | [0.33, 0.79] | |
| Vrec | 0.06± 0.05 | [0.03, 0.34] | |
| VAvg BDN | 0.73 ± 0.07 | [0.40, 0.84] | |
| VAvg ADN | 0.41 ± 0.08 | [0.18, 0.62] | |
| Accmax | 73.7± 23.2 | [30.3, 171] | |
| PI | 1.34±0.37 | [0.73, 3.67] | |
|
Non-Dimensional Time | |||
| tV max | 0.19± 0.06 | [0.09, 0.50] | |
| tV 1/2max 1 | 0.08± 0.02 | [0.02, 0.17] | |
| tV 1/2max 2 | 0.37± 0.06 | [0.15, 0.55] | |
| tV 3/4 max 1 | 0.11± 0.03 | [0.04, 0.21] | |
| tV 3/4 max 2 | 0.31± 0.07 | [0.10, 0.47] | |
| tVDN | 0.38± 0.13 | [0.28, 0.54] | |
| tVDP | 0.43 ± 0.15 | [0.33, 0.70] | |
The range and frequency of the key waveform quantities (V*, T*, Vmax) over the entire population are shown in Figure 4. In the following sections, this dataset will be used to guide the selection of the parametric and estimated individualized waveforms for this aged population.
Fig. 4.
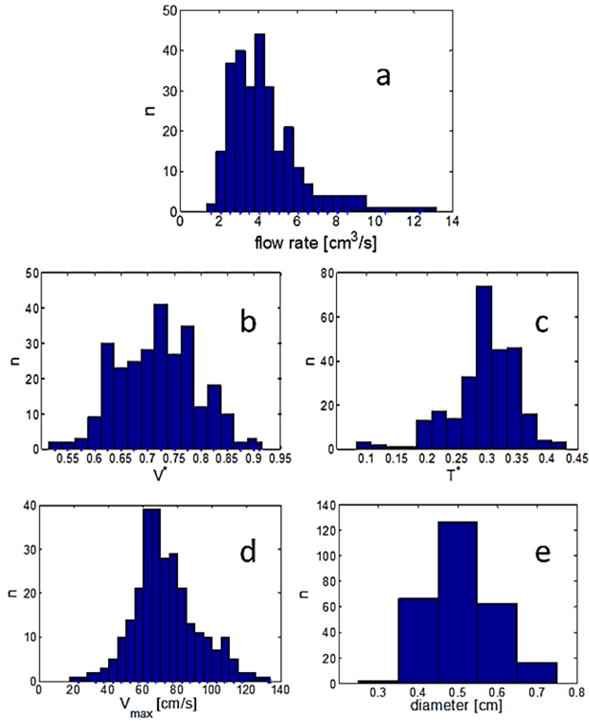
Distribution of (a) flow rate (b–d) primary waveform parameters, and (e) vessel diameter across the aged population. Here, n is the number of occurences within the 272 waveforms.
3.2.3 Lack of dicrotic notch
Twenty-three of the ICA waveforms from the 136 patients did not contain a discernible dicrotic notch, Figure 5. Sixteen of these patients had no discernible dicrotic notch on either side, while seven had a discernible dicrotic notch on only one side. Of these seven, three dicrotic notches were missing from the left and four dicrotic notches were missing from the right. A significant difference using a Mann-Whitney test (p = 0.007) was found between the average age of the subgroup missing at least one dicrotic notch (80 ± 9.8 years) versus the mean age of the ensemble (73 ± 13 years).
Fig. 5.

Doppler velocity waveforms selected to illustrate the extremes in the aged population showing (a) marked dicrotic notch and (b) undiscernible dicrotic notch.
3.3 Coupling of waveform contour to flow rate
The ability of the square waveform (introduced in Section 2.6, Equation 4) to approximate the actual waveform flow rate, , through the waveform metrics (V*, T*, Vmax) was evaluated for the ensemble waveforms. The relationship between the time averaged flow rates obtained from the Doppler images and their corresponding square waveform flow rates was found to be remarkably close to linear with a scaling factor of 1.11, Figure 6,
| (5) |
Eq. 4 and Eq. 5 were then combined to couple waveform shape with flow rate, yielding
| (6) |
Fig. 6.
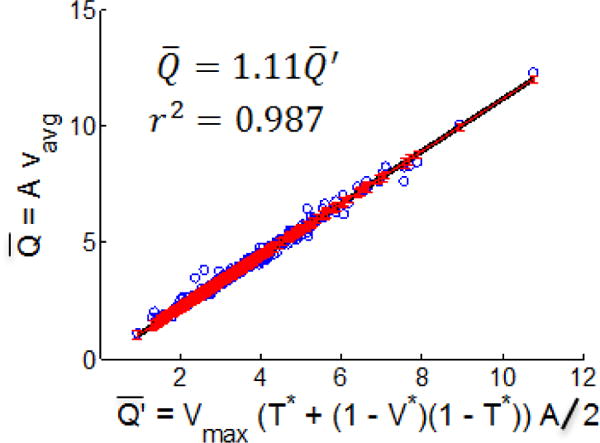
Time averaged flow rate obtained from Doppler velocity waveforms versus the estimated flow rate .
3.4 Selection of representative waveforms for parametric studies
3.4.1 Prototypical waveforms
As described in Section 2.6, the ensemble of all waveforms was organized into eight groups, defined through combinations of high and low values of the parameters (V*, T*, Vmax), Table 4. High or low values and combinations of Vmax, T*, and V* were found to influence qualitatively as predicted by Equation 6. The most representative waveform for each category is shown in Figure 7. Namely, for each of these categories, a waveform is provided that has the closest fit of V*, T*, and Vmax to the respective averages for that category. Hence, these waveforms collectively function as a parameter-motivated representation of the ensemble. To demonstrate the rather weak dependence of Vmax on diameter for these groups, Table 4 was further sub-categorized by diameter. This data is presented in Table 1 of the supplementary material. The lower right panel of Figure 7 contains the ensemble data for as a function of d, which can be used to inspect the likelihood of any of the eight waveforms of Figure 7 occurring for any given vessel diameter.
Table 4.
Eight waveform groups characterized by high/low values of (Vmax, T*, V*). In column 2, H = “high”, L = “low”. is determined from Eq. 2 and well estimated by Eq. 6. Group numbers are ordered from maximum to minimum . Data needed to reconstruct these curves is provided in supplemental material.
| Vmax, T*, V* | N | Vmax | T* | V* |
|
Age[yr] | ||
|---|---|---|---|---|---|---|---|---|
| 1 | H, H, L | 25 | 85.4±7.8 | 0.33±0.03 | 0.67±0.05 | 4.95±1.89 | 71.6±7.8 | |
| 2 | H, H, H | 44 | 87.7±15.8 | 0.31±0.04 | 0.76±0.04 | 4.74±2.36 | 78.2±8.6 | |
| 3 | H, L, L | 23 | 83.5±12.7 | 0.26±0.03 | 0.65±0.04 | 4.60±1.73 | 65.1±17.6 | |
| 4 | H, L, H | 28 | 88.7±14.6 | 0.20±0.06 | 0.80±0.06 | 3.87±1.58 | 72.5±15.9 | |
|
| ||||||||
| 5 | L, H, L | 48 | 58.8±8.6 | 0.33±0.03 | 0.63±0.04 | 3.79±1.42 | 69.9±9.2 | |
| 6 | L, L, L | 43 | 58.6±8.3 | 0.24±0.03 | 0.64±0.04 | 3.49±1.04 | 67.4±13.3 | |
| 7 | L, H, H | 31 | 56.8±8.4 | 0.31±0.02 | 0.76±0.03 | 3.44±1.22 | 83.2±9.2 | |
| 8 | L, L, H | 30 | 56.8±12.6 | 0.24±0.03 | 0.76±0.05 | 2.88±1.07 | 74.1±17.0 | |
Fig. 7.
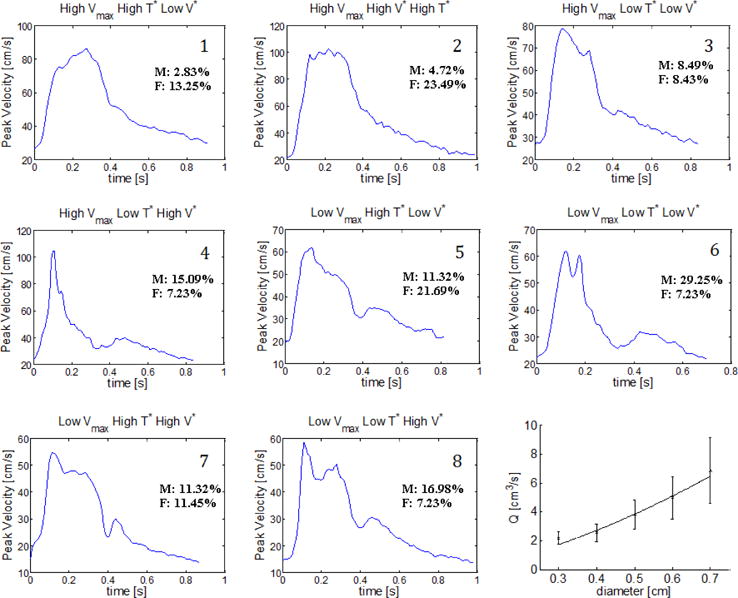
Representative patient-specific waveform for each of the eight groups identified in Table 4. Percentage of the overall male/female population represented in each group are shown with each waveform. The flow rate as a function of diameter for the ensemble is shown in the lower right panel of the figure.
3.5 Generation of individualized waveforms
In this section, we provide a methodology to generate an individualized flow rate and individualized waveform shape using patient information such as the diameter, age, gender, cardiovascular disease and risk factors. In the absence of patient specific waveforms and flow rates, most hemodynamic studies of the cerebral vasculature use a polynomial function of diameter to estimate the average flow rate and an idealized waveform shape from healthy, young subjects In this section, we introduce a method to use patient information combined with the database for older patients to better estimate both average flow rate and waveform shape for this older population. In particular, patient information and vessel diameter in conjunction with Equation 6 will be used to provide an individualized value for the flow rate Q as well as the descriptive waveform metrics (Vmax, V*, T*) needed to generate an individualized patient waveform. A schematic of the methodology used to estimate these four parameters is given in Figure 8 and described in detail below.
Fig. 8.
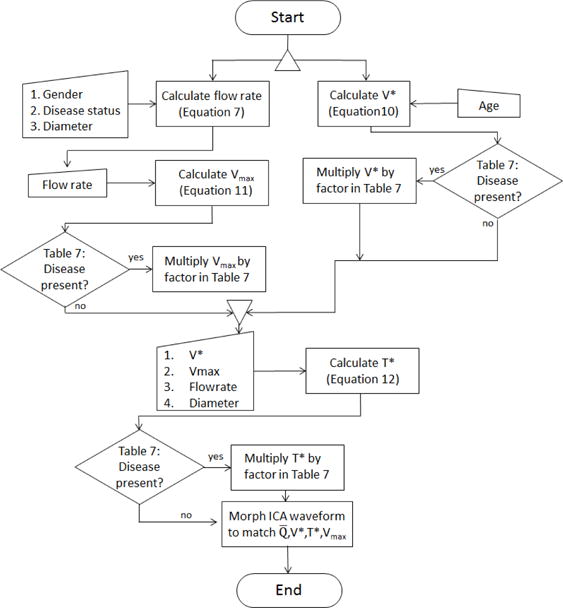
Flowchart depicting algorithm for generating individualized waveform (individualized flow rate and individualized waveform shape) waveform.
3.5.1 Patient individualized flow rate estimation from diameter and disease condition
A power law relationship between and d was obtained for the entire ensemble as well as all subpopulations defined by disease state,
| (7) |
where d is in units of cm and is in units of cm3/s. The units of the multiplicative constant are not shown. The ensemble data was well fit with an exponent of 1.55 (r2 = 0.97), Figure 9(a). The difference in flow rates for patients with aortic stenosis and AFIB compared with the ensemble average approached, but did not reach, statistical significance with a 95% CI (p = 0.06 in both cases), Figure 9(a). No other diseases or factors considered in the study (see Table 2) were found to have a statistically significant impact on flow rate.
Fig. 9.
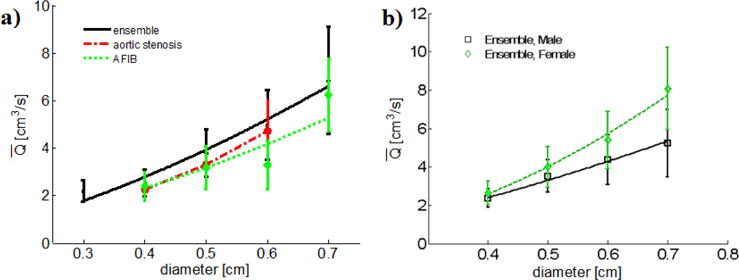
(a) Data for average flow rate as a function of diameter for the entire ensemble, the aortic stenosis sub-population, and the AFIB sub-population and, b) Difference in flow rate diameter relationship due to gender.
Vessel diameter, additionally, was found to depend on age. For patients older than 73 years, the ICA diameter averaged 0.497 ± 0.090 cm. In contrast, for patients younger than 73 years, the diameter averaged 0.517 ± 0.083 cm with 94% CI.
3.5.2 Influence of gender on the individualized flow rate
The estimation of flow rate was further patient tailored by considering the influence of gender. The ensemble was divided into two gender-based sub-populations (53 males and 83 females) whose mean ages were not significantly different (p = 0.52). Notably, the mean flow rates for each gender-based sub-population were significantly different with 3.64 ± 1.34 cm3/s for males and 4.13 ± 1.73 cm3/s for females (p = 0.018), Figure 9.
The power-law fits of flow rate to diameter were substantially different as seen in the difference in powers of 1.41 for males versus 1.95 for females,
| (8) |
The best fit power-law models for the subpopulations formed by considering the combined influence of both disease and gender are
| (9) |
The influence of gender on , V*, T*, Vmax and d is shown in Table 5. It was found that Vmax and T* are primarily responsible for the gender-based difference in flow rate (refer to Equation 5), while no significant gender based relationship was found for V* and d. The period of the cardiac cycle also differed significantly between genders (p = 0.03) with an average of 63±8.5 beats per minute (BPM) for males versus 67±9.3 BPM for females.
Table 5.
Gender-based sub-population flow rate parameters
| Males | Females | p-value | ||
|---|---|---|---|---|
|
| ||||
|
|
3.64±1.34 | 4.13±1.73 | 0.018 | |
| Vmax[cm/s] | 66.5±18.1 | 73.2±17.8 | 0.010 | |
| T* | 0.26±0.05 | 0.30±0.05 | 1e-9 | |
| V* | 0.71±0.08 | 0.70±0.07 | 0.98 | |
| d [cm] | 0.51±0.08 | 0.51 ±0.08 | 0.88 | |
3.5.3 Individualized estimates for V*
Of the waveform parameters (V*, T*, Vmax), only V* was found to vary significantly (95% CI) with age, Table 6. A scatter plot is provided for this data in Figure 10(a) with a best linear fit of
| (10) |
This relationship can be used to obtain an individualized estimation for V* (age is given in years). Also shown in Figure 10(b) are the ensemble means from Hoi 2010 [8] (mean age 68±8 years) and Ford 2005 [5] (mean age of 28 ± 7 years). These data show reasonable agreement with the trend in V* with age found in this work, further supporting the use of Eq. 10.
Table 6.
Impact of age on waveform parameters
| Parameter | Age>73 yo | Age ≤ 73 yo | p | |
|---|---|---|---|---|
|
| ||||
|
|
3.76±1.44 | 4.08±1.71 | 0.33 | |
| Vmax | 68.4±18.0 | 72.2±18.3 | 0.055 | |
| T* | 0.28±0.06 | 0.28±0.05 | 0.69 | |
| V * | 0.73±0.07 | 0.67±0.08 | 1e-12 | |
Fig. 10.
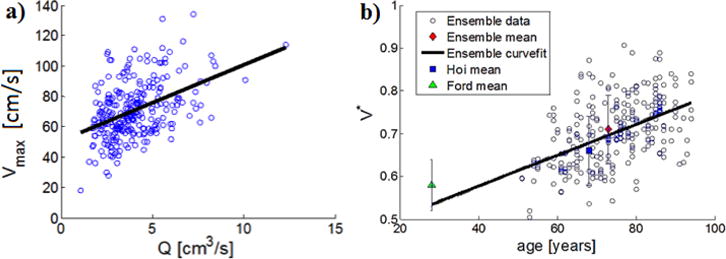
(a) Scatterplot of Vmax, (r2=0.19) as function of time averaged flow rate, showing data and linear fit and (b) Distribution of V* with age and comparison with data reported by Ford et al. [5] and Hoi et al. [8].
The influence of diseases and risk factors on the flow rate parameters V*, T*, and Vmax are tabulated in Table 7 where a disease based scaling factor is provided. In particular, the values given are multiplicative factors equal to the mean for that population relative to the mean of the average from the entire population.
Table 7.
Modifiers of waveform parameters by cardiovascular diseases which produced significant differences (p < 0.05) between patient with and without each condition
| Afib | AortSten | CAD | DiaDysf | SysDysf | Quit Smoking | Under Weight | |
|---|---|---|---|---|---|---|---|
|
| |||||||
| V* | 1.06 | 1.06 | – | 1.09 | 1.10 | – | – |
| T* | – | – | – | 0.89 | – | – | – |
| Vmax | 0.85 | – | 0.93 | – | 0.96 | 0.97 | 1.27 |
The prevalence of hypertension was found to be significantly higher in patients older than the mean age of 73, compared with those younger than the mean (79% versus 48%, respectively, p = 7e-5). V* was significantly higher in the hypertensive group (0.71±0.07 versus 0.69±0.08, p = 0.009). Since this is only a modest influence on V* and redundant with the increase in V* due to increasing age, we do not consider hypertension as a modifying factor for V*.
and
3.5.4 Individualized estimates for Vmax
Motivated by the dependence of on Vmax in Equation 6, a scatterplot of Vmax is shown for , Figure 10(a). Of V*, T*, and Vmax, only Vmax by itself showed substantial dependence on , with a linear fit used here, though recognizing the appreciable scatter in the data expected for a older, diseased population.
| (11) |
Using the individualized value of , Equation 11 can be used to obtain a patient individualized estimation for the maximum velocity, Vmax.
3.5.5 Estimation of T*
Once V*, Vmax, and d are determined, Eq. 12 can be used to estimate T*,
| (12) |
which, upon accounting for diastolic dysfunction (Table 7) finally provides all descriptive waveform parameters1. At this point, the parameters required to morph an existing waveform into a more patient-tailored waveform are known. The resulting morphed waveform will have a data driven flow rate with a corresponding data driven shape appropriate for the age, gender, and disease state of the patient.
4 Discussion
4.1 Waveforms in the aged adult population
In the current study, we demonstrated both qualitatively and quantitatively that there are profound differences in both ICA waveform shape and the degree of intra-population variability between healthy young adults and older adults with mild to moderate cardiovascular disease. The healthy young adult data were drawn from published literature and the older adult data from our study population of 136 patients with an average age of 73 ± 13 years. We used existing metrics for young adults and also introduced new metrics to quantify additional waveform features relevant to the older population. As elaborated on below, the most notable qualitative differences between the healthy young ensemble and aged population were features defining the waveform shape, including the older population’s larger systole -to - diastole flow rate ratio, increased flow during late systole, and the absence of a dicrotic notch. An aspect perhaps most critical to hemodynamic studies, the flow rate, was found to be 3.94±1.61 cm/s3 for the aged ensemble of the current study versus the left and right ICA flow rate average 4.58±0.97 cm/s3 reported in Hoi [8] for young, healthy subjects. Between these two populations, the
coefficient of variation is nearly double. This decline in with age could be supported by the findings reported in Scheel et al. [34] of an age dependent decline in flow velocity and increase in resistance index (V*). Equation 6 can be used to reference how these two aspects can cause a decrease in .
4.1.1 Augmented secondary systolic peaks
Similar to the findings in this study, Hoi et al. [8] reported a conspicuous second systolic peak in older adults that existed in young adults, but was much lower in magnitude (e.g. Fig. 3 in [8])). This increased magnitude of the secondary peak is believed to be caused, at least in part, by the early return of wave reflections from the upper body circulation to the aorta, which can arise from age-related arterial stiffening [15],[30],[32]. For the present study as well as that of Kallman et al. [29], increased age and aortic stenosis were associated with additional systolic peaks. While the augmented secondary systolic peak was a common finding in the current population, a considerable number of waveforms did not possess this characteristic during systole, displaying instead systolic waveform shapes such as a single spike of short duration Figure 11(a), a long-duration flat, plateau (see Figure 11(c)), or shapes such as seen in Figure 5. For this reason, we chose to make use of T* over the more commonly used flow augmentation index (FAI) [15]. Though not equivalent, T* is qualitatively similar to FAI in that it captures late systolic flow augmentation.
Fig. 11.

Variations in waveforms at late systole having: a) no augmented secondary systolic peak, b) augmented secondary systolic peak as described by Hoi et al., c) plateau-like systolic peak.
4.1.2 Lack of dicrotic notch
We identified waveforms without dicrotic notches in 17% of patients, in some cases missing only on one side. O’Boyle et al. [26] considered absence of a dicrotic notch in the internal, common and external carotid arteries of patients with different grades of aortic stenosis that included 23 men, 1 woman with a mean age of 72 as well as 11 male age matched controls. In this male dominated cohort of a relatively small size, they found 9% of the combined population lacked a dicrotic notch, and there was statistical difference between control and study group. In a study of 26 patients with aortic valvular disease, Kallman et al. only identified one ICA waveform without a dicrotic notch [29]. This patient had moderate aortic regurgitation and a 50–75% ICA stenosis. As for the study of O’Boyle, we did not find any correlation between lack of dicrotic notch and aortic stenosis, nor did we find a correlation with aortic regurgitation. In fact, of all the disease/risk factors considered in the present study, only increasing age was found to be a significant factor associated with the absence of the dicrotic notch. This suggests, as one possibility, other vascular age related factors at the systemic level affect the presence of the ICA dicrotic notch.
4.1.3 Contralateral differences
The magnitudes of the waveform metric contralateral differences were substantially larger in the aged population compared with those reported for a young, healthy population. For example, the average intrasubject difference in between the left and right ICAs was 1.26 cm3/s, or 32% of the ensemble average for our older population. This difference is twice that reported in the Ford study [5] for 17 young, healthy individuals. In addition to differences in between left and right ICAs, the older population studied here showed average contralateral differences in Vmax, V* (resistance index), and T* of 12 cm/s (17%), 0.04 (5.6%), and 0.03 (10.7%), respectively. We have not found reports of contralateral differences in these parameters in younger patients. The differences that we found for the older popluation did not demonstrate a preference with a particular side.
4.2 Design of hemodynamic studies
Having shown that, unlike young adults, there is no single prototypical ICA waveform for older patients, we addressed the question of how to design in vitro and in silico studies of the hemodynamics in the anterior cerebral circulation, in the absence of patient specific inflow boundary conditions for the ICAs. We developed two approaches for producing ICA flow waveforms driven by the study population data. One approach involves the usa eight identified prototypical waveforms (Section 3.4.1) which capture an appreciable range of waveform characteristics defined by Vmax V* T* found within the ensemble. Referring to Table 4 as well as the supplementary material, it is also seen that the eight waveforms capture an appreciable range of variability for . These waveforms could be used in parametric in-vitro or in-silico hemodynamic studies as inflow data to evaluate the impact of the waveform signatures in simulated hemodynamics. The value of these eight wavefroms would then be harnessed, in that for such a study, rather than imposing an arbitrary, assumed, or hypothetical set of flow conditions, one would instead impose a set of conditions which accurately simulate the range of conditions found within our data ensemble. By imposing flow conditions from each waveform onto each vascular geometry in question, one could develop a margin of uncertainty pertaining to the absence of knowledge of the actual waveform. One could also evaluate the sensitivity of each hemodynamic parameter to the choice of waveform for each vessel, and could distinguish the hemodynamic metrics which are relatively insensitive to the choice of waveform from those which are more sensitive. Alternatively, it may be of interest to run parametric studies with held fixed; this could be achieved for a given vessel geometry by appropriately scaling Vp(t) for each of the waveforms in Figure 7. The bottom right panel of Figure 7 could be used to provide an appropriate for particular vessel in question.
In the case of some studies however, it may not be desirable or practical to consider multiple waveforms for each geometry; rather, it may be desirable to construct a waveform which more likely represents the actual patient waveform as opposed to a waveform taken from, for example, a young healthy subject. The second approach we developed, presented in Section 3.5, is well suited for such a task. The average older waveform obtained for this population (shown in Figure 3) can be used to generate an older patient waveform with desired values of V*, and T* using a morphing technique. An example is shown in Figure 12 where an older adult waveform was created with prescribed values of (V*,T*) = (0.91, 0.08). To illustrate the effectiveness of this method, a patient waveform was chosen with low and high values of V* and T* relative to the population average, (V* = 0.71, T* = 0.28).
Fig. 12.
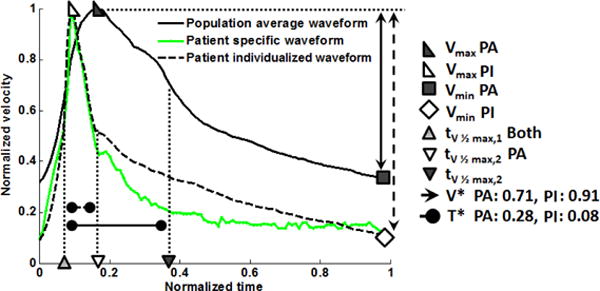
Example of morphing the population averaged velocity waveform to obtain a waveform with prescribed values of (V*,T*). Shown are the morphed normalized velocity waveform compared with the older population averaged waveform and the patient specific waveform. Only the values of (V*,T*) were prescribed to match the morphed and patient waveform. In the legend: PA = Population averaged; PM = individualized.
While there is no unique method for morphing the average waveform, a straightforward method employing linear interpolation was used here. Briefly, the waveform velocities were first normalized with respect to Vmax and Tper. In the mapped waveform, the values of V(t) over the domain (0,tV max) were linearly interpolated from the original waveform with V(tV max) specified as one (based on the normalization) and V(0) chosen so that the desired V* was achieved, Eq. 3. Similarly, the values of V(t) over the domain (tV max, 1) were obtained through a linear interpolation of the data defined such that V(1) = V(0) with the diastolic tV 1/2max shifted to achieve the prescribed T*.
If the population averaged waveform (solid black line in Figure 12) had been considered for the patient, the normalized flow rate would have been over-predicted by 129% in contrast with a discrepancy of 22% when considering the morphed waveform (green curve in Figure 12) created using the prescribed (V*,T*).
4.3 Limitations and future directions
The current study is by no means intended to be, nor should it be utilized as, a replacement for patient-specific flow data. There are still uncertainties present even in the most-representative individualized waveforms which could potentially have a substantial impact on any hemodynamic study. Furthermore, this study makes no estimates of the impact of even key waveform parameters on hemodynamics in the ICA. This will be a subject of further investigation. Another direction of intended future work involves the use of machine learning for analysis of the ensemble to obtain more accurate descriptions of the waveform shape that includes more localized shape parameters and their relationship to flow rate and disease state. This approach has been forgone at the moment since the impact of even the large scale flow features (e.g., V*, T*) on hemodynamics have not been well explored. Furthermore, the patient population for this study consists of older adults with mild to moderate cardiovascular disease and could be extended in the future to include severely diseased groups. Here, we have focused on waveforms from the ICA obtained from routine screening of cardiovascular patients. In a future study, it would be valuable to apply this approach to the posterior cerebral circulation, for example the basilar artery. Finally, the standard limitations of Doppler ultrasound apply here, including the precision of typical clinical Doppler systems and the approach for estimating velocity profiles from a measurement at a single location.
5 Conclusions
In this work, we have introduced data and methods to address the often unavoidable challenge of addressing the lack of patient specific waveform data when performing in-vitro or in-silico hemodynamic studies. We have provided an extensive analysis of the waveform shapes and flow rates in the ICAs of 136 older adults with mild cardiovascular disease - a population of clinical relevance where hemodynamics are believed to play an important role in the onset and progression of diseases (e.g. cerebral aneurysms, atherosclerosis). This study has demonstrated that there is a substantial degree of variation in flow rate and waveform shape in this aged adult cohort that cannot be represented by a single archetypal waveform. With this in mind, we have provided two approaches to design patient specific hemodynamics studies in the absence of such data. With the results obtained here, we are poised to move forward to study the impact of range of waveform shape and flow rates on vascular diseases in the aged cerebral circulation.
Supplementary Material
Acknowledgments
This research was supported, in part, by a grant from the National Institutes of Neurological Disorders and Stroke (NINDS) of the NIH (1R01NS097457-01): Improving cerebral aneurysm risk assessment through understanding wall vulnerability and failure modes (MJD, JRC, AMR), as well as Swanson School of Engineering Summer Internship (IHW).
Footnotes
As a side point, we note that larger T* is associated with a faster pulse rate. In particular, the sub-population with a faster than average pulse (66PBM), has a significantly higher T* than the average, though it is a very minor difference (0.29 versus 0.28).
Conflict of interest
The authors do not have any potential conflicts of interest to declare.
8 Bibliography References
- 1.Chatziprodromou I, Poulikakos D, Ventikos Y. On the influence of variation in haemodynamic conditions on the generation and growth of cerebral aneurysms and atherogenesis. A computational model Journal of Biomechanics. 2007;40:3626–3640. doi: 10.1016/j.jbiomech.2007.06.013. [DOI] [PubMed] [Google Scholar]
- 2.Zhang C, Xie S, Li S, Pua F, Denga X, Fan Y, Li D. Flow patterns and wall shear stress distribution in human internal carotid arteries. The geometric effect on the risk for stenoses Journal of Biomechanics. 2012;45(1):83–89. doi: 10.1016/j.jbiomech.2011.10.001. [DOI] [PubMed] [Google Scholar]
- 3.Mantha A, Karmonik C, Benndorf G, Strother C, Metcalfe R. Hemodynamics in a Cerebral Artery before and after the Formation of an Aneurysm American. Journal of Neuroradiology. 2006;27(5):1113–1118. [PMC free article] [PubMed] [Google Scholar]
- 4.Ku DN, Giddens DP, Zarnis CK, Glagov S. Pulsatile Flow and Atherosclerosis in the Human Carotid Bifurcation Positive Correlation between Plaque Location and Low and Oscillating Shear Stress. Thrombosis, and Vascular Biology. 1985;5(3):293–302. doi: 10.1161/01.atv.5.3.293. [DOI] [PubMed] [Google Scholar]
- 5.Ford MD, Alperin N, Lee SH, Holdsworth DW, Steinman DA. Characterization of volumetric flow rate waveforms in the normal internal carotid and vertebral arteries. Physiol Meas. 2005;26(4):477–488. doi: 10.1088/0967-3334/26/4/013. [DOI] [PubMed] [Google Scholar]
- 6.Holdsworth DW, Norley CJ, Frayne R, Steinman DA, Rutt BK. Characterization of common carotid artery blood-flow waveforms in normal human subjects. 1999;20(3):219–240. doi: 10.1088/0967-3334/20/3/301. [DOI] [PubMed] [Google Scholar]
- 7.Nichols WW. Clinical Measurement of Arterial Stiffness Obtained From Noninvasive Pressure Waveforms. American Journal of Hypertension. 2005;18(1 SUPPL):3–10. doi: 10.1016/j.amjhyper.2004.10.009. [DOI] [PubMed] [Google Scholar]
- 8.Hoi Y, Wasserman BA, Xie YJ, Najjar SS, Ferruci L, Lakatta EG, Gerstenblith G, Steinman DA. Characterization of volumetric flow rate waveforms at the carotid bifurcations of older adults. Physiol Meas. 2010;31(3):291–302. doi: 10.1088/0967-3334/31/3/002. [DOI] [PMC free article] [PubMed] [Google Scholar]
- 9.Rinkel GJ, Djibuti M, Algra A, van Gijn J. Prevalence and Risk of Rupture of Intracranial Aneurysms A Systematic Review. Journal of Cerebral Circulation. 1998;29(1):251–256. doi: 10.1161/01.str.29.1.251. [DOI] [PubMed] [Google Scholar]
- 10.Wood MM, Romine LE, Lee YK, Richman KM, O’Boyle MK, Paz DA, Chu PK, Pretorius DH. Spectral Doppler Signature Waveforms in Ultrasonography A Review of Normal and Abnormal Waveforms. Ultrasound Quarterly. 2010;26(2):83–99. doi: 10.1097/RUQ.0b013e3181dcbf67. [DOI] [PubMed] [Google Scholar]
- 11.Martin D, Zaman A, Hacker J, Mendelow D, Birchall D. Analysis of haemodynamic factors involved in carotid atherosclerosis using computational fluid dynamics. Physiological Measurement. 2009;25(3):691–697. doi: 10.1259/bjr/59367266. [DOI] [PubMed] [Google Scholar]
- 12.Kabinejadian F, Cui F, Su B, Danpinid A, Ho P, Leo HL. Effects of a carotid covered stent with a novel membrane design on the blood flow regime and hemodynamic parameters distribution at the carotid artery bifurcation. Medical and Biological Engineering and Computing. 2015;53(2):165–177. doi: 10.1007/s11517-014-1222-2. [DOI] [PubMed] [Google Scholar]
- 13.Amaya R, Pierides A, Tarbell JM. The Interaction between Fluid Wall Shear Stress and Solid Circumferential Strain Affects Endothelial Gene Expression. PloS One. 2015;10(7):1–18. doi: 10.1371/journal.pone.0129952. [DOI] [PMC free article] [PubMed] [Google Scholar]
- 14.Zhao X, Zhao M, Amin-Hanjani S, Du X, Ruland S, Charbel FT. Wall Shear Stress in Major Cerebral Arteries as a Function of Age and GenderA Study of 301 Healthy Volunteers. Neuroimaging. 2015;25(3):403–407. doi: 10.1111/jon.12133. [DOI] [PubMed] [Google Scholar]
- 15.Hirata K, Yaginuma T, O’Rourke MF, Kawakami M. Age-Related Changes in Carotid Artery Flow and Pressure Pulses Possible Implications for Cerebral Microvascular Disease. Stroke. 2006;37(10):2552–2556. doi: 10.1161/01.STR.0000242289.20381.f4. [DOI] [PubMed] [Google Scholar]
- 16.Cebral JR, Castro MA, Burgess JE, Pergolizzi RS, Sheridan MJ, Putman CM. Characterization of Cerebral Aneurysms for Assessing Risk of Rupture By Using Patient- Specific Computational Hemodynamics Models. American Journal of Neuroradiology. 2005;26(10):25502559. [PMC free article] [PubMed] [Google Scholar]
- 17.Venugopal P, Valentino D, Schmitt H, Villablanca J Pablo, Vinuela F, Duckwiler G. Sensitivity of patient-specific numerical simulation of cerebal aneurysm hemodynamics to inflow boundary conditions. Journal of Neurosurgery. 2007;106(6):1051–1060. doi: 10.3171/jns.2007.106.6.1051. [DOI] [PubMed] [Google Scholar]
- 18.Marzo A, Singh P, Larrabide I, Radaelli A, Coley S, Gwilliam M, Wilkinson ID, Lawford P, Reymond P, Patel U, Frangi A, Hose DR. Computational Hemodynamics in Cerebral Aneurysms: The Effects of Modeled Versus Measured Boundary Conditions. Annals of Biomedical Engineering. 2011;39(2):884–896. doi: 10.1007/s10439-010-0187-z. [DOI] [PubMed] [Google Scholar]
- 19.Karmonik C, Yen C, Diaz O, Klucznik R, Grossman RG, Benndorf G. Temporal variations of wall shear stress parameters in intracranial aneurysmsimportance of patient-specific inflow waveforms for CFD calculations. Acta Neurochirurgica. 2010;152(8):1391–1398. doi: 10.1007/s00701-010-0647-0. [DOI] [PubMed] [Google Scholar]
- 20.Shojima M, Oshima M, Takagi K, Torii R, Hayakawa M, Katada K, Morita A, Kirino T. Magnitude and Role of Wall Shear Stress on Cerebral Aneurysm Computational Fluid Dynamic Study of 20 Middle Cerebral Artery Aneurysms. Stroke. 2004;35(11):2500–2505. doi: 10.1161/01.STR.0000144648.89172.0f. [DOI] [PubMed] [Google Scholar]
- 21.Jou LD, Lee DH, Morsi H, Mawad ME. Wall Shear Stress on Ruptured and Unruptured Intracranial Aneurysms at the Internal Carotid Artery. AJNR Am J Neuroradiol. 2008;29:1761–1767. doi: 10.3174/ajnr.A1180. [DOI] [PMC free article] [PubMed] [Google Scholar]
- 22.Xiang J, Natarajan SK, Tremmel M, Ma D, Mocco J, Hopkins LN, Siddiqui AH, Levy EI, Meng H. Hemodynamic Morphologic Discriminants for Intracranial Aneurysm Rupture. Stroke. 2011;42(1):144–152. doi: 10.1161/STROKEAHA.110.592923. [DOI] [PMC free article] [PubMed] [Google Scholar]
- 23.Valen-Sendstad K, Mardal K, Steinman DA. High-resolution CFD detects high-frequency velocity fluctuations in bifurcation, but not sidewall, aneurysms. Journal of Biomechanics. 2013;46(2):402–407. doi: 10.1016/j.jbiomech.2012.10.042. [DOI] [PubMed] [Google Scholar]
- 24.O’Rourke MF, Hashimoto J. Mechanical Factors in Arterial Aging A Clinical Perspective. Journal of the American College of Cardiology. 2006;50(1):1–13. doi: 10.1016/j.jacc.2006.12.050. [DOI] [PubMed] [Google Scholar]
- 25.Cecchia E, Gigliolia C, Valentea S, Lazzeria C, Gensinia GF, Abbatea R, Mannini L. Role of hemodynamic shear stress in cardiovascular disease. Atherosclerosis. 2011;214(2):249–256. doi: 10.1016/j.atherosclerosis.2010.09.008. [DOI] [PubMed] [Google Scholar]
- 26.O’Boyle MK, Vibhakar NI, Chung J, Keen WD, Gosnik BB. Duplex Sonography of the Carotid Arteries in Patients with Isolated Aortic Stenosis: imaging Findings and Relation to Severity of Stenosis. American Journal of Roentgenology. 1996;155:197–202. doi: 10.2214/ajr.166.1.8571875. [DOI] [PubMed] [Google Scholar]
- 27.de Rooij NK, Linn FHH, van der Plas JA, Algra A, Rinkel GJE. Incidence of subarachnoid haemorrhage: a systematic review with emphasis on region, age, gender and time trends. Journal of Neurology, Neurosurgery, and Psychiatry. 2007;78(12):1365–72. doi: 10.1136/jnnp.2007.117655. [DOI] [PMC free article] [PubMed] [Google Scholar]
- 28.Bude RO, Rubin JM. Relationship between the Resistive Index and Vascular Compliance and Resistance. Radiology. 1999;211(2):411–417. doi: 10.1148/radiology.211.2.r99ma48411. [DOI] [PubMed] [Google Scholar]
- 29.Kallman CE, Gosink BB, Gardner DJ. Carotid Duplex Sonography. Bisferious Pulse Contour in Patients with Aortic Valvular Disease. American Journal of Radiology. 1991;157:403–407. doi: 10.2214/ajr.157.2.1853828. [DOI] [PubMed] [Google Scholar]
- 30.Moxham IM. Understanding Arterial Pressure Waveforms. Southern African Journal of Anaesthesia and Analgesia. 2003;9(1):40–42. [Google Scholar]
- 31.Sforza DM, Putman CM, Cebral JR. Computational fluid dynamics in brain aneurysms. Int J Numer Meth Biomed Engng 2012. 2012;28:801–808. doi: 10.1002/cnm.1481. [DOI] [PMC free article] [PubMed] [Google Scholar]
- 32.Tarumi T, Ayaz Khan M, Liu J, Tseng BM, Parker R, Riley J, Zhang R. Cerebral hemodynamics in normal aging: central artery stiffness, wave reflection, and pressure pulsatility. Journal of Cerebral Blood Flow and Metabolism. 2014;34(6):971–978. doi: 10.1038/jcbfm.2014.44. [DOI] [PMC free article] [PubMed] [Google Scholar]
- 33.Xiang J, Tremmel M, Kolega J, Levy EI, Natarajan SK, Meng H. Newtonian viscosity model could overestimate wall shear stress in intracranial aneurysm domes and underestimate rupture risk. Journal of NeuroInterventional Surgery. 2012;4(5):351357. doi: 10.1136/neurintsurg-2011-010089. [DOI] [PubMed] [Google Scholar]
- 34.Scheel P, Ruge C, Schöning M. Flow Velocity and Flow Volume Measureements in the Extracranial Carotid and Vertebral Arteries in Healthy Adults: Reference Data and the Effects of Age. Ultrasound Med Biol. 2000;26(8):1261–1266. doi: 10.1016/s0301-5629(00)00293-3. [DOI] [PubMed] [Google Scholar]
Associated Data
This section collects any data citations, data availability statements, or supplementary materials included in this article.


