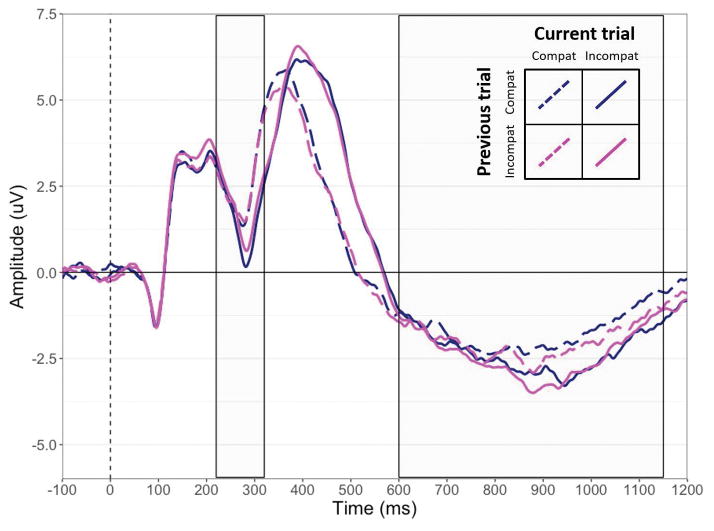
Figure 1.
Grand average ERP waveforms averaged across nine electrodes (F3, Fz, F4, FC3, FCz, FC4, C3, Cz, and C4), plotted as a function of current and previous trial type (compatible, incompatible). The dotted vertical line indicates stimulus onset and the boxes indicate the time windows during which the mean amplitude of the N2 and FSW were computed. Compat = compatible trials; incompat = incompatible trials.

