Abstract
Purpose
To develop echo-planar spectroscopic imaging (EPSI) with large spectral width and accomplish high-resolution imaging of 2-hydroxyglutarate (2HG) at 7T.
Methods
We designed a new EPSI readout scheme at 7T. Data were recorded with dual-readout alternated gradients (DRAG) and combined according to the gradient polarity. Following validation of its performance in phantoms, the new readout scheme, together with previously-reported 2HG-optimized MRS (PRESS TE 78ms), was used for time-efficient and high-resolution imaging of 2HG and other metabolites in five glioma patients pre-treatment. Unsuppressed water, acquired with EPSI, was used as reference for multi-channel combination, eddy-current compensation, and metabolite quantification. Spectral fitting was conducted with LCModel using in-house calculated basis sets.
Results
Using readout gradient strength of 9.5 mT/m and slew rate of 90 mT/m/ms, DRAG-EPSI permitted 1638 Hz spectral width with 6×6 mm2 in-plane resolution at 7T. Phantom data indicated that DRAG-EPSI provides proper metabolite signals and induces much less frequency drifts than conventional EPSI. For spatial resolution of 0.5 mL, 2HG was detected in tumors with precision (CRLB < 10%). 2HG was estimated to be 2.3 – 3.3 mM in tumors of three patients with biopsy-proven IDH mutant gliomas. 2HG was undetectable in an IDH wildtype glioblastoma. For a radiographically-suggested glioma, the estimated 2HG of 2.3±0.2 mM (CRLB < 10%) indicated the lesion may be an IDH-mutant glioma.
Conclusion
Data indicated that the DRAG-EPSI can provide reliable high-resolution imaging of 2HG in glioma patients at 7T in vivo.
Keywords: 2-Hydroxyglutarate (2HG), 1H MRS, 7T, Echo-planar spectroscopy imaging (EPSI), Human brain tumor, Glioma, Dual-readout alternated-gradients EPSI (DRAG-EPSI)
INTRODUCTION
The majority of World Health Organization (WHO) grade II and III gliomas and secondary glioblastomas harbor isocitrate dehydrogenase (IDH) mutations in cytosol (IDH1) and mitochondria (IDH2), and the mutations are associated with longer survival and better response to therapy compared to IDH wildtype tumors (1–3). The IDH mutation gives rise to NADPH-dependent reduction of α-ketoglutarate to 2-hydroxyglutatrate (2HG), leading to elevation of 2HG by orders of magnitude (4–6). Thus 2HG provides a novel imaging biomarker for identifying IDH mutant gliomas noninvasively. In-vivo detection of 2HG was reported in many recent studies, which included single-voxel 1H MRS 3T and 7T (7–14) and multi-voxel MRS imaging (MRSI) at 3T (7,11,15). The spatial resolution in these 2HG imaging studies was relatively low (voxel size ≥ 1.5 mL). Gliomas are highly heterogeneous and infiltrative in malignant transformation. The capability to image 2HG with high resolution rapidly has great potential for patient care and cancer research.
1H echo planar spectroscopic imaging (EPSI) (16) has been widely used for fast and high-resolution mapping of brain metabolites at 3T and 4T (17,18). Imaging of J-coupled spin metabolites at these intermediate filed strengths remains challenging largely because of the low signal strengths and spectral overlaps (19). Recent studies showed that EPSI at 7T confers significantly improved signal gain and spectral resolution (20,21), but the in-vivo applicability in human MR scanners is quite limited due to small spectral widths, insufficient for covering the spectral regions of interest (22).
Several EPSI approaches were proposed for data acquisition and reconstruction. First, odd/even echo editing was conventionally used for neuro-metabolic imaging at 1.5T, 3T and 4T (17–19,22). The echo editing results in a halved spectral width with respect to the acquisition dwell time. Second, the interlaced Fourier transformation approach maintained the full spectral width (23,24), but this was achieved ignoring the prevailing gradient delay artifacts. Third, a dual-readout EPSI with flyback gradients (25) was proposed to increase the spectral width. Data acquired using two sets of interleaved readout gradients with flyback gradients were combined to a single set of data, leading to a spectral width greater by two fold with respect to the acquisition dwell time. This approach was used recently for brain tumor metabolic imaging at 7T, with in-plane resolution of 10×10 mm2 (21). Lastly, time-shift EPSI was proposed for increasing spectral width (26,27).
In this paper, we propose a new EPSI approach, which was designed from the conventional bipolar readout gradient and dual-readout approaches. Taking advantage of the two published schemes, this new method provides increased spectral width, high signal-to-noise ratio (SNR), and small burden on the gradient system, compared to the published EPSI methods. The new EPSI scheme, combined with our previously-reported 2HG-optimized MRS sequence (13), is demonstrated for high-resolution imaging of 2HG and other metabolites at 7T. Following phantom validation of the performance, preliminary data from five brain tumor patients are presented.
THEORY
Conventional EPSI
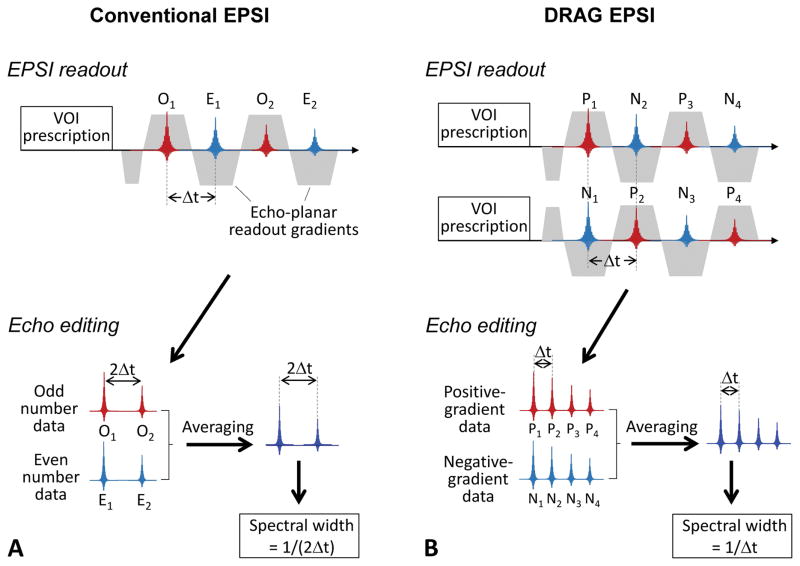
In conventional EPSI, data acquisition may undergo using an alternated-gradient readout with a dwell time of Δt, as shown in Figure 1A. The data acquired during the positive- and negative-polarity gradients are separated into odd- and even-echo sets and each data set is processed for eddy current compensation and phase correction. The two sets of data may then be averaged to improve SNR. Ghost artifacts due to asymmetries in gradient switching can be removed with the odd/even echo editing (28). The dwell time of the reconstructed data is twice (2Δt) the acquisition dwell time, resulting in spectral width of 1/(2Δt). The spectral width of this conventional EPSI in human MR scanners is typically about 1 kHz (18,22), which is ~3.3 ppm at 7T.
Figure 1.
(A) Conventional EPSI readout scheme is depicted with the data processing procedures. Following a VOI prescription sequence (e.g., PRESS), odd-number echoes (O1, O2, O3, etc.) and even-number echoes (E1, E2, E3, etc.) are acquired with a dwell time of Δt and combined with odd/even echo editing, leading to a set of echo data with a spectral width of 1/(2Δt). (B) Newly-designed EPSI readout scheme is shown together with echo editing procedures. Two sets of data are recorded using dual-readout alternated gradients (DRAG) with opposite polarity, and the positive-gradient data (P1, P2, P3, etc.) and negative-gradient data (N1, N2, N3, etc.) are combined into a set of data, leading to spectral width of 1/Δt.
Dual-readout alternated gradients EPSI (DRAG-EPSI)
Figure 1B depicts a new EPSI readout scheme. The scheme consists of two sets of readouts; one using the conventional alternated-gradient and the other using a polarity-reversed gradient. The data are then sorted into two data sets according to the gradient polarity (i.e., positive-gradient data and negative-gradient data). Following eddy current compensation and phase correction, the two sets of data are averaged, leading to a set of EPSI data with spectral width of 1/Δt, greater by 2 fold compared to conventional EPSI.
METHODS
MR experiments were carried out in a human whole-body 7T MR scanner (Philips Medical Systems, Cleveland, OH) using a quadrature transmit (4 kW RF amplifier) and 32-channel receive head coil (Nova Medical, Wilmington, MA). The gradient system offered maximum amplitude of 40 mT/m, with maximum slew rate of 200 mT/m/ms. In-vitro MRSI experiments were performed in a GE braino phantom (10 cm diameter) and a 6-cm diameter spherical phantom with 2HG (10 mM) and Gly (20 mM). The phantom scans included conventional phase-encoded MRSI, conventional EPSI, and DRAG-EPSI.
Five glioma patients were enrolled, who included a 60-year old male with IDH1-mutated grade-II oligodendroglioma (Patient 1), a 47-year old female with IDH1-mutated grade-II oligodendroglioma (Patient 2), a 58-year old male with IDH1-mutated grade-II oligoastrocytoma (Patient 3), a 50-year old male with radiographically-suggested glioma (Patient 4), and a 40-year old male with IDH wildtype glioblastoma (Patient 5). Other than Patient 4, the four patients had biopsy or surgery after the MR scans, from which the tumor type and IDH mutational status were obtained. MR scans were conducted prior to chemotherapy and/or radiation treatments.
2D MRS imaging was obtained with 1D imaging by DRAG-EPSI (Figure 1B) and another 1D imaging using phase encoding gradients. DRAG-EPSI was preceded by prescription of a volume of interest (VOI) using our previously-reported 7T 2HG-optimized PRESS sequence (13), which had the RF pulse envelopes of our 3T 2HG MRS study (10) (Figure 1d). The PRESS sequence included an 8.8 ms 90° RF pulse (bandwidth 4.7 kHz) and two 12 ms 180° RF pulses (bandwidth 1.4 kHz) at RF field intensity (B1) of 15 μT. The echo-planar readout gradient consisted of 512 alternating trapezoidal gradients with amplitude of 9.5 mT/m and slope of 90 mT/m/ms (slope length of 105 μs and plateau length of 400 μs). The data of opposed-polarity readouts were acquired in an interleaved fashion. The spectral width of the DRAG-EPSI was 1638 Hz (5.5 ppm at 7T). Flip angle calibration was performed on the PRESS-prescribed VOI using a vendor-supplied T1 insensitive double-stimulated-echo method (29). Water suppression was obtained with VAPOR (variable power and optimized relaxation delays). Up to second order B0 shimming was carried out on the VOI using a vendor-supplied tool. Water-suppressed DRAG-EPSI was acquired with the following parameters: PRESS TE = 78 ms (TE1 = 58 ms and TE2 = 20 ms), TR = 2 s, field of view = 198×180 mm2, slice thickness = 14 mm, spatial resolution = 0.5 mL (6×6×14 mm3), data matrix size = 33×30×512, and number of signal averages = 16. The scan time was 16 min, of which 8 min was spent for each of the two readouts. Depending on the tumor size, the VOI ranged from 60×60 to 90×90 mm2. Unsuppressed-water imaging data were acquired with VOI prescription by TE 78 ms PRESS using DRAG-EPSI and by TE 13 ms STEAM using conventional EPSI (scan times of 2 and 1 min respectively). T2w-FLAIR (T2-weighted fluid attenuated inversion recovery imaging) was acquired for tumor identification (TR/TE/TI = 11,000/93/2800ms; field of view = 230×230 mm2; slice thickness of 5 mm; 20 transverse slices). B1 map was obtained using a dual flip angle method (30).
The 2D k-space data was zero filled to 66×60 matrix and subsequently apodized with a 2D Hamming function. The time domain data was zero-filled to 2048 points and apodized with a 3 Hz exponential function. Eddy-current compensation and multi-channel combination were conducted, with in-house computer scripts, using the unsuppressed PRESS DRAG-EPSI water as reference, after which the interleaved data were summed without additional phase correction. About 10% of the spectra in the margin of VOI were discarded in subsequent analyses, which had the chemical-shift displacement effects arising from the use of PRESS 180° RF pulses with 1.4 kHz bandwidth. Spectral fitting was performed between 1.0 and 3.85 ppm, with LCModel software, using in-house calculated basis spectra of 14 metabolites, which included 2HG, Glu (glutamate), Gln (glutamine), NAA (N-acetylaspartate), tCr (creatine + phosphocreatine), Gly (glycine), mI (myo-inositol), GSH (glutathione), Ace (acetate), Lac (lactate), Asp (aspartate), sI (scyllo-inositol), NAAG (N-acetylaspartylglutamate), tCho (glycerophosphorylcholine + phosphorylcholine). The metabolite signal estimates from LCModel were normalized to the unsuppressed TE 13 ms STEAM water for individual voxels, which was to correct for potential B1+ and B1− variations, and subsequently the metabolite concentrations were calculated by scaling the normalized metabolite signal estimates with reference to tCr in normal-appearing gray-matter region at 8 mM. Metabolite estimates with CRLB > 20% were discarded, similarly as in prior EPSI studies (15,17,21). Paired t-test was performed for comparison of metabolite estimates between tumor and contralateral regions, with Bonferroni correction, using SAS software version 9.3 (SAS Institute, Cary, North Carolina). Data are presented as mean ± standard deviation (SD).
RESULTS
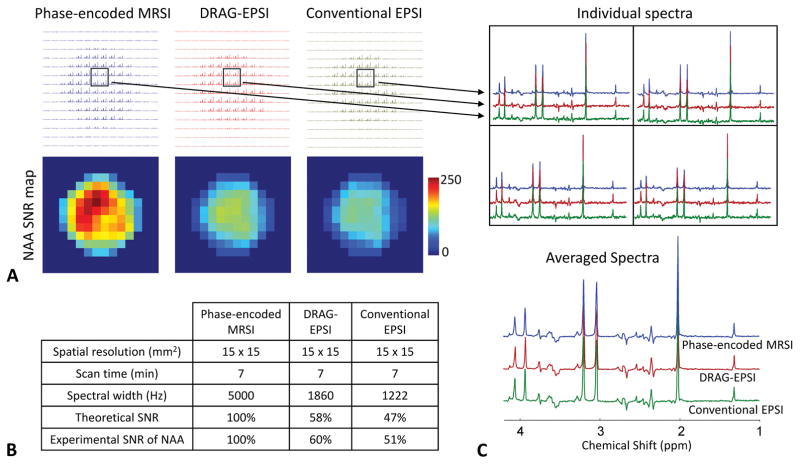
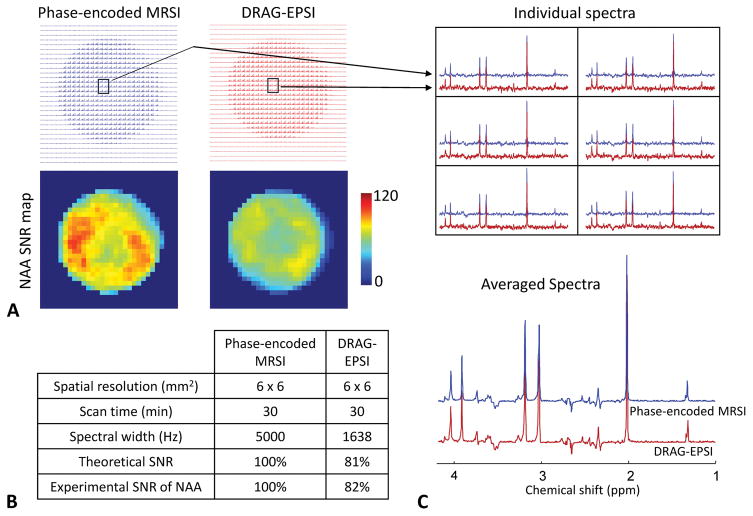
The imaging performance of DRAG-EPSI was compared with conventional phase-encoded MRSI and conventional EPSI in a GE Braino phantom (10 cm diameter). VOI prescription was obtained with TE 78 ms PRESS for all imaging scans. The result is presented in Figure 2, together with the spatial resolution (15×15 mm2), scan time (7 min) and spectral widths of the scans. The intensity and pattern of metabolite signals were in excellent agreement between the three methods, but SNR was notably different between the methods, as shown in NAA SNR maps. Compared to phase-encoded MRSI, the NAA SNR was 60% and 51% for DRAG-EPSI and conventional EPSI respectively, in good agreement with theoretical values that were calculated from the plateau period and ramp time of the readout gradients (25). Also, we compared the DRAG-EPSI performance with conventional phase-encoded MRSI for a higher resolution (6×6 mm2), which was the same resolution as in our in-vivo study. The readout gradients and consequently the spectral width of DRAG-EPSI were also same as in the in-vivo study. The data is shown in Figure 3. With the high-resolution imaging, both methods showed fairly uniform metabolite signals inside the phantom, without considerable signals from outside the phantom. Compared to the 15×15 mm2 resolution case, the NAA SNR in DRAG-EPSI was increased to 81% with respect to phase-encoded MRSI, which was due to the longer plateau period of the readout gradients. The overall spectral pattern and signal strength were both essentially identical between DRAG-EPSI and phase-encoded MRSI.
Figure 2.
Comparison between conventional phase-encoded MRSI (blue), DRAG-EPSI (red) and conventional EPSI (green) in a GE Braino phantom (10 cm diameter) at 7T with resolution of 15×15 mm2 (FOV = 210×210 mm2). Scan time was 7 minutes for each of the methods. Spectra were apodized with a 1 Hz exponential function. A) Layout of all spectra and NAA SNR maps for the three methods. C) SNR comparison between the three methods. Experimental SNR of NAA was 205, 124 and 104 for phase-encoded MRSI, DRAG-EPSI and conventional EPSI, respectively. C) Spectra of 4 voxels for each of the three methods and averaged spectra.
Figure 3.
Comparison between conventional phase-encoded MRSI (blue) and DRAG-EPSI (red) in a GE Braino phantom at 7T with resolution of 6×6 mm2 and FOV of 180×180 mm2. Scan time was 30 minutes for each method. The number of signal averages was 1 and 30 for conventional phase-encoded MRSI and DRAG-EPSI, respectively. Spectra were apodized with a 1 Hz exponential function. A) Layout of all spectra and NAA SNR maps for the two methods. B) SNR comparison between the two methods. Experimental SNR of NAA was 77 and 63 for phase-encoded MRSI and DRAG-EPSI, respectively. C) Spectra of 6 voxels for each of the two methods and averaged spectra.
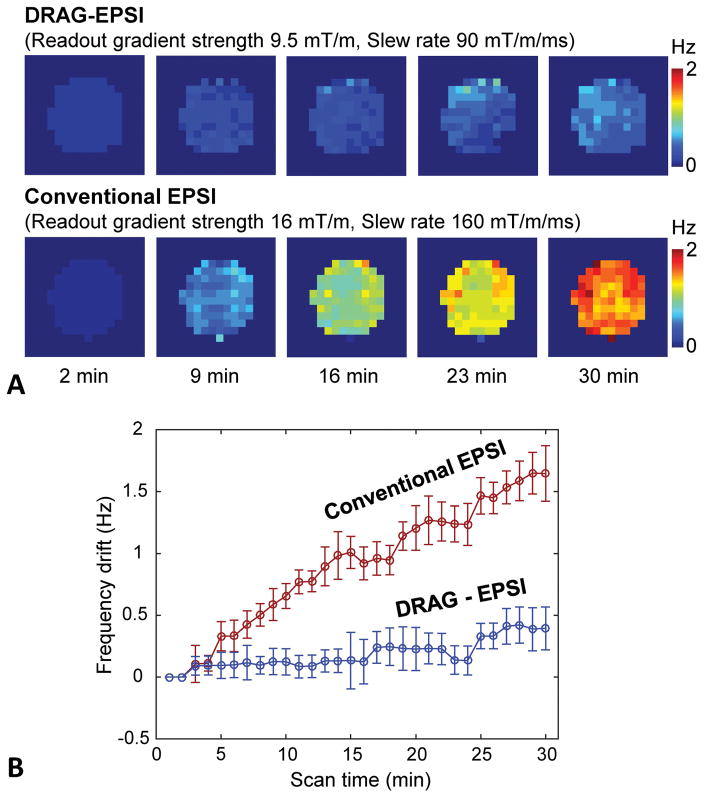
We evaluated potential B0 drifts induced by the readout gradients of DRAG-EPSI and conventional EPSI in a phantom (6 cm diameter sphere). In each of the EPSI scans, 30 images were acquired, with scan time of 1 min for each image. Figure 4 presents the result, together with readout gradient parameters of the scans, which were set for equal resolution (6×6 mm2). The frequency drift was increased with time in each of the methods, but the drift was much smaller in DRAG-EPSI than in conventional EPSI. The average drifts over the voxels within the phantom in DRAG-EPSI and conventional EPSI were measured as 0.12±0.16 Hz and 1.00±0.16 Hz at 16 min, and 0.38±0.17 Hz and 1.64±0.21 Hz at 30 min, respectively.
Figure 4.
Comparison of frequency drifts with time in DRAG-EPSI vs. conventional EPSI (spatial resolution 6×6 mm2 for both). For each of the methods, 30 water images were acquired for 30 min without interruption in a phantom (6 cm diameter). The drift of the water resonance frequency was calculated, voxel by voxel, relative to the first image at 1 min. (A) Maps of frequency drifts at 5 time points. (B) Plot of frequency drift averaged over the voxels within the phantom vs. scan time. Error bars are the standard deviation.
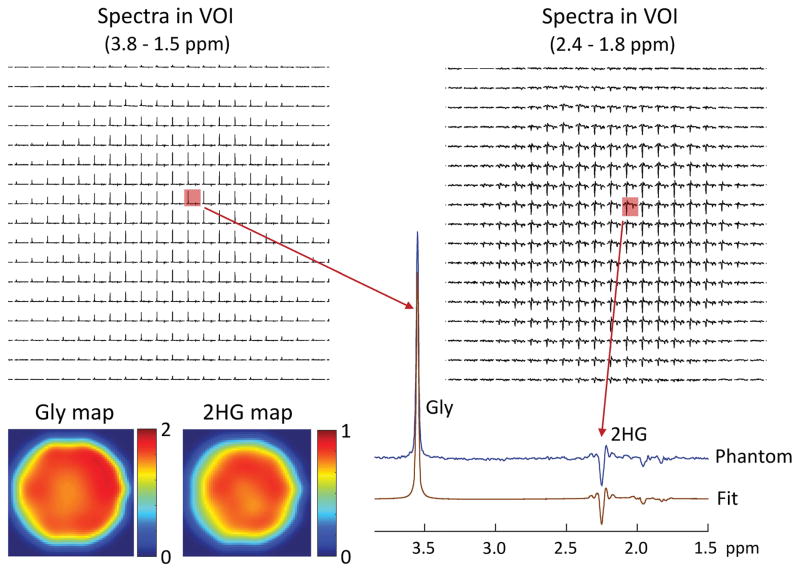
The performance of DRAG-EPSI for 2HG detection was tested in a 6-cm diameter spherical phantom with 2HG (10 mM) and Gly (20 mM). The result is shown in Figure 5. The spectra of individual voxels showed fairly uniform Gly peaks across the VOI. With the use of PRESS TE 78 ms (TE1 = 58 ms and TE2 = 20 ms), the J-coupled C4-proton resonances of 2HG exhibited a negative-polarity signal at 2.25 ppm while the C3-proton signals between 1.8 and 2.0 ppm were diminished. When displayed for 1.8 – 2.4 ppm, the 2HG C4-proton signal was apparently uniform within the VOI. Spectral fitting by LCModel reproduced all spectra well. The 2HG-to-Gly ratio was estimated to be 0.49±0.02 within the phantom, reproducing the prepared concentration ratio of 1/2. The maps of 2HG and Gly estimates showed fairly uniform estimates within the phantom, giving coefficient of variation of 2HG and Gly estimates at 3.7% and 4.2% respectively.
Figure 5.
In vitro validation of DRAG-EPSI at 7T, with VOI prescription by TE 78 ms PRESS (TE1 = 58 ms and TE2 = 20 ms), in a 6-cm diameter spherical phantom solution (pH = 7.2) with 2HG (10 mM) and Gly (20 mM). Spectra within VOI (in-plane resolution 6×6 mm2; slice thickness 14 mm) are shown for 3.8 - 1.5 ppm and 2.4 - 1.8 ppm. A spectrum from a voxel is magnified and shown together with the LCModel fit. The estimated concentration of 2HG and Gly are color coded into maps. The data were acquired at room temperature with TR = 6 s.
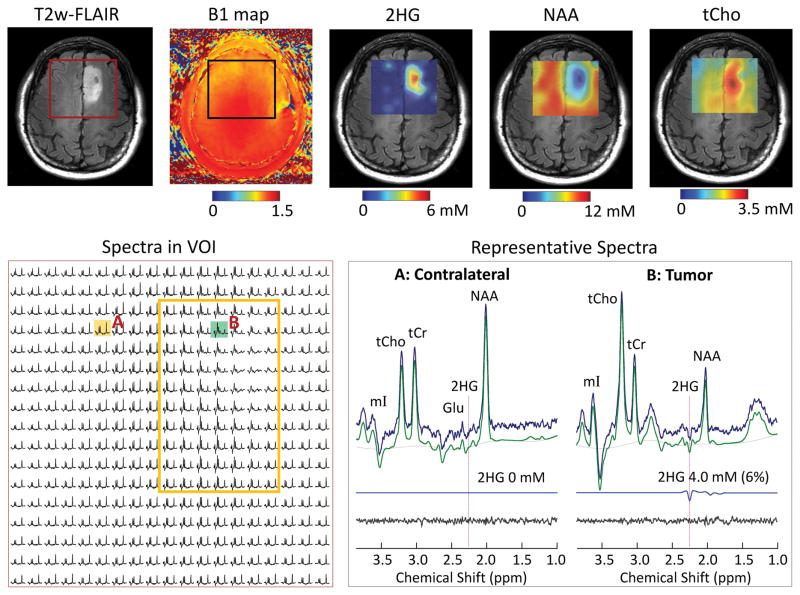
The DRAG-EPSI method was used for imaging 2HG in five glioma patients (3 IDH mutated, 1 unknown IDH mutational status, and 1 IDH wildtype). Figure 6 shows the data from a patient with IDH1 mutant oligodendroglioma (Patient 1). T2w-FLAIR identified a solid tumor mass in the left frontal region. VOI was set at 60×60 mm2, which included the tumor and contralateral volume. The RF field intensity was fairly homogeneous within the VOI (see B1 map). The coefficient of variation (CV = SD/mean) of B1 within the VOI was 6.2%. The signals of NAA, tCr and tCho were uniform outside the tumor region. The spectra from the tumor (upper right region within VOI) were dominated by increased tCho signals. An inverted peak was clearly discernible at 2.25 ppm in spectra from the tumor (see the spectrum from location B), which should be attributed to 2HG given that the adjacent signals of Glu, Gln and GABA are all positive at the PRESS echo-time condition (13). 2HG was estimated to be up to 5 mM in the tumor and was undetectable in the normal-appearing regions. The metabolite maps showed increase in tCho and decreases in NAA and tCr.
Figure 6.
In vivo DRAG-EPSI data from a patient with IDH1-mutated grade-II oligodendroglioma (Patient 1), obtained using TE 78 ms PRESS for VOI prescription at 7T. Shown in upper panel are VOI in T2w-FLAIR and B1 map, and maps of 2HG, NAA and tCho, which were generated with 5-fold bilinear interpolation using Matlab. In the lower panel, spectra within VOI are displayed for 1.8 – 3.85 ppm on the left, with a yellow box indicating the tumor. On the right, spectra in tumor (location B) and contralateral (location A) are shown together with LCModel fits, residuals and 2HG signals. The 2HG estimates are presented with CRLB values in brackets.
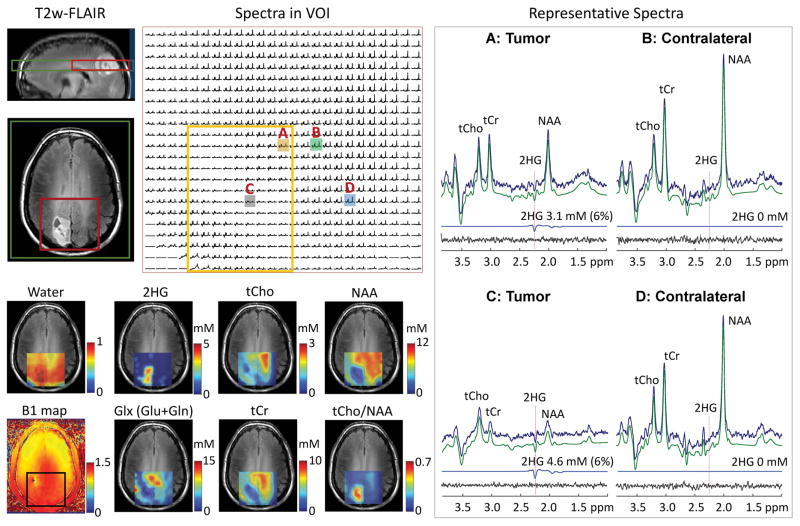
Data from another subject with IDH1 mutant oligodendroglioma is presented in Figure 7. A tumor mass was identified in the right parietal region. The CV of B1 within VOI was 6.6%. Many spectra within the tumor left-top to right-down exhibited relatively small metabolite signals, indicating that the region may be largely cystic. 2HG was clearly detectable with CRLB < 10% in most of the spectra from the tumor. The center of the tumor mass (location C) showed high 2HG (4.6 mM, CRLB 6%) and the right upper part of the tumor (location A) showed somewhat lower 2HG (3.1 mM, CRLB 6%). In contrast, the tCho level in this tumor was lower than normal (see tCho map). The tCho level was as low as 0.7 mM in the tumor (see spectrum from location C), quite lower than the levels in the normal-appearing brain regions (~1.5 mM; see spectra from locations B and D). With reduction of NAA in tumors, the tCho/NAA ratio was higher in the tumor than in contralateral (0.5 – 0.7 vs. ~0.1).
Figure 7.
In vivo DRAG-EPSI data from a patient with IDH1-mutated grade-II oligodendroglioma (Patient 2), obtained using TE 78 ms PRESS for VOI prescription at 7T. Shown on top of T2w-FLAIR images (left, top) are the positioning of VOI (red line) and FOV (green line). Spectra within VOI are displayed with a yellow box indicating the tumor mass. On the right, representative spectra from tumor (voxels A and C) and contralateral (voxels B and D) are presented with LCModel analysis results. On the left bottom, the TE 13 ms STEAM water map, B1 map and maps of 2HG and 5 other metabolites are shown on top of T2w-FLAIR images.
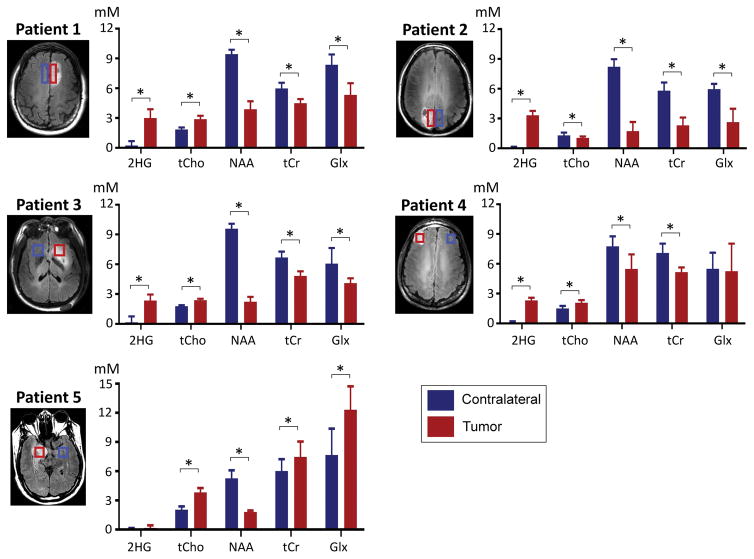
For the five patients of the present study, we calculated the mean value and SD of B1 within VOI. The coefficient of variation (CV) of B1 was 3.8, 5.3, 6.2, 6.6 and 7.3%, giving a mean CV of 5.8±1.4%. The CV of B0 was estimated to be 2.5, 3.6, 6.6, 13 and 16 Hz in the patients, with a mean CV at 8.3±5.9 Hz. For each of the five patients, the estimated concentrations of seven metabolites were averaged over the tumor volume and the normal-appearing contralateral volume. The result is shown in Figure 8. 2HG was detectable in the three patients with biopsy-proven IDH mutant tumors (3.0±0.9, 3.3±0.4 and 2.3±0.6 mM in Patients 1, 2 and 3 respectively). 2HG was also clearly detected in a subject with radiographically-suggested glioma (2.3±0.2 mM in Patient 4), indicating this tumor may be an IDH mutant glioma. For these four tumors, the 2HG estimate difference between tumor and contralateral was significant (p < 0.001). In contrast, 2HG was undetectable in Patient 5, indicating that the lesion had wildtype IDH. After the MRS scan, the patient underwent a surgery and the lesion was found to be a primary glioblastoma, in which the incidence rate of IDH mutation is very low (< 5%) (2,3). In four tumors other than Patient 2, the tCho level was estimated to be higher in tumors than in contralateral. The concentration of NAA was significantly lower in tumor than in contralateral brain in all cases. For Glx (Glu+Gln), the concentration was significantly lower in tumor tissue than in contralateral brain in Patients 1, 2 and 3, but significantly elevated in the glioblastoma (Patient 5) (Gln ~8 mM and Glu ~3 mM).
Figure 8.
Comparison of the estimated concentrations of 2HG and 4 other metabolites in tumor vs. normal-appearing contralateral brain in five glioma patients. Metabolite estimates, averaged over the volumes indicated by red and blue rectangles (tumor and contralateral respectively), are bar-graphed with standard deviation (error bars). Asterisks (*) indicate Bonferroni-corrected significant difference (p < 0.05/7), calculated with paired t-test. Glx denotes Glu+Gln.
DISCUSSION
We present high-resolution imaging of 2HG and other metabolites in brain tumor patients at 7T, achieved using a newly-designed EPSI scheme (DRAG-EPSI). To our best knowledge, this is the first report of in-vivo 7T imaging of 2HG in brain tumor patients, obtained with 6×6 mm2 in-plane resolution. A spectral width of 1638 Hz was achieved with relatively low gradient strengths. This spectral width with 6×6 mm2 in-plane resolution was not achievable using conventional EPSI even when the slew rate was maximized to 200 mT/m/ms in our 7T MR scanner, which may cause coil overheating and high acoustic noise and consequently can aggravate data quality and patient compliance (31). However, DRAG-EPSI allowed to use a readout gradient strength of 9.5 mT/m and a slew rate of 90 mT/m/ms, enjoying a decrease of acoustic noise level from 120 dB (conventional EPSI) to 80 dB (DRAG-EPSI), as measured with a microphone placed inside the magnet. In addition, it is noteworthy that the data processing in DRAG-EPSI is relatively straightforward. Since the data acquisition time points are identical between the positive and negative gradient data, these interleaved data can be directly summed following the eddy-current compensation using the DRAG-EPSI water data, without need of first-order phase correction, which may be required in time-shift EPSI (26,27).
When EPSI data are recorded only during the plateau period of readout gradients, SNR penalty may occur relative to the usual continuous sampling and the SNR efficiency, ESNR, can be calculated from the gradient plateau and ramp periods, as described in a prior study (25). For the readout gradient strength and slew rate used in the present study and for in-plane resolution of 6×6 mm2, ESNR of DRAG-EPSI may be identical to that of conventional EPSI (81%) and is expected to be higher by ~33% compared to the dual-readout flyback EPSI, whose spectral width can be as high as 1865 Hz with a very large peak flyback gradient strength (−20 mT/m). ESNR can be increased using a high slew rate. When the slew rate is increased to 150 mT/m/ms, which was used in the Cunningham et al. study (25), the ESNR of DRAG-EPSI will be increased to 92% with readout gradient strength of 7.4 mT/m and spectral width of 1638 Hz. This spectral width may be easily achievable by dual-readout flyback EPSI using readout gradient strength of 4.6 mT/m and peak flyback gradient strength of −25 mT/m, and ESNR will be 83%, lower compared to DRAG-EPSI. For conventional EPSI, the maximum-achievable spectral width will be 1110 Hz using readout gradient strength of 16 mT/m, and ESNR will be 73%. Taken together, DRAG-EPSI has advantages over conventional EPSI and dual-readout flyback EPSI in terms of ESNR and gradient stress.
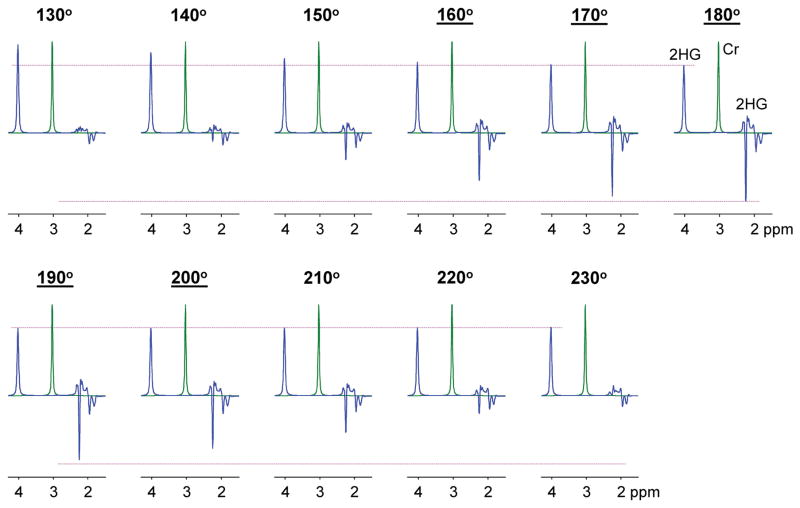
In the present study, field inhomogeneities were minimized by performing B0 shimming and B1 calibration on the VOI. For the 5 subjects, the B0 variation within VOI was 3 – 16 Hz and the B1 variations within VOI was 4 – 7% with respect to the mean B1. The average coefficient of variation of B1 over 5 patients was 5.8%. For PRESS, the spectral pattern and strength of J-coupled resonances are sensitive to the flip angle of the refocusing RF pulses, whilst the flip angle variation of the excitation RF pulse may have equal effects on the coupled and uncoupled spin signal strengths without altering the coupled-spin signal pattern. The effect of the refocusing pulse flip angle is more pronounced in strongly-coupled resonances than in weakly-coupled resonances. A refocusing pulse flip angle range of 160° – 200° may correspond to 95% confidence interval of the B1 variation in this study (i.e., 1.96×5.8% = 11.4%). A simulation indicated that, when normalized to a singlet, the 2HG C2-proton signal at 4.02 ppm remains about the same for the flip angle range, but the 2HG C4-proton signal is reduced as the flip angle deviates from 180° (see Figure 9). The 2HG 2.25 ppm signal to singlet ratios at flip angles of 160° and 200° were respectively 70% and 78% with respect to that at the 180° flip angle. The average singlet linewidth over five subjects was 9 Hz. With 3 Hz apodization, the SNR was improved and the resulting linewidth was 12 Hz. Our prior study using the 2HG-optimized PRESS (13) showed that the 2HG 2.25-ppm signal can be reliably separated from adjacent signals up to singlet linewidth of 12 Hz. Achievement of high B1 homogeneity is challenging at 7T. Uniform RF excitation may be achievable with adiabatic RF pulses for VOI prescription, similarly as in a prior single-voxel 2HG MRS study at 7T (12), in which 5–6 s TR was used. Use of long TR, which is needed to meet the specific absorption rate (SAR) requirement, hampers fast imaging of 2HG, whose signal is relatively small. In our study, without use of adiabatic RF pulse, the B1 issue was alleviated with VOI-specific B1 optimization.
Figure 9.
Numerically-calculated PRESS spectra of 2HG for various flip angles of the refocusing RF pulses. The flip angle is shown at the top of each spectrum. Underlined flip angles indicate the 95% confidence interval of the flip angle variation within VOI in the present study. The simulation was carried out incorporating the slice-selective RF and gradient pulses of the present study. The flip angle was varied by changing the RF pulse amplitude and keeping the RF pulse duration fixed at 12 ms. The 2HG signal was normalized to the Cr 3.03 ppm singlet for each flip angle. The 2HG to Cr concentration ratio was 5:1 in the simulation. Spectra were broadened to Cr singlet linewidth (FWHM) of 12 Hz. Dashed horizontal lines (in pink) indicate the amplitudes of the 2HG 2.25 and 4.02 ppm signals at the 180° flip angle.
The benefit of EPSI may be fully realized when metabolites are imaged with a much shorter scan time for a much higher matrix size imaging compared to conventional phase-encoded MRSI. In our study, the data matrix size was 33×30 with a scan time of 16 min. We chose to use a 2 s TR for metabolite quantification with relatively small variations in T1 saturation effects across the brain metabolites, since the metabolite T1s are fairly long at 7T (~1.8 s) (32). For 33×30 matrix size and 2 s TR, elliptically phase-encoded MRSI with single average may require ~26 min scan time (= π/4×33 min), 1.6 fold longer than our DRAG-EPSI scan time. Scan time reduction benefit of DRAG-EPSI with respect to conventional phase-encoded MRSI can be further realized in higher matrix imaging of 2HG (e.g., 3D imaging).
Since DRAG-EPSI requires dual readouts, the method has a loss in acceleration by a factor of 2 in such cases that conventional EPSI with single signal averaging per k-space point is sufficient. However, when multiple signal averaging is required for increasing SNR (as in the present study for measuring 2HG whose signals are relatively small), the data acquisitions may be split into two readouts without losing the acceleration factor compared to conventional EPSI.
Given the high clinical significance of 2HG, establishing a 2HG detection threshold may be clinically useful. It may require a rigorous analysis of many patient data from IDH mutant or wildtype tumors. With the limited number of patient data in the present study, we did not attempt to define the lower limit of 2HG detection, focusing on demonstration of new EPSI readout. Since detection of a metabolite depends on several factors, which include SNR, linewidth, interfering signals, overall spectral baseline, etc., a 2HG concentration threshold may not be easily definable. A most reliable threshold may be whether a 2HG signal is visually discernible in the spectrum or not. In this regard, the opposite signal polarity of 2HG with respect to the neighboring resonances of GABA and Glu, accomplished using the TE 78 ms PRESS at 7T, may help improve 2HG detection compared to short-TE MRS at 7T, as shown in our prior study (13). In this prior study, 2HG at 1 mM or higher was detectable with CRLBs smaller than 7%. In the present study, we discarded metabolite estimates with CRLB > 20%, which usually corresponded to 2HG estimates < 0.5 mM.
Lastly, the 2HG concentration was similar in Patients 1 and 2 (i.e., 3.0 and 3.3 mM), but tCho, which is considered to be a marker of membrane turnover (33), was ~3 fold higher in Patient 1 than in Patient 2 (2.9 vs. 1.0 mM). A prior 2HG MRS study showed correlation of 2HG level with tumor cellularity in gliomas (11). Lack of correlation between 2HG and tCho was reported in a prior 2HG study of 14 patients with IDH mutant gliomas (14). These lines of observation suggest that 2HG production may be related to tumor cellularity but may also be attributed to the differential competency of IDH mutant gliomas to produce 2HG.
CONCLUSION
In vivo high-resolution imaging of 2HG in glioma patients was achieved using a new 1H EPSI approach at 7T. DRAG-EPSI, with dual bipolar readout alternated gradients and simple data processing, offered increased spectral window and SNR compared to published EPSI methods. As a well-established biomarker for IDH mutant gliomas, high-resolution imaging of the oncometabolite 2HG has high diagnostic and prognostic value. The proposed 2HG imaging technique has potential application to monitor the 2HG levels in therapeutic drug trials targeting IDH inhibition in gliomas (34–36).
Acknowledgments
This work was supported by the National Cancer Institute of the National Institutes of Health under award number R01CA184584 and by the Cancer Prevention Research Institute of Texas under award numbers RP140021-P04 and RP130427. We thank Ms. Kelley Derner and Lucy Christie for subject recruitment and Dr. Ivan Dimitrov for technical assistance.
References
- 1.Balss J, Meyer J, Mueller W, Korshunov A, Hartmann C, von Deimling A. Analysis of the IDH1 codon 132 mutation in brain tumors. Acta neuropathologica. 2008;116:597–602. doi: 10.1007/s00401-008-0455-2. [DOI] [PubMed] [Google Scholar]
- 2.Parsons DW, Jones S, Zhang X, Lin JC, Leary RJ, Angenendt P, Mankoo P, Carter H, Siu IM, Gallia GL, Olivi A, McLendon R, Rasheed BA, Keir S, Nikolskaya T, Nikolsky Y, Busam DA, Tekleab H, Diaz LA, Jr, Hartigan J, Smith DR, Strausberg RL, Marie SK, Shinjo SM, Yan H, Riggins GJ, Bigner DD, Karchin R, Papadopoulos N, Parmigiani G, Vogelstein B, Velculescu VE, Kinzler KW. An integrated genomic analysis of human glioblastoma multiforme. Science. 2008;321:1807–1812. doi: 10.1126/science.1164382. [DOI] [PMC free article] [PubMed] [Google Scholar]
- 3.Yan H, Parsons DW, Jin G, McLendon R, Rasheed BA, Yuan W, Kos I, Batinic-Haberle I, Jones S, Riggins GJ, Friedman H, Friedman A, Reardon D, Herndon J, Kinzler KW, Velculescu VE, Vogelstein B, Bigner DD. IDH1 and IDH2 mutations in gliomas. New Engl J Med. 2009;360:765–773. doi: 10.1056/NEJMoa0808710. [DOI] [PMC free article] [PubMed] [Google Scholar]
- 4.Dang L, White DW, Gross S, Bennett BD, Bittinger MA, Driggers EM, Fantin VR, Jang HG, Jin S, Keenan MC, Marks KM, Prins RM, Ward PS, Yen KE, Liau LM, Rabinowitz JD, Cantley LC, Thompson CB, Vander Heiden MG, Su SM. Cancer-associated IDH1 mutations produce 2-hydroxyglutarate. Nature. 2009;462:739–744. doi: 10.1038/nature08617. [DOI] [PMC free article] [PubMed] [Google Scholar]
- 5.Figueroa ME, Abdel-Wahab O, Lu C, Ward PS, Patel J, Shih A, Li Y, Bhagwat N, Vasanthakumar A, Fernandez HF, Tallman MS, Sun Z, Wolniak K, Peeters JK, Liu W, Choe SE, Fantin VR, Paietta E, Lowenberg B, Licht JD, Godley LA, Delwel R, Valk PJ, Thompson CB, Levine RL, Melnick A. Leukemic IDH1 and IDH2 mutations result in a hypermethylation phenotype, disrupt TET2 function, and impair hematopoietic differentiation. Cancer Cell. 2010;18:553–567. doi: 10.1016/j.ccr.2010.11.015. [DOI] [PMC free article] [PubMed] [Google Scholar]
- 6.Ward PS, Patel J, Wise DR, Abdel-Wahab O, Bennett BD, Coller HA, Cross JR, Fantin VR, Hedvat CV, Perl AE, Rabinowitz JD, Carroll M, Su SM, Sharp KA, Levine RL, Thompson CB. The common feature of leukemia-associated IDH1 and IDH2 mutations is a neomorphic enzyme activity converting alpha-ketoglutarate to 2-hydroxyglutarate. Cancer Cell. 2010;17:225–234. doi: 10.1016/j.ccr.2010.01.020. [DOI] [PMC free article] [PubMed] [Google Scholar]
- 7.Choi C, Ganji SK, Deberardinis RJ, Hatanpaa KJ, Rakheja D, Kovacs Z, Yang XL, Mashimo T, Raisanen JM, Marin-Valencia I, Pascual JM, Madden CJ, Mickey BE, Malloy CR, Bachoo RM, Maher EA. 2-Hydroxyglutarate detection by magnetic resonance spectroscopy in IDH-mutated patients with gliomas. Nat Med. 2012;18:624–629. doi: 10.1038/nm.2682. [DOI] [PMC free article] [PubMed] [Google Scholar]
- 8.Andronesi OC, Kim GS, Gerstner E, Batchelor T, Tzika AA, Fantin VR, Vander Heiden MG, Sorensen AG. Detection of 2-hydroxyglutarate in IDH-mutated glioma patients by in vivo spectral-editing and 2D correlation magnetic resonance spectroscopy. Sci Transl Med. 2012;4:116ra114. doi: 10.1126/scitranslmed.3002693. [DOI] [PMC free article] [PubMed] [Google Scholar]
- 9.Pope WB, Prins RM, Albert Thomas M, Nagarajan R, Yen KE, Bittinger MA, Salamon N, Chou AP, Yong WH, Soto H, Wilson N, Driggers E, Jang HG, Su SM, Schenkein DP, Lai A, Cloughesy TF, Kornblum HI, Wu H, Fantin VR, Liau LM. Non-invasive detection of 2-hydroxyglutarate and other metabolites in IDH1 mutant glioma patients using magnetic resonance spectroscopy. J Neurooncol. 2012;107:197–205. doi: 10.1007/s11060-011-0737-8. [DOI] [PMC free article] [PubMed] [Google Scholar]
- 10.Choi C, Ganji S, Hulsey K, Madan A, Kovacs Z, Dimitrov I, Zhang S, Pichumani K, Mendelsohn D, Mickey B, Malloy C, Bachoo R, Deberardinis R, Maher E. A comparative study of short- and long-TE 1H MRS at 3 T for in vivo detection of 2-hydroxyglutarate in brain tumors. NMR Biomed. 2013;26:1242–1250. doi: 10.1002/nbm.2943. [DOI] [PMC free article] [PubMed] [Google Scholar]
- 11.Choi C, Raisanen JM, Ganji SK, Zhang S, McNeil SS, An Z, Madan A, Hatanpaa KJ, Vemireddy V, Sheppard CA, Oliver D, Hulsey KM, Tiwari V, Mashimo T, Battiste J, Barnett S, Madden CJ, Patel TR, Pan E, Malloy CR, Mickey BE, Bachoo RM, Maher EA. Prospective Longitudinal Analysis of 2-Hydroxyglutarate Magnetic Resonance Spectroscopy Identifies Broad Clinical Utility for the Management of Patients With IDH-Mutant Glioma. J Clin Oncol. 2016;34:4030–4039. doi: 10.1200/JCO.2016.67.1222. [DOI] [PMC free article] [PubMed] [Google Scholar]
- 12.Emir UE, Larkin SJ, de Pennington N, Voets N, Plaha P, Stacey R, Al-Qahtani K, McCullagh J, Schofield CJ, Clare S, Jezzard P, Cadoux-Hudson T, Ansorge O. Noninvasive Quantification of 2-Hydroxyglutarate in Human Gliomas with IDH1 and IDH2 Mutations. Cancer Res. 2016;76:43–49. doi: 10.1158/0008-5472.CAN-15-0934. [DOI] [PMC free article] [PubMed] [Google Scholar]
- 13.Ganji SK, An Z, Tiwari V, McNeil S, Pinho MC, Pan E, Mickey BE, Maher EA, Choi C. In vivo detection of 2-hydroxyglutarate in brain tumors by optimized point-resolved spectroscopy (PRESS) at 7T. Magn Reson Med. 2017;77:936–944. doi: 10.1002/mrm.26190. [DOI] [PMC free article] [PubMed] [Google Scholar]
- 14.An Z, Ganji SK, Tiwari V, Pinho MC, Patel T, Barnett S, Pan E, Mickey BE, Maher EA, Choi C. Detection of 2-hydroxyglutarate in brain tumors by triple-refocusing MR spectroscopy at 3T in vivo. Magn Reson Med. 2017;78:40–48. doi: 10.1002/mrm.26347. [DOI] [PMC free article] [PubMed] [Google Scholar]
- 15.Andronesi OC, Loebel F, Bogner W, Marjanska M, Vander Heiden MG, Iafrate AJ, Dietrich J, Batchelor TT, Gerstner ER, Kaelin WG, Chi AS, Rosen BR, Cahill DP. Treatment Response Assessment in IDH-Mutant Glioma Patients by Noninvasive 3D Functional Spectroscopic Mapping of 2-Hydroxyglutarate. Clin Cancer Res. 2016;22:1632–1641. doi: 10.1158/1078-0432.CCR-15-0656. [DOI] [PMC free article] [PubMed] [Google Scholar]
- 16.Masnsfield P. Spatial mapping of the chemical shift in NMR. Magn Reson Chem. 1984;1:370–386. doi: 10.1002/mrm.1910010308. [DOI] [PubMed] [Google Scholar]
- 17.Posse S, Otazo R, Caprihan A, Bustillo J, Chen H, Henry PG, Marjanska M, Gasparovic C, Zuo C, Magnotta V, Mueller B, Mullins P, Renshaw P, Ugurbil K, Lim KO, Alger JR. Proton echo-planar spectroscopic imaging of J-coupled resonances in human brain at 3 and 4 Tesla. Magn Reson Med. 2007;58:236–244. doi: 10.1002/mrm.21287. [DOI] [PubMed] [Google Scholar]
- 18.Sabati M, Sheriff S, Gu M, Wei J, Zhu H, Barker PB, Spielman DM, Alger JR, Maudsley AA. Multivendor implementation and comparison of volumetric whole-brain echo-planar MR spectroscopic imaging. Magn Reson Med. 2015;74:1209–1220. doi: 10.1002/mrm.25510. [DOI] [PMC free article] [PubMed] [Google Scholar]
- 19.Maudsley AA, Gupta RK, Stoyanova R, Parra NA, Roy B, Sheriff S, Hussain N, Behari S. Mapping of glycine distributions in gliomas. AJNR American journal of neuroradiology. 2014;35:S31–36. doi: 10.3174/ajnr.A3845. [DOI] [PMC free article] [PubMed] [Google Scholar]
- 20.Otazo R, Mueller B, Ugurbil K, Wald L, Posse S. Signal-to-noise ratio and spectral linewidth improvements between 1. 5 and 7 Tesla in proton echo-planar spectroscopic imaging. Magn Reson Med. 2006;56:1200–1210. doi: 10.1002/mrm.21067. [DOI] [PubMed] [Google Scholar]
- 21.Li Y, Larson P, Chen AP, Lupo JM, Ozhinsky E, Kelley D, Chang SM, Nelson SJ. Short-echo three-dimensional H-1 MR spectroscopic imaging of patients with glioma at 7 Tesla for characterization of differences in metabolite levels. J Magn Reson Imaging. 2015;41:1332–1341. doi: 10.1002/jmri.24672. [DOI] [PMC free article] [PubMed] [Google Scholar]
- 22.Posse S, Otazo R, Dager SR, Alger J. MR spectroscopic imaging: principles and recent advances. J Magn Reson Imaging. 2013;37:1301–1325. doi: 10.1002/jmri.23945. [DOI] [PubMed] [Google Scholar]
- 23.Metzger G, Hu X. Application of interlaced Fourier transform to echo-planar spectroscopic imaging. J Magn Reson. 1997;125:166–170. doi: 10.1006/jmre.1997.1114. [DOI] [PubMed] [Google Scholar]
- 24.Ebel A, Maudsley AA, Weiner MW, Schuff N. Achieving sufficient spectral bandwidth for volumetric 1H echo-planar spectroscopic imaging at 4 Tesla. Magn Reson Med. 2005;54:697–701. doi: 10.1002/mrm.20593. [DOI] [PMC free article] [PubMed] [Google Scholar]
- 25.Cunningham CH, Vigneron DB, Chen AP, Xu D, Nelson SJ, Hurd RE, Kelley DA, Pauly JM. Design of flyback echo-planar readout gradients for magnetic resonance spectroscopic imaging. Magn Reson Med. 2005;54:1286–1289. doi: 10.1002/mrm.20663. [DOI] [PubMed] [Google Scholar]
- 26.Matsui S, Sekihara K, Kohno H. Spatially resolved NMR spectroscopy using phase-modulated spin-echo trains. J Magn Reson. 1986;67:476–490. [Google Scholar]
- 27.Kuroda K, Mulkern RV, Oshio K, Panych LP, Nakai T, Moriya T, Okuda S, Hynynen K, Jolesz FA. Temperature mapping using the water proton chemical shift: self-referenced method with echo-planar spectroscopic imaging. Magn Reson Med. 2000;43:220–225. doi: 10.1002/(sici)1522-2594(200002)43:2<220::aid-mrm8>3.0.co;2-9. [DOI] [PubMed] [Google Scholar]
- 28.Posse S, Tedeschi G, Risinger R, Ogg R, Le Bihan D. High speed 1H spectroscopic imaging in human brain by echo planar spatial-spectral encoding. Magn Reson Med. 1995;33:34–40. doi: 10.1002/mrm.1910330106. [DOI] [PubMed] [Google Scholar]
- 29.Versluis MJ, Kan HE, van Buchem MA, Webb AG. Improved signal to noise in proton spectroscopy of the human calf muscle at 7 T using localized B1 calibration. Magn Reson Med. 2010;63:207–211. doi: 10.1002/mrm.22195. [DOI] [PubMed] [Google Scholar]
- 30.Cunningham CH, Pauly JM, Nayak KS. Saturated double-angle method for rapid B1+ mapping. Magn Reson Med. 2006;55:1326–1333. doi: 10.1002/mrm.20896. [DOI] [PubMed] [Google Scholar]
- 31.Ebel A, Maudsley AA. Detection and correction of frequency instabilities for volumetric 1H echo-planar spectroscopic imaging. Magn Reson Med. 2005;53:465–469. doi: 10.1002/mrm.20367. [DOI] [PubMed] [Google Scholar]
- 32.Xin L, Schaller B, Mlynarik V, Lu H, Gruetter R. Proton T1 relaxation times of metabolites in human occipital white and gray matter at 7 T. Magn Reson Med. 2013;69:931–936. doi: 10.1002/mrm.24352. [DOI] [PubMed] [Google Scholar]
- 33.Howe FA, Opstad KS. 1H MR spectroscopy of brain tumours and masses. NMR Biomed. 2003;16:123–131. doi: 10.1002/nbm.822. [DOI] [PubMed] [Google Scholar]
- 34.Rohle D, Popovici-Muller J, Palaskas N, Turcan S, Grommes C, Campos C, Tsoi J, Clark O, Oldrini B, Komisopoulou E, Kunii K, Pedraza A, Schalm S, Silverman L, Miller A, Wang F, Yang H, Chen Y, Kernytsky A, Rosenblum MK, Liu W, Biller SA, Su SM, Brennan CW, Chan TA, Graeber TG, Yen KE, Mellinghoff IK. An inhibitor of mutant IDH1 delays growth and promotes differentiation of glioma cells. Science. 2013;340:626–630. doi: 10.1126/science.1236062. [DOI] [PMC free article] [PubMed] [Google Scholar]
- 35.Pirozzi CJ, Reitman ZJ, Yan H. Releasing the block: setting differentiation free with mutant IDH inhibitors. Cancer Cell. 2013;23:570–572. doi: 10.1016/j.ccr.2013.04.024. [DOI] [PMC free article] [PubMed] [Google Scholar]
- 36.Dang L, Yen K, Attar EC. IDH mutations in cancer and progress toward development of targeted therapeutics. Ann Oncol. 2016;27:599–608. doi: 10.1093/annonc/mdw013. [DOI] [PubMed] [Google Scholar]


