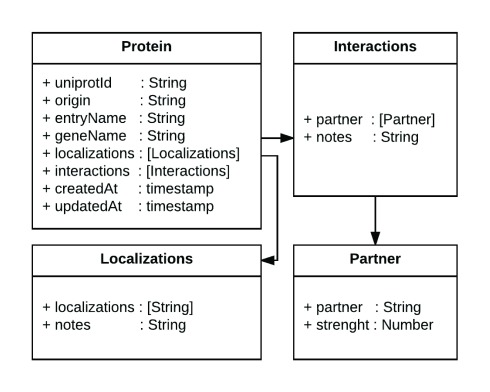
Figure 1. Diagram of the data representation in CellMap.
In the figure we present a diagram of the Protein class, which contains several attributes of type String, two fields of type timestamp and two arrays (in square brackets) that reference the Interactions and Localizations classes. The arrows highlight the referenced models. This simple representation of information about a protein, its protein-protein interaction partners and its localizations enables the tool to be reused with one’s own datasets.

