

Summary
Introgression of genomic variation between and within related crop species is a significant evolutionary approach for population differentiation, genome reorganization and trait improvement. Using the Illumina Infinium Brassica 60K SNP array, we investigated genomic changes in a panel of advanced generation new‐type Brassica napus breeding lines developed from hundreds of interspecific crosses between 122 Brassica rapa and 74 Brassica carinata accessions, and compared them with representative accessions of their three parental species. The new‐type B. napus population presented rich genetic diversity and abundant novel genomic alterations, consisting of introgressions from B. rapa and B. carinata, novel allelic combinations, reconstructed linkage disequilibrium patterns and haplotype blocks, and frequent deletions and duplications (nonrandomly distributed), particularly in the C subgenome. After a much shorter, but very intensive, selection history compared to traditional B. napus, a total of 15 genomic regions with strong selective sweeps and 112 genomic regions with putative signals of selective sweeps were identified. Some of these regions were associated with important agronomic traits that were selected for during the breeding process, while others were potentially associated with restoration of genome stability and fertility after interspecific hybridization. Our results demonstrate how a novel method for population‐based crop genetic improvement can lead to rapid adaptation, restoration of genome stability and positive responses to artificial selection.
Keywords: SNP, resynthesized, interspecific hybridization, genome changes, selective sweep, Brassica
Introduction
Interspecific hybridization is a significant evolutionary process in crop speciation and a frequently used approach for crop genetic improvement (Abbott, 1992; Ellstrand and Schierenbeck, 2000; Hajjar and Hodgkin, 2007; Kuligowska et al., 2016; Mallet, 2005; Rieseberg and Carney, 1998). It is estimated that 25% of all plant species have undergone the process of interspecific hybridization in nature, and this process is thought to broaden genetic diversity and confer evolutionary advantages (Mallet, 2005). During interspecific hybridization, rapid genomic alterations, such as transposon activation, transcriptional and epigenetic modification, and genomic structural variation which can result in potentially beneficial phenotypic variation, were attractive for crop germplasm innovation and thus frequently explored (Adams et al., 2004; Gaeta et al., 2007; Pires et al., 2004; Rieseberg and Ellstrand, 1993; Shaked et al., 2001; Shen et al., 2014; Singh et al., 2005; Soltis et al., 2016; Xiong et al., 2011; Zou et al., 2011). However, interspecific crosses often have strong hybridization barriers and require time‐consuming selection following rapid segregation (Kuligowska et al., 2016; Lowry et al., 2008; Rieseberg and Carney, 1998). Often, offspring in early generations have poor fertility and genome stability (Cifuentes et al., 2010; Mason and Batley, 2015). Additionally, favourable traits introgressed from other species into crops are often tightly linked with undesirable traits, requiring several rounds of recombination and a lot of effort to break these associations (Lewis et al., 2007). Therefore, understanding the factors and mechanisms impacting recombination frequency, genome stability, cross‐compatibility and selective sweeps would allow for better manipulation of interspecific hybridization to improve traits such as fertility, resistance and yield (Bomblies, 2010).
The Brassica ‘U's Triangle’ species (U, 1935) offer an ideal model system for utilizing and understanding the process of interspecific hybridization, particularly in crops (Mason and Snowdon, 2016). The Brassica ‘U's Triangle’ consists of three diploid species: B. rapa (ArAr), B. nigra (BnBn) and B. oleracea (CoCo), and three derived tetraploid species: B. juncea (AjAjBjBj), B. napus (AnAnCnCn) and B. carinata (BcBcCcCc). These species readily hybridize (FitzJohn et al., 2007), and allopolyploid species benefit from genomic plasticity conferred by frequent homoeologous sequence exchanges between their two subgenomes (Chalhoub et al., 2014; Liu et al., 2014; Yang et al., 2016). Abundant genomic variation within and between species also offers strong potential for crop improvement via interspecific hybridization (Zou et al., 2010). On the one hand, rich subgenomic variation exists within each of the Brassica A, B and C genomes as a result of speciation, domestication and geographic differentiation (Chalhoub et al., 2014; Liu et al., 2014; Wang et al., 2011). On the other hand, rich post‐Neolithic variation exists between subgenomes as a result of hybridization, polyploidization, domestication and artificial selection for different human uses, such as between the Ar/Aj/An subgenomes from B. rapa, B. juncea and B. napus (Yang et al., 2016; Zou et al., 2016). Furthermore, early‐modern variation exists within species (diverse lines), resulting from processes such as artificial selection and genetic improvement. Examples include cultivated variation within each of B. napus, B. rapa and B. oleracea (Cheng et al., 2016; Liu et al., 2016; Qian et al., 2014; Wang et al., 2014). Therefore, exploring subgenomic variation in Brassica is potentially very useful in theoretical and applied research.
The predominant oilseed Brassica species currently grown worldwide, B. napus, is a relatively young species, formed no more than a few thousand years ago (Chalhoub et al., 2014). Brassica napus has also only undergone ~400 years of domestication and cultivation, resulting in a narrow genetic base in this crop (Chalhoub et al., 2014). This is also evident in the genome as large blocks of linkage disequilibrium, particularly in the C subgenome (Qian et al., 2014; Wang et al., 2014), which may be related to strong selection pressures and linkage drag in the breeding of ‘double‐low’ seed quality of B. napus. Therefore, introducing novel genetic diversity into the A and especially C subgenome is highly desirable to further broaden the genetic base of B. napus. To this end, major effort has been put towards exploring and utilizing subgenomic variation within each of the Brassica A, B and C subgenomes and between species for B. napus crop improvement. Both targeted gene transfer and whole‐genome introgressions into B. napus have been carried out via interspecific crosses, significantly broadening the genetic base of B. napus and promoting trait improvement and hybrid heterosis (Becker et al., 1995; Chatterjee et al., 2015; Chen et al., 2010; Fu et al., 2012; Li et al., 2014b; Rahman, 2001; Schranz and Osborn, 2000).
With the aim of exploiting subgenomic variation between genomes, between species and within species, we created a ‘new‐type’ B. napus by replacing the AnCn genomes with Ar and Cc subgenomes from multiple accessions of B. rapa and B. carinata, respectively, in our previous studies (Xiao et al., 2010). Subsequently, an advanced germplasm pool of new‐type B. napus was established via six to seven additional rounds of recombination and selection (unpublished). In addition to the introduction of within‐species genetic diversity in B. rapa and B. carinata into new‐type B. napus, we hypothesized that an additional level of genomic variation, novel genomic alterations induced by the hybridization event, would be generated genomewide. In this advanced germplasm pool of new‐type B. napus, our objectives were (i) to analyse the genetic variation within the new‐type B. napus population; (ii) to characterize breakage, reconstruction and fixation of LD and haplotype blocks in this population; (iii) to investigate the presence of novel genetic variation across the genome; and (iv) to find signals of agricultural selective pressure and assess the role they played in the establishment of a new ‘species type’. These analyses help reveal genome evolutionary processes after massive exotic genome introgressions into an established species.
Results
Genetic diversity in the new‐type B. napus population: substantial population differentiation compared with the parental species
A total of 130 inbred lines of the new‐type B. napus (BnN) were bred from hundreds of interspecific crosses involving 74 accessions of B. carinata and 122 accessions of B. rapa (Figure 1; Table S1). Together with 15 B. rapa accessions (Br), 14 B. carinata accessions (Bc) and 130 traditional B. napus accessions (BnT), the BnN lines (Table S2) were genotyped using Brassica 60K Illumina Infinium SNP arrays. After marker filtering, a total of 33 541, 13 958 and 3990 polymorphic SNPs were scored in the populations of BnN, Br and Bc, respectively (Table S3), and a total of 37 473 polymorphic SNPs were scored in the whole four populations and used to evaluate the population differentiation. The average PIC (0.29) and gene diversity (0.36) within the BnN population were the same for both the A and C genomes (Table S3). The mean PIC, gene diversity and genetic distance (average value of 0.27) within the BnN population were comparable to that presented within the BnT population (Tables S3 and 1). These results indicated comparable genetic diversity in the new‐type B. napus population evaluated with the 60K‐SNP array compared with that of the traditional B. napus population.
Figure 1.
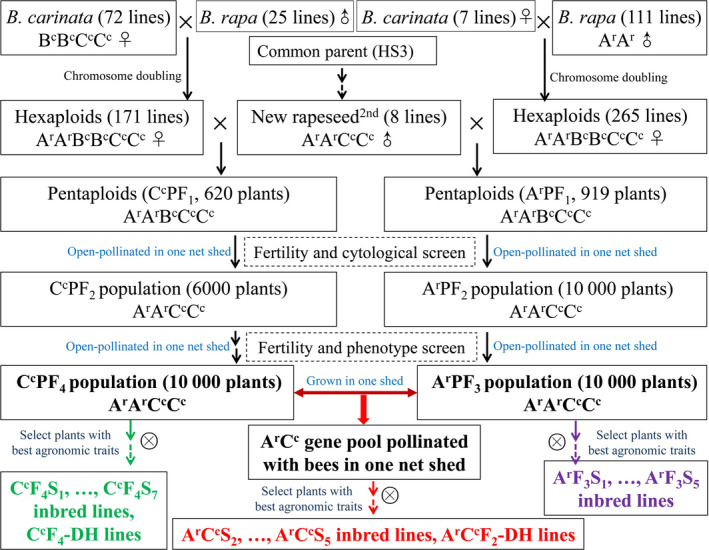
Construction of the novel inbred breeding population of Brassica napus diversified in both the A and C genomes. A total of 74 accessions of B. carinata and 122 accessions of B. rapa were involved in the gene pool, and five accessions of B. carinata and 13 accession of B. rapa were used in generation of both the Cc population and the Ar population.
Table 1.
Genetic differentiation within and between the new‐type Brassica napus and its parental species using a total of 37 473 polymorphic SNP markers
| Population | BnN | BnT | Br | Bc |
|---|---|---|---|---|
| BnN | 0.268a (0.001–0.401b) | 0.120 | 0.265 | 0.317 |
| BnT | 0.194 | 0.289 (0.002–0.483) | 0.305 | 0.364 |
| Br | 0.182 | 0.170 | 0.193 (0.138–0.224) | 0.613 |
| Bc | 0.290 | 0.280 | 0.239 | 0.036 (0.024–0.047) |
Genetic distance estimates appear below the diagonal and pairwise F ST above the diagonal (with grey backdrop).
The average genetic distance between the individuals within the population.
Numbers in brackets are the range of the genetic distance between the individuals within the population.
Four apparent genetic clusters were observed for each of the BnN, BnT, Br and Bc populations (Figure 2a). The first and second principal components explained more than 90% of the total genetic difference among the four populations (Figure 2b). There was substantial genetic distance and F ST between the new‐type B. napus and the other three subpopulations (B. rapa, B. carinata and traditional B. napus), while the new‐type B. napus showed less genetic distance to traditional B. napus than to B. rapa and B. carinata (Table 1). The F ST between BnN and BnT was twice as small as that between species (B. rapa and B. carinata). Substantial population differentiation was observed between the BnN and BnT populations, but the population differentiation within species was smaller than that between species, such as that between the BnN and Br/Bc populations (Table 1).
Figure 2.
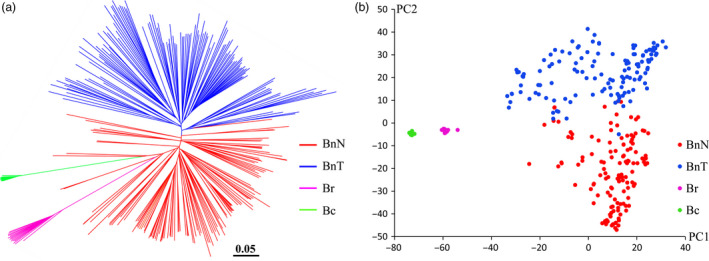
Genetic clustering of the new‐type Brassica napus lines and comparison with the parental species using a total of 37 473 polymorphic SNP markers. (a) Genetic clustering of the investigated Brassica accessions from the BnN (new‐type B. napus, 130 accessions), BnT (traditional B. napus, 130 accessions), Br (B. rapa, 15 accessions) and Bc (B. carinata, 14 accessions) populations based on the genetic distance. (b) PCA of the BnN, BnT, Br and Bc populations.
Breakage and reconstruction of linkage disequilibrium and haplotypes in the new‐type B. napus population
The pattern of LD in the new‐type B. napus population was analysed using a total of 19 112 SNPs with unique alignment positions to the reference genome, Darmor‐bzh, after filtering out the markers with >20% heterozygosity. In general, the LD pattern varied among chromosomes and subgenomes (Table 2). The A genome presented a much more rapid LD decay rate and shorter LD decay distance than the C genome (Figure 3a), and apparent reconstruction of LD was found in the new‐type B. napus population on some chromosomes, such as C02, C03 and C08 (Figures 3b and S1). Large LD blocks were consistently located in the B. napus centromere regions (Mason et al., 2016), particularly in C01, C04 and C07 (Figure S1), with similar results in both the BnN and BnT populations.
Table 2.
Summary of the linkage disequilibrium and haplotype blocks in the population of new‐type Brassica napus
| Chromosome | No. of SNPs | Mean r 2 | LD decay to half (Mb) | LD decay to 0.1 (Mb) | Number of haplotype blocks | Average number of haplotypes for each block (max) |
|---|---|---|---|---|---|---|
| A genome | ||||||
| A01 | 910 | 0.06 | 0.01–0.03 | 1.5–1.7 | 132 | 3.68 (9) |
| A02 | 684 | 0.08 | 0.01–0.03 | 1.5–1.7 | 93 | 4.14 (9) |
| A03 | 1265 | 0.05 | 0.01–0.03 | 1.5–1.7 | 207 | 3.73 (10) |
| A04 | 868 | 0.06 | 0.01–0.03 | 1.4–1.6 | 122 | 3.72 (9) |
| A05 | 974 | 0.05 | 0–0.02 | 1.1–1.3 | 149 | 3.81 (9) |
| A06 | 947 | 0.06 | 0.01–0.03 | 1.7–1.9 | 140 | 3.94 (9) |
| A07 | 1166 | 0.06 | 0–0.02 | 1.1–1.3 | 170 | 4.08 (17) |
| A08 | 717 | 0.11 | 0.02–0.04 | 4.7–4.9 | 97 | 4.18 (9) |
| A09 | 1002 | 0.08 | 0.19–0.25 | 2.4–2.6 | 126 | 3.92 (15) |
| A10 | 936 | 0.11 | 0.02–0.04 | 4.2–4.4 | 107 | 3.66 (10) |
| Mean | 946.90 | 0.07 | 0.02–0.05 | 2.11–2.31 | 134.3 | 3.89 (10.60) |
| Subtotal | 9469 | – | – | – | 1343 | – |
| C genome | ||||||
| C01 | 1658 | 0.27 | 3.90–4.10 | 7.9–9.0 | 78 | 3.95 (18) |
| C02 | 250 | 0.12 | 0.20–0.30 | 7.1–7.3 | 24 | 5.13 (11) |
| C03 | 1682 | 0.05 | 0.11–0.13 | 2.3–2.5 | 143 | 3.91 (13) |
| C04 | 2215 | 0.22 | 2.90–3.10 | 5.8–6.0 | 101 | 3.56 (10) |
| C05 | 603 | 0.09 | 0.09–0.11 | 1.8–2.0 | 69 | 3.41 (13) |
| C06 | 780 | 0.07 | 0.08–0.10 | 3.1–3.3 | 74 | 3.84 (9) |
| C07 | 1112 | 0.11 | 0.20–0.30 | 6.2–6.4 | 113 | 3.64 (17) |
| C08 | 730 | 0.08 | 0.03–0.05 | 2.7–2.9 | 77 | 4.32 (10) |
| C09 | 613 | 0.08 | 0.18–0.20 | 2.2–2.4 | 51 | 3.75 (8) |
| Mean | 1071.44 | 0.12 | 0.85–0.93 | 4.34–4.64 | 81.11 | 3.95 (12.11) |
| Subtotal | 9643 | – | – | – | 730 | – |
| Whole genome | ||||||
| Mean | 1005.89 | 0.10 | 0.42–0.47 | 3.17–3.42 | 107.71 | 3.92 (11.36) |
| Total | 19 112 | – | – | – | 2073 | – |
Figure 3.
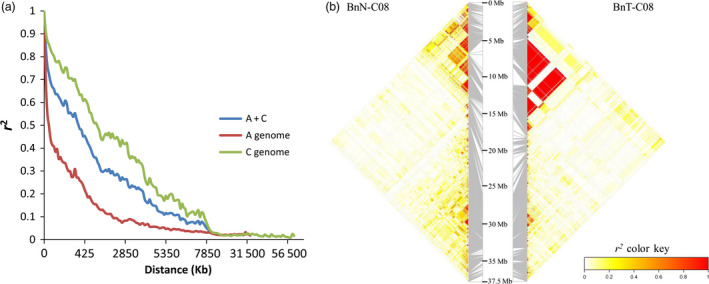
The pattern of LD decay in the new‐type Brassica napus population. (a) LD decay distance in the new‐type B. napus population. (b) Broken and reconstructed LD patterns on chromosome C08 in the BnN (new‐type B. napus population) compared with BnT (traditional B. napus). The strong LD blocks in BnT located from 5.47 to 12.25 Mb were reconstructed as several small, weak LD blocks in the BnN population.
A total of 2073 conserved haplotype blocks were detected in the new‐type B. napus population, spanning 248 Mb or 38.7% of the assembled reference genome of B. napus (Figure S2). More haplotype blocks were identified in the A genome, but with smaller average size than in the C genome (Table 2 and Figure S2), which is the same trend as that found in traditional B. napus. In general, the large haplotype blocks also exhibited strong LD (Figure S1). The haplotype blocks varied between the two populations: approximately two‐thirds of the haplotype blocks >50 kb in size identified in the BnN population were reconfigured, including formation of new blocks and breakage of old blocks relative to the BnT population (Table S4). For example, two haplotype blocks in A01 and C08 that covered the centromere region were detected specifically in the BnN population, while 22.4% of the haplotype blocks identified in the BnT population were not present in the BnN population (Figure S1).
Introgression and identity by descent (IBD) of original parents in the new‐type B. napus population
Multiple accessions of B. rapa and B. carinata were involved in breeding new‐type B. napus (Figure 1). However, the original parental B. napus, Huashuang 3 (HS3), was the only B. napus parent of the eight‐second‐generation new‐type B. napus lines that were crossed to produce the pentaploids at the start of the current breeding programme. Therefore, HS3 was used as the major control to estimate parental introgression and IBD within the new‐type B. napus population. By calculating the average allele frequency for each polymorphic marker within the BnN population that originated from HS3 or from the parental B. rapa and B. carinata accessions we genotyped, it was estimated that approximately 88.4% of the genome on average was replaced with novel introgressions that were different from the parental B. napus HS3, and very few IBD originating from HS3 in 12 lines (about 9.2%). Approximately, the whole genome of new‐type B. napus was reconstructed, with little remaining from the original B. napus parent HS3 (Figure S3, Table S5).
Putative deletions and duplications in the new‐type B. napus population
It was expected that a high number of missing values for considerable markers would be observed in the BnN population, resulting from either exotic introgressions or novel induced variations (such as deletion–duplication events). As expected, we found that 6085 markers presented more than 20% of missing values, even to 100%, across certain regions and especially in the C genome in the BnN population. Thus, using the previously established marker filtering parameters (we initially excluded all markers with more than 20% missing values to estimate population diversity and differentiation compared with the BnT population) would lose many markers involved in novel variation induced in the BnN population, such as deletion events (Table S3). Therefore, we revisited AC markers with unique genomic positions to include those with a high rate of missing values. Finally, a total of 27 506 markers were selected by GSRC for genome structural rearrangement analysis of the BnN population, and its original parental B. napus, HS3, as a control. Of these, 39.8% (10 945) were found to be involved in deletion and duplication events in at least one individual of the BnN population, of which a predominance (9935) of the markers were involved with deletions. For the markers with deletion signals, 0.57% of the markers located in the A genome were absent in B. rapa and 2.55% of the markers located in the C genome were absent in B. carinata. Of the 10 945 total markers, 38.3% and 61.3% were located in the A and C genomes, respectively, which were assigned to a total of 406 and 380 genomic regions covering 26.0% and 42.8% of the A and C genomes, respectively (Figure 4). The average size of duplication/deletion events in the C genome was three times that of duplication/deletion events observed in the A genome. Additionally, chromosomes A01, A02, A05 and A09 had larger deletions and duplication blocks than the other six A‐genome chromosomes, while there was not obvious variation between different C‐genome chromosomes. However, in HS3, a very few (65) deletion/duplication events covering 6.2 Mb were detected, 35 of which (covering 1.8 Mb) overlapped with those detected in the BnN population (Figure 4).
Figure 4.
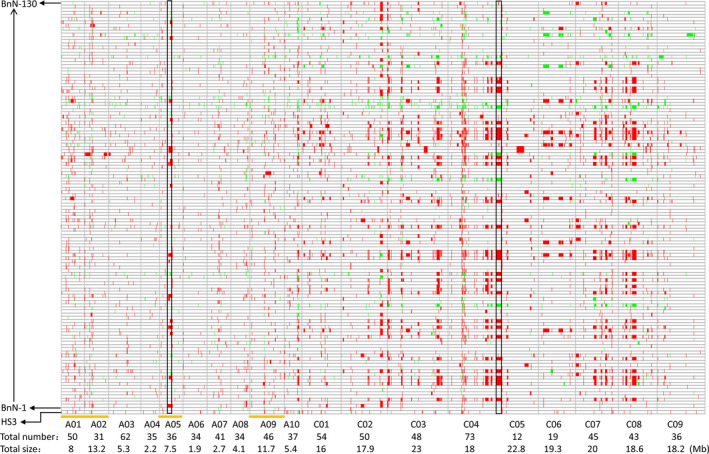
Putative deletions and duplications detected within the population of new‐type Brassica napus and HS3. The vertical coordinates represent 130 lines of new‐type B. napus and their B. napus parent, HS3, and the horizontal axis shows 19 chromosomes. Red and green colours represent deletions and duplications, respectively, across the genome of new‐type B. napus. Black borders indicate two big deletion blocks in A05 and C05, respectively. Orange lines shows chromosomes A01, A02, A05 and A09 that had larger deletions/duplication blocks than the other A‐genome chromosomes. The total number and size of the deletion/duplication events of each chromosome are shown underneath each chromosome label.
In the putative regions with deletion/duplication events, a total of 453 regions (202 regions in the A genome and 251 regions in the C genome) were large blocks above 50 kb, averaging 538 kb in size and with some regions appearing in up to 30% of the 130 lines (Table S6). For example, a deletion identified in A05 covering 4.8 Mb from physical position 9 606 923 to 14 487 472 bp was present in 3% of lines and a deletion identified in C05 covered 6.8 Mb from physical position 44 364 to 6 852 090 bp and was found in 20.8% of lines (Figure 4). Deletions were identified more often than duplications for the same regions within the population. For example, 30 lines had 4.21 Mb deletion events in C08 from physical position 15 465 176 to 19 679 933 bp, while only four lines showed duplication events in the same region. In general, the duplication/deletion events were frequently detected in noncentromeric regions. However, a few putative deletion/duplications also occurred in the centromeric regions. For instance, a 7.4‐Mb deletion/duplication region detected in C06 from physical position 4 986 118 to 12 387 447 bp was across the centromere region (8.0–8.4 Mb).
Genomewide selection signals in the new‐type B. napus population
A sliding‐window approach (100‐kb windows sliding in 10‐kb steps) was applied to quantify the polymorphism levels (θπ), genetic differentiation (F ST) and selection statistics (Tajima's D) within the new‐type B. napus lines and between the new‐type B. napus and traditional B. napus lines. Whole‐genome coverage was provided by all markers over 28 295 windows. In the new‐type B. napus population, Tajima's D values for 2424 windows was negative, whereas only 20 windows were negative in traditional B. napus. The average Tajima's D value of the new‐type B. napus (0.96) was much lower than that of the traditional B. napus (1.74), which suggests genetic bottlenecks in traditional B. napus, consistent with previous reports.
A total of 15 regions (corresponding to 134 windows) with strong selective sweeps were identified in the new‐type B. napus population and distributed on seven chromosomes (A03, A05, A08, A09, A10, C03 and C08) covering 2.74 Mb (Table S7, Figure 5a,c). Furthermore, 112 additional putative selected regions were detected across all 19 chromosomes, covering 16.34 Mb (Table S7, Figure 5b,c). In general, more and larger selected regions were detected in the C genome (75 regions covering 12.48 Mb) than in the A genome (52 regions covering 6.60 Mb) (Table S7). For traditional B. napus, a total of 46 regions (corresponding to 297 windows) with strong selective sweeps were identified and distributed on ten chromosomes (A01, A02, A03, A09, A10, C01, C03, C05, C07 and C09) covering 7.26 Mb; one putative selected region was detected and involved in the regions with strong selective sweeps (Figure 5a, Table S7). In traditional B. napus, more and larger selected regions were detected in the C genome (38 regions covering 6.13 Mb) than in the A genome (eight regions covering 1.13 Mb), a similar trend as in new‐type B. napus, but the selected regions were different compared to those of new‐type B. napus.
Figure 5.
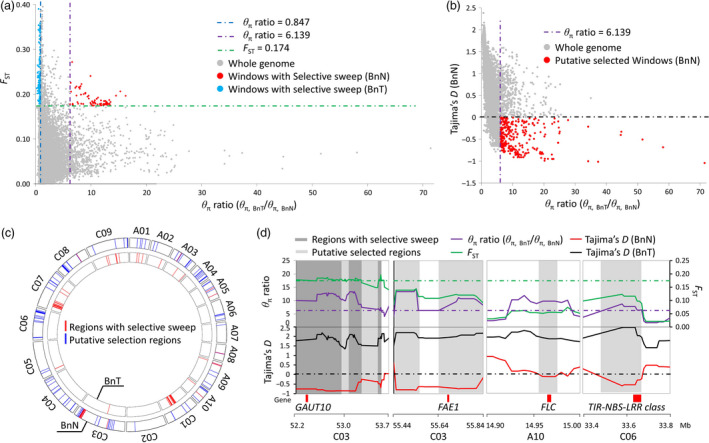
Genomic regions with selective signals in new‐type Brassica napus (BnN). (a) The distribution of θπ ratios (θπ, BnT/θπ, BnN) and F ST values, calculated in 100‐kb windows sliding in 10‐kb steps. Dots located to the right of the purple dashed lines (the 5% rightmost tail of the θπ ratios distribution) and above the green dashed line (the 5% rightmost tail of the F ST values distribution, where F ST is 0.174) were identified as regions with selective sweeps in the BnN population. Blue dots located to the left of the blue dashed lines (the 5% leftmost tail of the θπ ratios distribution) and above the green dashed line (the 5% rightmost tail of the F ST values distribution, where F ST is 0.174) were identified as regions with selective sweeps in the BnT population. (b) The distribution of selection statistics (Tajima's D) and θπ ratios (θπ, BnT/θπ, BnN) of the new‐type B. napus. Data points located to the right of the purple dashed lines (the 5% rightmost tail of the θπ ratio distribution) and below the black dashed line (Tajima's D value is 0) were defined as putative selected regions in the BnN population (red points). (c) The distribution of genomic regions with selective signals. The inner and external circles show the BnN population and the BnT population, respectively. Red bars and blue bars represent the regions with selective sweeps and putative selection regions, respectively. (d) Examples of genes within selective sweeps in the new‐type B. napus population (BnN). Genomic regions with F ST values above the green horizontal dashed line (corresponding to a 5% significance level of F ST values) and θπ ratios above the purple horizontal dashed line (a 5% significance level of the θπ ratio) were classed as selective sweep regions in BnN population (deep gray regions). Genomic regions with θπ ratios above the purple horizontal dashed line and negative Tajima's D values were classed as putative selected regions for BnN population (gray regions). Genome annotations are shown at the bottom (red bar, genes).
In the selected regions of new‐type B. napus, candidate genes and quantitative trait loci (QTL) associated with seed quality traits and important agronomic traits in B. napus were observed. For instance, BnaC.FAE1 (chromosome C03) is known to be associated with erucic acid content (Korber et al., 2016), GAUT10 (chromosome C03) is associated with neutral detergent fibre concentration in seed (negatively correlated with oil concentration) (Li et al., 2014a) and FLC (chromosome A10) and CO (chromosome C09) were known to control flowering time. Nine genes on chromosome C06 were found to code for disease resistance proteins (TIR‐NBS‐LRR class) (Figure 5c), and QTL qDT50 (A05) and qDT52 (A05) for seed development rate (Luo et al., 2017) were found within or close to the selected regions. Of these regions (15 + 112), 39.4% (6.3 Mb) were involved with large haplotype blocks with strong LD and 37% (6.1 Mb) were involved with deletion/duplication events. For example, the selected regions containing the FAE1 gene on chromosome C03 were located in a region showing strong LD with a large haplotype block; however, in this region, frequent duplication/deletion events also occurred (deletions observed in 31 lines, duplications observed in five lines). The FAE1 gene was associated with erucic acid content, and this trait was extensively screened and selected for during the development of the new‐type B. napus population. The B. rapa parent also showed a deletion in this region. Even though we could not judge whether this results from a specific exotic introgression from B. rapa or is an actual deletion resulting from homoeologous exchange, this was a clear example of structural variation fixed in the new‐type B. napus population with strong selective sweep signals.
Discussion
In this study, we investigated the genetic diversity and uniqueness of a novel breeding population of B. napus developed from hundreds of interspecific crosses involving 74 accessions of B. carinata and 122 accessions of B. rapa (Figure 1) using the Illumina Infinium Brassica 60K SNP array. As the Illumina Infinium Brassica 60K SNP array was developed based on polymorphisms within B. napus, much of the specific polymorphism present in the parental B. rapa and B. carinata lines would not be detectable. Therefore, the genetic diversity of the new‐type B. napus population would likely have been underestimated in terms of introgression of Ar, Bc and Cc polymorphism. Despite this, this ‘new‐type’ B. napus population still presented comparable genetic diversity to the internationally representative germplasm set of 130 traditional B. napus accessions used in this study (Xu et al., 2016), as assessed by the number of polymorphic markers, PIC and genetic distance within the population (Tables S3 and 1). These results indicate that the rich genetic diversity present within the newly resynthesized population is comparable to the gene pool of traditional B. napus, the latter of which has undergone decades of breeding efforts. Meanwhile, the new‐type B. napus population presented obvious differences to the population of traditional B. napus, as well as to B. rapa and B. carinata, as revealed by F ST values, genetic clustering and principle component analysis (Tables 1 and 2, Figure 2).
Compared to the single parental cultivar of B. napus involved in the pedigree of new‐type B. napus, HS3, nearly the whole genome of individuals in the new‐type B. napus has been changed (Figure S3, Table S5). In total, 88.4% of the genome was changed or reconstructed via exotic introgressions from B. rapa and B. carinata and by novel genetic changes, such as frequent putative deletions and duplications covering 25.95% of the genome, even including some centromeric regions. Thus, we observed obvious changes in LD pattern and haplotype blocks in both the A and C genomes (Figures 3, S1 and S2). The reconstructed LD and haplotype patterns may also have resulted from novel allelic combinations. The C subgenome of B. napus in particular has very slow LD decay and limited genetic diversity; as such, its genetic basis needs to be improved (Qian et al., 2014; Wang et al., 2014). B. carinata, one of the founder parent species of new‐type B. napus population, shows a very fast LD decay in C genome compared to traditional B. napus, as reported by Liu et al. (2016) and Zhang et al. (2017). This may explain the shorter distance when r 2 drops to half in the new‐type B. napus population. On the other hand, extensive pan‐genomic variation may exist in the presently analyzed populations which may not be visible when using markers aligned to the reference genome Darmor‐bzh: a great deal of genomic variation and recombination may be undetectable when using only Darmor‐bzh as a reference. This limitation may also impact the estimation of the LD and IBD. In future studies, with the availability of more genomic resources, deep analyses of these populations could be better performed based on pan‐genomic comparisons.
Previous research showed that interspecific hybridization can not only introduce exogenous variation but can also rapidly change the genome via as increased chromosome recombination (Nicolas et al., 2012; Pontes et al., 2004), loss and/or gain of parental DNA fragments and appearance of novel genetic variation (Song et al., 1995). In our study, with intensive recombination and hundreds of interspecific crosses, a great number of novel genomic changes were induced in the C subgenome (Figure 4), including frequent deletion/duplications, altered and shorter LD decay lengths, broken LD blocks and changed haplotype blocks, which together demonstrate the efficacy of our approach in inducing novel genetic variation in the C genome. Regions that still showed strong LD similar to that observed in traditional B. napus may indicate areas of limited recombination, either due to the same genomic factors inhibiting recombination in B. napus, or due to some form of linkage drag. More recombination may be further introduced to break the LD blocks in the new‐type B. napus. As well, changed haplotype or LD blocks in the new‐type B. napus population that differ from those in the traditional B. napus population may be significant for promoting intersubgenomic heterosis or trait improvement when crosses are made between these two populations.
With respect to the deletion/duplication events detected in the new‐type B. napus lines, these were labelled as ‘putative deletion/duplication’ events, especially with regard to the deletions, as these could have resulted from homoeologous exchanges coupled with segregation. These regions could also appear to be ‘missing’ because of poor primer binding due to sequence divergence in these regions, resulting from specific exotic introgression segments from the Ar and Cc subgenomes, as well as the absence of the alignment to the reference genome due to pan genome variation. A number of markers with deletions (0.55% in the A genome and 28.59% in the C genome) were also found to be missing in B. rapa and B. carinata, respectively, which may indicate specific exotic introgressions. However, we could not conclusively determine whether these events in the new‐type B. napus population were due to inheritance, because not all parental B. rapa and B. carinata accessions could be genotyped: more in‐depth analysis could be performed after appropriate genotyping of all the parents. In general, novel genomic variation occurred much more frequently in the C genome than in the A genome, and homoeologous exchanges from A to C were more frequent than from C to A, as was previously found in resynthesized and natural B. napus (Chalhoub et al., 2014; Schmutzer et al., 2015). It may also indicate that the subgenomic variation between Cc and Cn was much more than that between Ar and An. As a result, many much more missing segments were detected in the C genome of the new‐type B. napus. Certain novel genomic variants, whether due to exotic introgressions or due to induced novel structural variation, may occur preferentially and hence be detected at higher frequencies. On the other hand, the overlap with selected regions in advanced generation lines of the new‐type B. napus suggests that fixation of particular novel genetic variants may be under selection, and hence be beneficial for genome stability and rapid adaptation of synthetic Brassica lines and interspecific hybrid progeny. Thus, these ‘new‐type’ lines could comprise a good material for understanding the rapid genome evolution of B. napus, as well as useful bridge materials for creating new germplasm to bring novel diversity and broken linkage disequilibrium blocks into B. napus.
New‐type B. napus, which was bred by hundreds of interspecific crosses and intensive selection over several years, has an extremely short breeding history compared to natural B. napus. Unsurprisingly, the offspring derived from interspecific crosses in the early generations usually had poor fertility and agronomic traits. After intensive selection and recombination, elite alleles and genotypes were fixed, restoring good fertility and stable genomes in the new‐type B. napus. This process would putatively result in strong selective sweeps, indicating associations with important agronomic traits, fertility and genome stability. By analysing the genetic diversity within the new‐type B. napus population and comparing it to the traditional B. napus population, this study detected 15 genomic regions showing strong signals of selective sweeps, as well as 112 additional regions with weaker (potential) selective sweeps (Table S7). In these regions, we found genes associated with important traits that were targeted during the process of constructing the new‐type B. napus, such as low erucic acid, appropriate flowering time for semi‐winter environments, disease resistance and other traits of interest (Figure 5). For example, we performed strong selection on seed quality traits of the new‐type B. napus, and most lines were subsequently found to have a very low concentration of erucic acid (Table S2). Regions with selective sweeps may also be associated with fertility and genome stability, but to date, little is known about the underlying genetic factors contributing to these traits in Brassica interspecific hybrids.
Differentiation between new‐type B. napus and traditional B. napus was smaller than that observed between species, suggesting that new‐type B. napus lines may be readily utilized as a novel gene pool to cross with the traditional gene pool for heterosis breeding. During the selection of new‐type B. napus, we found several novel agronomic traits of interest. For example, several lines had high seed weight from the primary results: the 1000‐seed weights of lines BnN‐9 and BnN‐22 were 5.23 ± 0.21 and 5.25 ± 0.05, respectively, when grown in Wuhan, China (semi‐winter growth environment) in 2013–2014 (Table S2). Other favourable traits such as high linoleic acid content (28.87%), high linolenic acid content (13.30%) (Table S2), shattering resistance and disease resistance have also been observed in this novel gene pool (unpublished), but need further statistical validation in additional field trials in future studies to confirm and obtain complete data.
In our study, it is likely that we significantly underestimated the degree of novel variation resulting from exotic introgressions and structural variation present in the new‐type B. napus lines as a result of genotyping using the Illumina Infinium 60K Brassica array. This is because SNPs on this array were designed solely to be polymorphic within traditional B. napus accessions (Clarke et al., 2016). Thus, much of the subgenomic variation between the Ar and Cc genomes and the AnCn genomes is expected to be underrepresented. This also applies to the subgenomic variation between different parental accessions of the B. rapa and B. carinata. Additionally, it is not possible to detect either chromosomal inversions or balanced reciprocal translocation events using SNP markers in this population, and these events are likely to have occurred. We also could not assess whether B genome introgression from the B. carinata parent due to A/B or B/C homoeologous exchanges had occurred using the array, and the new Brassica 90K Illumina Infinium SNP array containing A/B/C genome markers, as well as the availability of a complete B. carinata reference genome (Parkin I.A.P., personal communication) would advance the work effectively. Therefore, deeper analyses of the genomic structural variation present in this population using more sophisticated sequencing methods would be desirable. In the future, we hope to build on this understanding of how novel genomic alterations occur with substantial exotic genome introgressions and to assess how deeply these impact agronomic traits, especially seed yield traits, and to explore heterosis breeding using these novel Brassica polyploids.
Materials and methods
The development of the new‐type B. napus lines used in this study
In our previous study, third‐generation lines of new‐type B. napus (abbreviated as BnN in this study) were developed from hundreds of interspecific crosses involving 74 accessions of B. carinata and 122 accessions of B. rapa (Figure 1) (Xiao et al., 2010; unpublished data). First, 171 successful hexaploid combinations involving 72 B. carinata and 25 B. rapa accessions as the original parents were crossed with eight selected lines of second‐generation new‐type B. napus (selected for ~75% exotic subgenome introgression and double low seed quality) to obtain pentaploids (AABCC) (Xiao et al., 2010). One Chinese B. napus cultivar with double‐low seed quality traits, HS3, which was bred with introgressions from B. rapa, was involved as an common parent of second‐generation new‐type B. napus and was therefore designated the common parent of the third‐generation lines. At the start of the project, all the pentaploid plants were grown in one net shed with open pollination, and seeds were harvested and re‐sown up until the F4 generation to encourage full recombination among the lines. In the F2 generation, the plants with B. carinata/B. rapa morphological phenotype and very low fertility (most likely aneuploids) were eliminated, then the chromosome number of remaining F2 plants were counted through cytological observation, such that only the plants with 38 chromosomes were selected to yield the F3 generation. From the F3 generation, only phenotypic selection was performed to select plants with high fertility (particularly seed number), B. napus morphological phenotypes, best resistances to field‐based pathogens and lowest glucosinolate and erucic acid content in each generation. This population was designated the new‐type B. napus Cc population, and the construction and selection of lines in this population was elaborated on Xiao et al. (2010). From the F4 generation, the plants in the new‐type B. napus Cc population with the best performance were self‐pollinated by single seed descent for seven generations to generate inbred lines (Figure 1; in green). These lines are subsequently referred to as CcF4S7 inbred lines. The best plants in the F4 generation were also selected for rapid purification by microspore culture and are subsequently referred to as CcF4‐DH lines.
Using the same synthesis strategy as for the Cc population (which contained diverse Cc genome introgressions from 72 starting B. carinata accessions), a total of 265 hexaploid combinations from seven B. carinata (five of which were also used for the synthesis of the Cc population) and 111 B. rapa accessions (13 of which were also used for the synthesis of the Cc population) were crossed with the same eight selected lines of second‐generation new‐type B. napus to generate pentaploids followed by selection and open pollination in a single net shed to the F3 generation. This population was subsequently designated the new‐type B. napus Ar population (containing diverse Ar genome introgressions from 111 B. rapa accessions). Selected lines from the F3 generation of the Ar population were inbred for five generations and are subsequently referred to as ArF3S5 inbred lines (Figure 1; in purple); microspore culture has not yet been carried out on this material.
For the construction of new‐type B. napus, our objective was to combine the Ar and Cc populations to produce a diverse ArCc gene pool (Figure 1; in red). Therefore, we grew the CcF4 population together with the ArF3 population in one large net shed with two rows for each line and a ratio of 1:1 for plants from each population (unpublished). During the flowering period, bees were put in the net shed to assist in open pollination. Phenotypic screening was also performed for each generation from the seedling stage to harvest. The best lines were selected out of the net shed based on selection for agronomic traits (higher seed number, high seed weight), seed quality (lower glucosinolate content and erucic acid content and higher oil content) and environmental adaptability (suitable flowering time, disease resistance and lodging resistance). From the F3 generation, lines selected from the ArCc gene pool were self‐pollinated by single seed descent for five generations to generate inbred lines. Those lines are subsequently referred to as ArCcS2–ArCcS5 inbred lines. The best F2 generation plants were also selected for rapid purification by microspore culture and are subsequently referred to as ArCcF2‐DH lines.
In this study, a total of 130 new‐type B. napus lines (coded BnN‐1 to BnN‐130) were investigated, including 10 CcF4S5 inbred lines, 88 CcF4S6 inbred lines, 13 CcF4S7 inbred lines, seven CcF4‐DH lines, seven ArF3S5 inbred lines, four ArCcS5 inbred lines and one ArCcF2‐DH line (Table S2). As the development and selection of the Cc population started earlier than that of the Ar population and ArCc genepool, more inbred lines from the Cc population were available for genotyping in this study. These lines were developed, selected in the field at Huazhong Agricultural University, Wuhan (semi‐winter growth environment), China, with the same instruments and evaluation methods as described in Xiao et al. (2010). To evaluate their phenotype, these lines were planted in Wuhan, China in 2013–2014. Plots for each line were planted in one row with three replicates, with a distance of 30 cm between rows and 15 cm between individuals. Seed quality traits, thousand seed weight and flowering time (the time that 50% of the individuals in the plot were flowering) were tested. Oil content, erucic acid content and glucosinolate content were tested by Foss NIR Systems 5000 using the near‐infrared spectroscopy (NIR) method (Gan et al., 2003), and linolenic acid content, linoleic acid content and oleic acid content were tested by NIRS and gas chromatography.
Representative lines of the parental species of the new‐type B. napus used as controls in this study
Fifteen B. rapa accessions (coded Br‐1 to Br‐15, 11 of which were used for the synthesis of new‐type B. napus) and 14 B. carinata accessions (coded Bc‐1 to Bc‐14, 10 of which were used for the synthesis of new‐type B. napus) were genotyped as controls using the Illumina Infinium 60K Brassica SNP array (Table S2). Most were parents of the new‐type B. napus lines, including the B. napus cultivar HS3 (Qian et al., 2014) as the original B. napus parent, and were therefore included as controls for comparison in this study.
The same number (130 accessions) of traditional B. napus (Table S2) were collected from different regions of China, France, Germany, Poland, Denmark, Canada, Korea, Japan and Australia, representing different genetic branches of B. napus (Xu et al., 2016). They were also used as controls in this study for comparison with the new‐type B. napus and were coded BnT‐1 to BnT‐130 (Table S2).
DNA extraction, SNP genotyping, physical positioning of the SNP markers and marker filtering
Genomic DNA from the 130 inbred lines of new‐type B. napus, three lines of traditional B. napus (BnT128, BnT129 and BnT130) not used in Xu et al. (2016) and the accessions of B. rapa and B. carinata were extracted from bulked young leaf tissue using a DNA extraction Kit (NuClean Plant Genomic DNA Kit, ComWin, CW0531) (Table S2). These lines were genotyped at Huazhong Agricultural University using the Brassica 60K Illumina Infinium SNP arrays according to the manufacturer's protocol (Illumina Inc., San Diego, CA, http://www.illumina.com/) followed by clustering, quality control and data calling using the GenomeStudio software (Illumina Inc.), as described in previous studies (Liu et al., 2016; Xu et al., 2016). The genotypes of 127 traditional B. napus were obtained from Xu et al. (2016).
The physical position of each SNP marker was assigned according to the top BLAST hits for the probe sequences of each SNP in the array against the reference genome of B. napus ‘Darmor‐bzh’(version 4.1) (Chalhoub et al., 2014) by BlastN using an e‐value threshold of e −10 (Altschul et al., 1990). BLAST matches to multiple loci with the same top e‐value were considered to have multiple positions and classed as unassigned markers without unique positions on the reference genome (Liu et al., 2016).
In our study, we used the Brassica 60K Illumina Infinium SNP array, which was designed for genotyping cultivars with A/C genomes. However, B. rapa and B. carinata have only an A genome and only a C genome, respectively, not both, and variation between the B. rapa and B. carinata A and C genomes and the B. napus genome for which the array was designed means that not all markers on the array were successfully amplified in B. rapa and B. carinata. Consequently, a high rate of missing values for the accessions of B. rapa (average 42.8%) and B. carinata (average 31.6%) was generated. Therefore, we ignored the percentage of missing values in these species for calculation. All of the other investigated samples should have less than 15% missing values in general across all SNPs (the whole 52 157 markers). Considering the potential for actual missing chromosome segments and heterozygosity in new‐type B. napus, we first filtered those markers with ≥20% missing values in the subpopulations of new‐type B. napus and traditional B. napus. Subsequently, we calculated the gene diversity, genetic distance, genetic clustering and F ST within and between the subpopulations of new‐type B. napus (BnN), traditional B. napus (BnT), B. rapa (Br), B. carinata (Bc) and the parental B. napus cultivar of new‐type B. napus, HS3. For the LD and haplotype block analysis, we further filtered out those makers with minor allele frequency (MAF) ≤5%, more than 20% heterozygosity, and only used markers with unique positions on the A and C genomes of B. napus as determined by BLAST analysis following the methods of Liu et al. (2016) and Qian et al. (2014). This approach allowed us to compare the LD and haplotype results from new‐type B. napus with that of traditional B. napus by establishing similar filtering parameters.
Genetic diversity, genetic distance, F ST and population structure analysis
The polymorphism information content (PIC) and genetic diversity of the SNP markers, Nei's genetic distance (Nei and Takezaki, 1983) and F ST within and among the populations were estimated using the software PowerMarker Version 3.25 (Liu and Muse, 2005) and Arlequin ver. 3.5.1.2 (Excoffier et al., 2007). The cluster dendrogram of the relationships between investigated lines/accessions was constructed using MEGA version 6 (Tamura et al., 2013) with the genetic distance matrix. Principal component analysis (PCA) was performed with Tassel version 5 (Bradbury et al., 2007).
Linkage disequilibrium and haplotype block analysis
The pattern of linkage disequilibrium (LD) on each chromosome and across the A and C subgenome was estimated based on the parameter r 2 of all pairwise‐filtered SNPs with unique physical positions and were calculated using the software TASSEL version 5 (Bradbury et al., 2007). Heterozygous SNPs were set as missing. LD decay of the new‐type B. napus population was estimated based on the corresponding physical distance of pairwise SNPs with the value of r 2 decreased to half of the maximum, 0.2 and 0.1, and compared with the results of traditional B. napus (Liu et al., 2016). The same marker data set for LD analysis was used for analysing the haplotype block structure across the population by Haploview v4.2 (Barrett et al., 2005). Haplotype blocks were defined according to ‘strong LD’ with an upper 95% confidence bound of D’ above 0.70–0.98 (Gabriel et al., 2002; Qian et al., 2014; Sun et al., 2016). Haplotype blocks of the new‐type B. napus population were defined based on the same methods and compared with those of traditional B. napus reported in Sun et al. (2016).
Detection of identity by descent and introgressions originating from the original parents of the new‐type B. napus lines
Considering the specific genetic diversity of B. rapa and B. carinata, we used the whole marker data set filtered for genetic diversity analysis to estimate exotic introgressions in the new‐type B. napus lines. Exotic introgressions in each line of new‐type B. napus were estimated according to the average possibility that the alleles originated from the parents across the genome (Zou et al., 2010). Using markers with unique physical positions on the AC genome from BLAST analysis, we analysed the identity by descent (IBD) of each chromosome inherited from the original B. napus parent HS3, parental B. rapa and B. carinata accessions in the genome of new‐type B. napus, using the software fastIBD (Beagle version 4.0) with a P value (E) < 10−9 for linked markers (Browning and Browning, 2011).
Detection of deletions and duplications in the new‐type B. napus genomes
According to the normalized ratio of the fluorescence intensity of the hybridization signals for each of the markers on the SNP array chip, the regions of putative deletion and duplication were determined according to the method described in Grandke et al. (2016) using the R package GSRC 1.04 (Genome Structure Rearrangement Calling in Genomes with High Synteny) and the markers with unique positions on the A and C genomes of B. napus. We also analysed putative deletion/duplication events by identifying regions with contiguous missing markers (with at least five markers used as the cut‐off to identify a deletion/duplication).
Selective sweep analysis
The nucleotide diversity of the markers in the new type B. napus lines and traditional B. napus lines were calculated using TASSEL version 5 (Bradbury et al., 2007). Estimation of the SNP and population‐specific F ST was based on the pure drift model (Nicholson et al., 2002), following the procedure described by Porto‐Neto et al. (2013). Selection statistics (Tajima's D, a measure of selection in the genome) was calculated using the software TASSEL version 5 (Bradbury et al., 2007). A sliding‐window approach (100‐kb windows sliding in 10‐kb steps) was applied to quantify the polymorphism levels (θπ, pairwise nucleotide variation as a measure of variability), genetic differentiation (F ST) and selection statistics (Tajima's D) of the new‐type B. napus and traditional B. napus. The mean was set as zero when the 100‐kb windows contained <3 SNP markers. Finally, to detect regions with significant signatures of selective sweeps in the new‐type B. napus, the distribution of the θπ ratios (θπ, BnT/θπ, BnN) and F ST values between the two populations (the new‐type B. napus and traditional B. napus), as well as Tajima's D values in the new‐type B. napus lines, was considered simultaneously. The regions with significantly high θπ ratios (the 5% right tail) and significantly high F ST values (the 5% right tail) of the empirical distribution were treated as regions with strong selective sweeps in the new‐type B. napus (Li et al., 2013). The regions with significantly high θπ ratios (the 5% right tails) of the empirical distribution and negative Tajima's D values were treated as putatively selected regions in the new‐type B. napus.
Author contributions
JZ and DDH performed the research, analysed the data and wrote the manuscript; ASM, XQS, XHW, NW, FG, RJS and JLM contributed to methods and tools. MW and SHC contributed to plant growth and phenotyping. JLM contributed to plant materials. JZ designed the research. All authors revised, read and approved the final manuscript.
Competing interests
The authors declare that they have no competing interests.
Supporting information
Figure S1 Linkage disequilibrium and haplotype blocks of the new‐type Brassica napus population across the whole genome, and its comparison with traditional Brassica napus.
Figure S2 Distribution of the haplotype blocks in the new‐type Brassica napus population.
Figure S3 Distribution of identity‐by‐descent blocks (IBD) originating from the parents of the new‐type Brassica napus population.
Table S1 Name and geographical origin of parental lines involved in the development of the new‐type B. napus.
Table S2 New‐type Brassica napus lines and accessions of the parental species investigated in this study and their characteristics.
Table S3 Polymorphism within and among the population of new‐type Brassica napus and its parental species as evaluated by the Illumina Infinium Brassica 60K SNP array.
Table S4 Haplotype blocks >50 kb identified in the new‐type Brassica napus and traditional Brassica napus populations.
Table S5 Identity‐by‐descent (IBD) segments originating from Brassica napus ‘HS3’ within the new‐type Brassica napus population.
Table S6 Deletion and duplication regions >50 kb in size in the new‐type Brassica napus population.
Table S7 Selected regions identified in the population of new‐type Brassica napus and traditional Brassica napus.
Acknowledgements
The authors are grateful to Dr. Bin Yi for providing the genotypes of traditional B. napus and technical help on the SNP array. This work was supported by the National Key Research and Development Program of China (no. 2016YFD0100305 and 2016YFD0101300) and DFG Emmy Noether grant MA6473/1‐1.
References
- Abbott, R.J. (1992) Plant invasions, interspecific hybridization and the evolution of new plant taxa. Trends Ecol. Evol. 7, 401–405. [DOI] [PubMed] [Google Scholar]
- Adams, K.L. , Percifield, R. and Wendel, J.F. (2004) Organ‐specific silencing of duplicated genes in a newly synthesized cotton allotetraploid. Genetics, 168, 2217–2226. [DOI] [PMC free article] [PubMed] [Google Scholar]
- Altschul, S.F. , Gish, W. , Miller, W. , Myers, E.W. and Lipman, D.J. (1990) Basic local alignment search tool. J. Mol. Biol. 215, 403–410. [DOI] [PubMed] [Google Scholar]
- Barrett, J.C. , Fry, B. , Maller, J. and Daly, M.J. (2005) Haploview: analysis and visualization of LD and haplotype maps. Bioinformatics, 21, 263–265. [DOI] [PubMed] [Google Scholar]
- Becker, H.C. , Engqvist, G.M. and Karlsson, B. (1995) Comparison of rapeseed cultivars and resynthesized lines based on allozyme and RFLP markers. Theor. Appl. Genet. 91, 62–67. [DOI] [PubMed] [Google Scholar]
- Bomblies, K. (2010) Doomed lovers: mechanisms of isolation and incompatibility in plants. In Annual Review of Plant Biology, Vol. 61 ( Merchant, S. , Briggs, W.R. and Ort, D. eds), pp. 109–124. Palo Alto: Annual Reviews. [DOI] [PubMed] [Google Scholar]
- Bradbury, P.J. , Zhang, Z. , Kroon, D.E. , Casstevens, T.M. , Ramdoss, Y. and Buckler, E.S. (2007) TASSEL: software for association mapping of complex traits in diverse samples. Bioinformatics, 23, 2633–2635. [DOI] [PubMed] [Google Scholar]
- Browning, B.L. and Browning, S.R. (2011) A fast, powerful method for detecting identity by descent. Am. J. Hum. Genet. 88, 173–182. [DOI] [PMC free article] [PubMed] [Google Scholar]
- Chalhoub, B. , Denoeud, F. , Liu, S.Y. , Parkin, I.A.P. , Tang, H.B. , Wang, X.Y. , Chiquet, J. et al. (2014) Early allopolyploid evolution in the post‐Neolithic Brassica napus oilseed genome. Science, 345, 950–953. [DOI] [PubMed] [Google Scholar]
- Chatterjee, D. , Banga, S. , Gupta, M. , Bharti, S. , Salisbury, P.A. and Banga, S.S. (2015) Resynthesis of Brassica napus through hybridization between B. juncea and B. carinata . Theor. Appl. Genet. 129, 977–990. [DOI] [PubMed] [Google Scholar]
- Chen, S. , Zou, J. , Cowling, W.A. and Meng, J. (2010) Allelic diversity in a novel gene pool of canola‐quality Brassica napus enriched with alleles from B. rapa and B. carinata . Crop Pasture Sci. 61, 483–492. [Google Scholar]
- Cheng, F. , Sun, R. , Hou, X. , Zheng, H. , Zhang, F. , Zhang, Y. , Liu, B. et al. (2016) Subgenome parallel selection is associated with morphotype diversification and convergent crop domestication in Brassica rapa and Brassica oleracea . Nat. Genet. 48, 1218. [DOI] [PubMed] [Google Scholar]
- Cifuentes, M. , Grandont, L. , Moore, G. , Chevre, A.M. and Jenczewski, E. (2010) Genetic regulation of meiosis in polyploid species: new insights into an old question. New Phytol. 186, 29–36. [DOI] [PubMed] [Google Scholar]
- Clarke, W.E. , Higgins, E.E. , Plieske, J. , Wieseke, R. , Sidebottom, C. , Khedikar, Y. , Batley, J. et al. (2016) A high‐density SNP genotyping array for Brassica napus and its ancestral diploid species based on optimised selection of single‐locus markers in the allotetraploid genome. Theor. Appl. Genet. 129, 1887–1899. [DOI] [PMC free article] [PubMed] [Google Scholar]
- Ellstrand, N.C. and Schierenbeck, K.A. (2000) Hybridization as a stimulus for the evolution of invasiveness in plants? Proc. Natl Acad. Sci. USA, 97, 7043–7050. [DOI] [PMC free article] [PubMed] [Google Scholar]
- Excoffier, L. , Laval, G. and Schneider, S. (2007) Arlequin (version 3.0): an integrated software package for population genetics data analysis. Evol. Bioinform. Online, 1, 47–50. [PMC free article] [PubMed] [Google Scholar]
- FitzJohn, R.G. , Armstrong, T.T. , Newstrom‐Lloyd, L.E. , Wilton, A.D. and Cochrane, M. (2007) Hybridisation within Brassica and allied genera: evaluation of potential for transgene escape. Euphytica, 158, 209–230. [Google Scholar]
- Fu, D.H. , Qian, W. , Zou, J. and Meng, J.L. (2012) Genetic dissection of intersubgenomic heterosis in Brassica napus carrying genomic components of B. rapa . Euphytica, 184, 151–164. [Google Scholar]
- Gabriel, S.B. , Schaffner, S.F. , Nguyen, H. , Moore, J.M. , Roy, J. , Blumenstiel, B. , Higgins, J. et al. (2002) The structure of haplotype blocks in the human genome. Science, 296, 2225–2229. [DOI] [PubMed] [Google Scholar]
- Gaeta, R.T. , Pires, J.C. , Iniguez‐Luy, F. , Leon, E. and Osborn, T.C. (2007) Genomic changes in resynthesized Brassica napus and their effect on gene expression and phenotype. Plant Cell, 19, 3403–3417. [DOI] [PMC free article] [PubMed] [Google Scholar]
- Gan, L. , Sun, X. , Jin, L. , Wang, G. , Xu, J. , Wei, Z. and Fu, T. (2003) Establishment of math models of NIRS analysis for oil and protein contents in seed of Brassica napus . Sci. Agric. Sin. 36, 1609–1613. [In Chinese with English abstract]. [Google Scholar]
- Grandke, F. , Snowdon, R. and Samans, B. (2016) gsrc: an R package for genome structure rearrangement calling. Bioinformatics, 33, 545. [DOI] [PubMed] [Google Scholar]
- Hajjar, R. and Hodgkin, T. (2007) The use of wild relatives in crop improvement: a survey of developments over the last 20 years. Euphytica, 156, 1–13. [Google Scholar]
- Korber, N. , Bus, A. , Li, J.Q. , Parkin, I.A.P. , Wittkop, B. , Snowdon, R.J. and Stich, B. (2016) Agronomic and seed quality traits dissected by genome‐wide association mapping in Brassica napus . Front. Plant Sci. 7, 386. [DOI] [PMC free article] [PubMed] [Google Scholar]
- Kuligowska, K. , Lutken, H. and Muller, R. (2016) Towards development of new ornamental plants: status and progress in wide hybridization. Planta, 244, 1–17. [DOI] [PubMed] [Google Scholar]
- Lewis, R.S. , Linger, L.R. , Wolff, M.F. and Wernsman, E.A. (2007) The negative influence of N‐mediated TMV resistance on yield in tobacco: linkage drag versus pleiotropy. Theor. Appl. Genet. 115, 169–178. [DOI] [PubMed] [Google Scholar]
- Li, M. , Tian, S. , Jin, L. , Zhou, G. , Li, Y. , Zhang, Y. , Wang, T. et al. (2013) Genomic analyses identify distinct patterns of selection in domesticated pigs and Tibetan wild boars. Nat. Genet. 45, 1431–1438. [DOI] [PubMed] [Google Scholar]
- Li, F. , Chen, B. , Xu, K. , Wu, J. , Song, W. , Bancroft, I. , Harper, A.L. et al. (2014a) Genome‐wide association study dissects the genetic architecture of seed weight and seed quality in rapeseed (Brassica napus L.). DNA Res. 21, 355–367. [DOI] [PMC free article] [PubMed] [Google Scholar]
- Li, Q.F. , Zhou, Q.H. , Mei, J.Q. , Zhang, Y.J. , Li, J.N. , Li, Z.Y. , Ge, X.H. et al. (2014b) Improvement of Brassica napus via interspecific hybridization between B. napus and B. oleracea . Mol. Breed. 34, 1955–1963. [Google Scholar]
- Liu, K.J. and Muse, S.V. (2005) PowerMarker: an integrated analysis environment for genetic marker analysis. Bioinformatics, 21, 2128–2129. [DOI] [PubMed] [Google Scholar]
- Liu, S.Y. , Liu, Y.M. , Yang, X.H. , Tong, C.B. , Edwards, D. , Parkin, I.A.P. , Zhao, M.X. et al. (2014) The Brassica oleracea genome reveals the asymmetrical evolution of polyploid genomes. Nat. Commun. 5, 3930. [DOI] [PMC free article] [PubMed] [Google Scholar]
- Liu, S. , Fan, C.C. , Li, J.N. , Cai, G.Q. , Yang, Q.Y. , Wu, J. , Yi, X.Q. et al. (2016) A genome‐wide association study reveals novel elite allelic variations in seed oil content of Brassica napus . Theor. Appl. Genet. 129, 1203–1215. [DOI] [PubMed] [Google Scholar]
- Lowry, D.B. , Modliszewski, J.L. , Wright, K.M. , Wu, C.A. and Willis, J.H. (2008) The strength and genetic basis of reproductive isolating barriers in flowering plants. Philos. Trans. R. Soc. B Biol. Sci. 363, 3009–3021. [DOI] [PMC free article] [PubMed] [Google Scholar]
- Luo, Z.L. , Wang, M. , Long, Y. , Huang, Y.J. , Shi, L. , Zhang, C.Y. , Liu, X. et al. (2017) Incorporating pleiotropic quantitative trait loci in dissection of complex traits: seed yield in rapeseed as an example. Theor. Appl. Genet. 130, 1569–1585. [DOI] [PMC free article] [PubMed] [Google Scholar]
- Mallet, J. (2005) Hybridization as an invasion of the genome. Trends Ecol. Evol. 20, 229–237. [DOI] [PubMed] [Google Scholar]
- Mason, A.S. and Batley, J. (2015) Creating new interspecific hybrid and polyploid crops. Trends Biotechnol. 33, 436–441. [DOI] [PubMed] [Google Scholar]
- Mason, A.S. and Snowdon, R.J. (2016) Oilseed rape: learning about ancient and recent polyploid evolution from a recent crop species. Plant Biol. 18, 883–892. [DOI] [PubMed] [Google Scholar]
- Mason, A.S. , Rousseau‐Gueutin, M. , Morice, J. , Bayer, P.E. , Besharat, N. , Cousin, A. , Pradhan, A. et al. (2016) Centromere locations in Brassica A and C genomes revealed through half‐tetrad analysis. Genetics, 202, 513. [DOI] [PMC free article] [PubMed] [Google Scholar]
- Nagaharu, U. (1935) Genomic analysis in Brassica with special reference to the experimental formation of B. napus and peculiar mode of fertilization. Jpn. J. Bot. 7, 389–452. [Google Scholar]
- Nei, M. and Takezaki, N. (1983) Estimation of genetic distances and phylogenetic trees from DNA anlysis. In: Proceedings of the 5th World Congress on Genetics. Applied to Livestock Production pp. 405–412.
- Nicholson, G. , Smith, A.V. , Jonsson, F. , Gustafsson, O. , Stefansson, K. and Donnelly, P. (2002) Assessing population differentiation and isolation from single‐nucleotide polymorphism data. J. Roy. Stat. Soc. B 64, 695–715. [Google Scholar]
- Nicolas, S.D. , Monod, H. , Eber, F. , Chevre, A.M. and Jenczewski, E. (2012) Non‐random distribution of extensive chromosome rearrangements in Brassica napus depends on genome organization. Plant J. 70, 691–703. [DOI] [PubMed] [Google Scholar]
- Pires, J.C. , Zhao, J.W. , Schranz, M.E. , Leon, E.J. , Quijada, P.A. , Lukens, L.N. and Osborn, T.C. (2004) Flowering time divergence and genomic rearrangements in resynthesized Brassica polyploids (Brassicaceae). Biol. J. Lin. Soc. 82, 675–688. [Google Scholar]
- Pontes, O. , Neves, N. , Silva, M. , Lewis, M.S. , Madlung, A. , Comai, L. , Viegas, W. et al. (2004) Chromosomal locus rearrangements are a rapid response to formation of the allotetraploid Arabidopsis suecica genome. Proc. Natl Acad. Sci. USA, 101, 18240–18245. [DOI] [PMC free article] [PubMed] [Google Scholar]
- Porto‐Neto, L.R. , Lee, S.H. , Lee, H.K. and Gondro, C. (2013) Detection of signatures of selection using Fst. Methods Mol. Biol. 1019, 423–436. [DOI] [PubMed] [Google Scholar]
- Qian, L.W. , Qian, W. and Snowdon, R.J. (2014) Sub‐genomic selection patterns as a signature of breeding in the allopolyploid Brassica napus genome. BMC Genom. 15, 17. [DOI] [PMC free article] [PubMed] [Google Scholar]
- Rahman, M.H. (2001) Production of yellow‐seeded Brassica napus through interspecific crosses. Plant Breed. 120, 463–472. [Google Scholar]
- Rieseberg, L.H. and Carney, S.E. (1998) Plant hybridization. New Phytol. 140, 599–624. [DOI] [PubMed] [Google Scholar]
- Rieseberg, L.H. and Ellstrand, N.C. (1993) What can molecular and morphological markers tell us about plant hybridization. Crit. Rev. Plant Sci. 12, 213–241. [Google Scholar]
- Schmutzer, T. , Samans, B. , Dyrszka, E. , Ulpinnis, C. , Weise, S. , Stengel, D. , Colmsee, C. et al. (2015) Species‐wide genome sequence and nucleotide polymorphisms from the model allopolyploid plant Brassica napus . Sci. Data, 2, 150072. [DOI] [PMC free article] [PubMed] [Google Scholar]
- Schranz, M.E. and Osborn, T.C. (2000) Novel flowering time variation in the resynthesized polyploid Brassica napus . J. Hered. 91, 242–246. [DOI] [PubMed] [Google Scholar]
- Shaked, H. , Kashkush, K. , Ozkan, H. , Feldman, M. and Levy, A.A. (2001) Sequence elimination and cytosine methylation are rapid and reproducible responses of the genome to wide hybridization and allopolyploidy in wheat. Plant Cell, 13, 1749–1759. [DOI] [PMC free article] [PubMed] [Google Scholar]
- Shen, Y.Y. , Zhao, Q. , Zou, J. , Wang, W.L. , Gao, Y. , Meng, J.L. and Wang, J.B. (2014) Characterization and expression patterns of small RNAs in synthesized Brassica hexaploids. Plant Mol. Biol. 85, 287–299. [DOI] [PubMed] [Google Scholar]
- Singh, S. , Gumber, R.K. , Joshi, N. and Singh, K. (2005) Introgression from wild Cicer reticulatum to cultivated chickpea for productivity and disease resistance. Plant Breed. 124, 477–480. [Google Scholar]
- Soltis, D.E. , Visger, C.J. , Marchant, D.B. and Soltis, P.S. (2016) Polyploidy: pitfalls and paths to a paradigm. Am. J. Bot. 103, 1146–1166. [DOI] [PubMed] [Google Scholar]
- Song, K. , Lu, P. , Tang, K. and Osborn, T.C. (1995) Rapid genome change in synthetic polyploids of Brassica and its implications for polyploid evolution. Proc. Natl Acad. Sci. USA, 92, 7719–7723. [DOI] [PMC free article] [PubMed] [Google Scholar]
- Sun, C.M. , Wang, B.Q. , Yan, L. , Hu, K.N. , Liu, S. , Zhou, Y.M. , Guan, C.Y. et al. (2016) Genome‐wide association study provides insight into the genetic control of plant height in rapeseed (Brassica napus L.). Front. Plant Sci. 7, 1102. [DOI] [PMC free article] [PubMed] [Google Scholar]
- Tamura, K. , Stecher, G. , Peterson, D. , Filipski, A. and Kumar, S. (2013) MEGA6: molecular evolutionary genetics analysis version 6.0. Mol. Biol. Evol. 30, 2725–2729. [DOI] [PMC free article] [PubMed] [Google Scholar]
- Wang, X. , Wang, H. , Wang, J. , Sun, R. , Wu, J. , Liu, S. , Bai, Y. et al. (2011) The genome of the mesopolyploid crop species Brassica rapa . Nat. Genet. 43, 1035–1039. [DOI] [PubMed] [Google Scholar]
- Wang, N. , Li, F. , Chen, B.Y. , Xu, K. , Yan, G.X. , Qiao, J.W. , Li, J. et al. (2014) Genome‐wide investigation of genetic changes during modern breeding of Brassica napus . Theor. Appl. Genet. 127, 1817–1829. [DOI] [PubMed] [Google Scholar]
- Xiao, Y. , Chen, L. , Zou, J. , Tian, E. , Xia, W. and Meng, J. (2010) Development of a population for substantial new type Brassica napus diversified at both A/C genomes. Theor. Appl. Genet. 121, 1141–1150. [DOI] [PubMed] [Google Scholar]
- Xiong, Z.Y. , Gaeta, R.T. and Pires, J.C. (2011) Homoeologous shuffling and chromosome compensation maintain genome balance in resynthesized allopolyploid Brassica napus . Proc. Natl Acad. Sci. USA, 108, 7908–7913. [DOI] [PMC free article] [PubMed] [Google Scholar]
- Xu, L.P. , Hu, K.N. , Zhang, Z.Q. , Guan, C.Y. , Chen, S. , Hua, W. , Li, J.N. et al. (2016) Genome‐wide association study reveals the genetic architecture of flowering time in rapeseed (Brassica napus L.). DNA Res. 23, 43–52. [DOI] [PMC free article] [PubMed] [Google Scholar]
- Yang, J. , Liu, D. , Wang, X. , Ji, C. , Cheng, F. , Liu, B. , Hu, Z. et al. (2016) The genome sequence of allopolyploid Brassica juncea and analysis of differential homoeolog gene expression influencing selection. Nat. Genet. 48, 1225. [DOI] [PubMed] [Google Scholar]
- Zhang, W.S. , Hu, D.D. , Raman, R. , Guo, S.M. , Wei, Z.L. , Shen, X.Q. , Meng, J.L. et al. (2017) Investigation of the genetic diversity and quantitative trait loci accounting for important agronomic and seed quality traits in Brassica carinata . Front. Plant Sci. 8, 615. [DOI] [PMC free article] [PubMed] [Google Scholar]
- Zou, J. , Zhu, J.L. , Huang, S.M. , Tian, E.T. , Xiao, Y. , Fu, D.H. , Tu, J.X. et al. (2010) Broadening the avenue of intersubgenomic heterosis in oilseed Brassica . Theor. Appl. Genet. 120, 283–290. [DOI] [PubMed] [Google Scholar]
- Zou, J. , Fu, D.H. , Gong, H.H. , Qian, W. , Xia, W. , Pires, J.C. , Li, R.Y. et al. (2011) De novo genetic variation associated with retrotransposon activation, genomic rearrangements and trait variation in a recombinant inbred line population of Brassica napus derived from interspecific hybridization with Brassica rapa . Plant J. 68, 212–224. [DOI] [PubMed] [Google Scholar]
- Zou, J. , Hu, D.D. , Liu, P.F. , Raman, H. , Liu, Z.S. , Liu, X.J. , Parkin, I.A.P. et al. (2016) Co‐linearity and divergence of the A subgenome of Brassica juncea compared with other Brassica species carrying different A subgenomes. BMC Genom. 17, 18. [DOI] [PMC free article] [PubMed] [Google Scholar]
Associated Data
This section collects any data citations, data availability statements, or supplementary materials included in this article.
Supplementary Materials
Figure S1 Linkage disequilibrium and haplotype blocks of the new‐type Brassica napus population across the whole genome, and its comparison with traditional Brassica napus.
Figure S2 Distribution of the haplotype blocks in the new‐type Brassica napus population.
Figure S3 Distribution of identity‐by‐descent blocks (IBD) originating from the parents of the new‐type Brassica napus population.
Table S1 Name and geographical origin of parental lines involved in the development of the new‐type B. napus.
Table S2 New‐type Brassica napus lines and accessions of the parental species investigated in this study and their characteristics.
Table S3 Polymorphism within and among the population of new‐type Brassica napus and its parental species as evaluated by the Illumina Infinium Brassica 60K SNP array.
Table S4 Haplotype blocks >50 kb identified in the new‐type Brassica napus and traditional Brassica napus populations.
Table S5 Identity‐by‐descent (IBD) segments originating from Brassica napus ‘HS3’ within the new‐type Brassica napus population.
Table S6 Deletion and duplication regions >50 kb in size in the new‐type Brassica napus population.
Table S7 Selected regions identified in the population of new‐type Brassica napus and traditional Brassica napus.