Abstract
Purpose
To investigate the feasibility of automatic quantification of bone marrow edema (BME) on MRI of the wrist in patients with early arthritis.
Methods
For 485 early arthritis patients (clinically confirmed arthritis of one or more joints, symptoms for less than 2 years), MR scans of the wrist were processed in three automatic stages. First, super‐resolution reconstruction was applied to fuse coronal and axial scans into a single high‐resolution 3D image. Next, the carpal bones were located and delineated using atlas‐based segmentation. Finally, the extent of BME within each bone was quantified by identifying image intensity values characteristic of BME by fuzzy clustering and measuring the fraction of voxels with these characteristic intensities within each bone. Correlation with visual BME scores was assessed through Pearson correlation coefficient.
Results
Pearson correlation between quantitative and visual BME scores across 485 patients was r=0.83, P<0.001.
Conclusions
Quantitative measurement of BME on MRI of the wrist has the potential to provide a feasible alternative to visual scoring. Complete automation requires automatic detection and compensation of acquisition artifacts. Magn Reson Med 79:1127–1134, 2018. © 2017 The Authors Magnetic Resonance in Medicine published by Wiley Periodicals, Inc. on behalf of International Society for Magnetic Resonance in Medicine. This is an open access article under the terms of the Creative Commons Attribution‐NonCommercial‐NoDerivs License, which permits use and distribution in any medium, provided the original work is properly cited, the use is non‐commercial and no modifications or adaptations are made.
Keywords: rheumatoid arthritis, bone marrow edema, inflammation, atlas‐based segmentation, superresolution reconstruction
INTRODUCTION
The presence of bone marrow edema–like abnormalities (BME) has been shown to be a strong predictor of radiographic progression in rheumatoid arthritis (RA) patients 1, 2, 3, 4, and is therefore an important biomarker in early arthritis. Evaluation of BME is done on MRI, where it is visually scored based on the Outcome Measures in Rheumatology RA‐MRI Scoring (RAMRIS) system 5, 6. This scoring method requires a trained reader to visually estimate the volume of BME. Such estimates are challenging and time‐consuming because of the need to assess multiple imaging planes, and slices and are inherently undermined by the simultaneous contrast effect 7, 8, 9 of the human visual system, which causes the reader to perceive the same image intensity value differently, depending on surrounding background intensities.
An automatic and quantitative approach to evaluating BME on MR scans could overcome the limitations of visual scoring by offering high‐precision measurements derived directly from 3D image data. It could alleviate the time burden of training and manual scoring for clinical researchers, and could facilitate the use of MRI in drug evaluation studies, in which using a trained team of readers is costly.
Several previous studies on BME quantification in the wrist joint 10, 11, 12 relied on a semi‐automatic method proposed by Li et al. 13. However, this technique requires an expert to manually delineate non‐edema and edema regions of interest within every bone that needs to be evaluated. These studies were also limited to a small sample size of fewer than 20 subjects. One related study focuses on fully automatic BME quantification in the knee joint 14, but it is not directly clear how to extend the bone segmentation method 15 to a joint with more than two bones, as is the case in the wrist.
In the work presented here, we developed an automatic framework for measuring the fraction of bone volume affected by BME in the eight carpal bones of the wrist joint. In contrast to previous methods, we used atlas‐based segmentation to automatically locate and delineate the carpal bones. Our aim was to investigate the feasibility of BME quantification through such atlas‐based approach, and assess the correlation between quantitative measurements and visual BME scores in a large cohort of early arthritis patients.
METHODS
Patients
A total of 573 early arthritis patients from the Leiden Early Arthritis Clinic cohort 16 (mean age, 54.7 years; age range, 18.1–87.9 years) were studied: 354 female (mean age, 53.0 years; age range, 18.7–85.3 years) and 219 male (mean age, 57.5 years; age range, 18.1–87.9 years) patients. Inclusion required clinically confirmed arthritis by physical examination in one or more joints, and symptom duration of less than 2 years. The MR scans were obtained for the wrist joint of the most painful side (or the dominant side in cases of equally severe symptoms on both sides). The study was approved by the institutional medical ethics committee and all participants provided written informed consent.
MRI Sequences
The wrist joint was scanned with an ONI MSK Extreme 1.5 Tesla (T) extremity MR scanner (GE Healthcare, Waukesha, WI) with a 100‐mm coil. Before contrast agent injection, T1‐weighted fast spin‐echo sequence (T1) was acquired in the coronal plane with repetition time (TR) of 650 ms, echo time (TE) of 17 ms, acquisition matrix 388 × 88, echo train length (ETL) 2. After intravenous injection of Gd‐chelate (gadoteric acid, Guerbet, Paris, France, standard dose of 0.1 mmol/kg), a T1‐weighted fast spin‐echo sequence with frequency‐selective fat saturation (T1‐Gd) was obtained in the coronal plane (TR 650 ms/TE 17 ms, acquisition matrix 364 × 224, ETL 2) and the axial plane (TR 570 ms/TE 7 ms, acquisition matrix 320 × 192, ETL 2). Coronal sequences were acquired with a slice thickness of 2 mm and a slice gap of 0.2 mm. Axial sequences were acquired with a slice thickness of 3 mm and a slice gap of 0.3 mm. The use of a T1‐Gd sequence instead of a T2‐weighted fat‐saturated sequence is a validated modification that has been shown to perform equally well in the depiction of BME and allows for a faster scanning protocol 17, 18, which in turn reduces patient discomfort. Safety risk was minimized to the degree possible by the use of a macrocyclic contrast agent 19, 20.
Visual Scoring of BME
Bone marrow edema was assessed in line with the definitions proposed by RAMRIS 5 with validated modification of substituting T2‐weighted fat‐saturated sequence with T1‐Gd sequence 17, 18. The BME was independently scored by two trained readers who were blinded to clinical data on a 0–3 scale based on the estimated fraction of affected bone volume: 0, no BME; 1, 1–33% of bone edematous; 2, 34–66%; 3, 67–100%. The within‐reader intraclass correlation coefficients (ICCs) for the total inflammation score were 0.98 and 0.93; the between‐reader ICC was 0.95. The mean BME score of the two readers was considered.
Patients for which at least one reader marked one or more bones as unscorable (typically a result of fat suppression issues) were excluded (n=11). Patients whose T1‐Gd images suffered from incomplete fat suppression, but still considered scorable by readers based on T1 images showing low signal intensity in the matching areas with BME on T1‐Gd, were retained.
Quantitative Image Analysis Framework
Our automatic framework consisted of three stages. First, super‐resolution reconstruction was applied to fuse coronal and axial T1‐Gd scans into a single high‐resolution 3D image. Next, the carpal bones were located and delineated using atlas‐based segmentation. Finally, the extent of BME within each bone was quantified by identifying image intensity values characteristic of BME by fuzzy clustering, and measuring the fraction of voxels with these characteristic intensities within each bone. Note that because the super‐resolution reconstruction step requires a coronal and axial scan of the same sequence as input, this stage, and therefore the entire framework, could only be applied to T1‐Gd scans. Therefore, pre‐contrast T1 images, which were acquired only in the coronal plane, were not used in the quantitative image analysis framework.
Super‐resolution Reconstruction
When readers evaluate BME visually, they make use of two complementary scans: one acquired in the coronal plane and the second in the axial plane. This is because the slice thickness in each of the scans (2 mm in coronal; 3 mm in axial) is much larger than the in‐plane spacing between voxels (∼0.2 mm). Therefore, one scan compensates for anatomical detail lost in the other scan, allowing the reader to perceptually form a more complete assessment of the anatomy. Naturally, this raises the question of how to simulate such perceptual fusion of two images on the computer, to obtain a single 3D image with isotropic voxels and high resolution in all three viewing planes. This type of problem (ie, reconstruction of a high‐resolution image of an object from multiple low‐resolution images of the same object) is commonly referred to as super‐resolution reconstruction (SRR).
A variety of SRR methods have been proposed for MRI 21, 22, 23, 24. In this study, we applied the method developed by Poot et al. 24. This algorithm belongs to the family of spatial domain SRR methods, which construct a linear model of the image acquisition system and reconstruct the high‐resolution image by solving a system of linear equations. This system is often underdetermined, as in our case, and is solved by applying regularization. We used Laplacian regularization with parameter . This value was optimized in an experiment by two expert radiologists (M.R. and J.L.B.) to provide satisfactory balance between image noise/artifacts and visual clarity of BME, synovial tissue, cartilage, and fluid around tendons. Before applying SRR, the axial scan was spatially aligned to the coronal scan using the Elastix software package 25, 26, axial image intensity was linearly matched to the coronal image intensity, and the field of view of both images was restricted to the overlapping physical space between the two scans. Figure 1 shows an example of applying SRR to a pair of coronal and axial scans.
Figure 1.
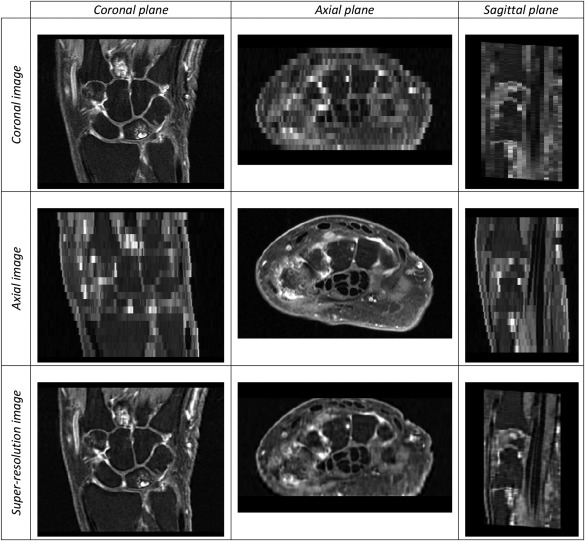
Coronal, axial, and super‐resolution images (top to bottom rows, respectively) and their coronal, axial, and sagittal viewing planes (left to right columns, respectively). The original scans exhibit high resolution only in one plane, whereas the super‐resolution image exhibits high resolution in all three planes.
Segmentation of Carpal Bones
The carpal bones were located and delineated using atlas‐based segmentation (ABS) 27. The atlas consisted of 13 early arthritis patients. For each atlas patient, the carpal bones were manually segmented in the coronal and axial T1‐Gd images, yielding two segmentation images. The voxels of these manual segmentation images were assigned an integer bone label value ranging from 1 to 8 in locations corresponding to one of the eight carpal bones, or otherwise the value 0 in locations outside the bones. Then, separately for each bone, the two manual segmentation images were fused using SRR. Voxels with values above 78% of the bone label value were assigned the bone label value, and the remaining voxels were zeroed to discard noise. The resulting eight images were superimposed to obtain the complete segmentation image in high‐resolution space.
The first phase of the ABS routine consisted of image registration between each of the 13 atlas images and the target image being segmented. Image registration (using Elastix 25) was done in two stages 28: first, a similarity mapping to account for global translation, rotation and scaling, followed by a B‐spline mapping to account for local deformations. After spatially mapping carpal bone segmentations from every atlas image onto the target image, a majority vote was applied across all mappings, determining whether a voxel was labeled as background or as one of the carpal bones.
It should be noted that all atlas images contained the right wrist joint. For segmentation of the left wrist, atlas images were horizontally mirrored before registration. To avoid biased measurements, patients that were part of the ABS atlas were excluded from optimization and validation phases.
Assessment of ABS Accuracy
To assess the accuracy of ABS, a leave‐one‐out cross‐validation was performed. In each of the 13 runs, 12 out of 13 atlas images would constitute the atlas set, and the remaining image would be used as the target image to be segmented. The result was validated against manual segmentation of the coronal T1‐Gd image. Segmentation accuracy was evaluated by computing precision and recall rates for each carpal bone. Here, “precision rate” refers to the fraction of voxels segmented by ABS that overlap with the manual bone segmentation, whereas “recall rate” refers to the fraction of voxels within the manual bone segmentation that were correctly segmented by ABS.
Bone Marrow Edema Quantification
Bone marrow edema is characterized by high signal intensity on T1‐Gd images as a result of contrast enhancement and the suppressed normal fatty bone marrow. The precise intensity values vary per acquisition, depending on the strength of contrast enhancement and fat suppression. The variation of these values is further broadened by inherent magnetic field inhomogeneities of the MR scanner. To account for these acquisition‐specific intensity ranges of edematous versus non‐edematous bone marrow, fuzzy C‐means clustering 29, 30 was applied to the intensity values of all voxels in each image, assuming two clusters. This yields two probability map images (one per cluster), in which each voxel contains the probability of that voxel belonging to the respective cluster. Let C2 be the cluster whose center value is the higher of the two computed cluster centers. As Figure 2 illustrates, high probabilities (bright voxels) within the C2 probability map correspond to locations of high fluid content, such as BME and synovium.
Figure 2.
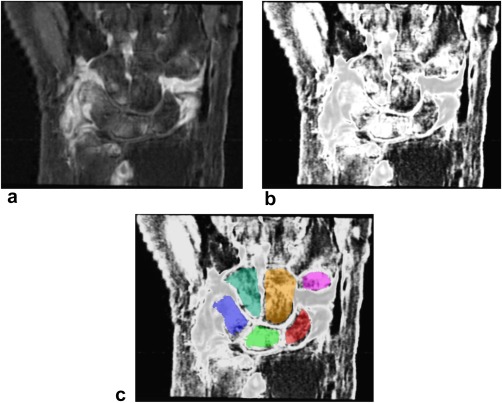
The SRR image of the wrist (a), its C2 probability map image (b), and C2 image with carpal bone segmentation overlay from ABS (c).
For each carpal bone, the fraction of bone affected by BME was estimated as the fraction of voxels (out of the total number of voxels within the bone's segmentation) whose probability of belonging to C2 was higher than the threshold value (numeric value optimized below). The resulting quantitative BME measurement (BME‐QM) takes any fractional values between 0 and 1.
Optimization
To optimize the T C2 threshold parameter based on correlation with visual BME scores, a training set of patients was defined. The number of patients with low‐moderate BME in our cohort is much larger than the number of patients with severe BME. Therefore, random sampling of the cohort does not guarantee inclusion of patients with severe BME in the population sample. To ensure that patients with a high degree of BME were represented in the training set, we categorized a set of 468 patients by the maximum visual BME score ( ) across the carpal bones. Four sampling categories were defined corresponding to four intervals within range. Table 1 lists the defined categories and the number of patients that fall into each category. Next, 15 patients were randomly selected from each category to form a training set of 60 patients.
Table 1.
Training Set Sampling Categories
| Patient category index | interval | Number of patients | |
|---|---|---|---|
| 0 |
|
189 | |
| 1 |
|
208 | |
| 2 |
|
42 | |
| 3 |
|
29 |
Note: Random sampling across all categories would form a training set that consists primarily of patients with R max≤1. In contrast, randomly selecting 15 patients from category 3, for example, guarantees that the training set will include 15 patients, with at least one bone that received a visual BME score greater than 2. Thus, random sampling from individual categories helps to ensure that T C2 is optimized with respect to the entire range of the visual BME score.
To avoid training errors, three patients whose MR scans suffered from incomplete fat suppression and one patient for which ABS failed were excluded from the obtained training set. This brought the final training set size to 56 patients. The optimal value of was found by maximizing the Pearson correlation coefficient between the sum of visual BME scores across all carpal bones and the sum of BME‐QM across all carpal bones.
Validation
After optimizing and locking the value of , the method was validated on 502 patients who were not part of the training set.
Statistical Analysis
The Pearson correlation coefficient r between the sum of visual BME scores across all carpal bones and the sum of BME‐QM across all carpal bones was evaluated. P values below 0.05 were indicative of statistical significance. The MR scans that suffered from incomplete fat suppression were noted and excluded from the correlation computation. Scans with other acquisition artifacts, such as noise patterns and incomplete field of view, were excluded from the analysis. Patients in which one or more bones were not segmented by ABS yielded undefined values for BME‐QM. Because undefined values cannot be included in the correlation computation, these patients were excluded from statistical analysis. The statistics were computed using MATLAB R2015b (The MathWorks Inc, Natick, MA).
RESULTS
Assessment of ABS Accuracy
The mean bone‐level recall and precision rates of ABS with respect to manual segmentations across 13 patients are shown in Figure 3. Recall rates were lowest in the pisiform (mean of 0.58 ± 0.09 SD) and highest in the capitate (mean of 0.82 ± 0.03 SD). Precision rates were high in all bones, with mean values ranging from 0.92 to 0.96 and SD values ranging from 0.02 to 0.05.
Figure 3.
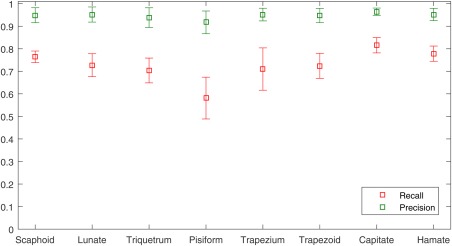
Mean ( ± standard deviation) bone‐level recall and precision rates of ABS with respect to manual segmentations across 13 patients.
Optimization
The maximum Pearson correlation ( 0.86, ), over 56 training set patients, between the sum of visual BME scores across all carpal bones and the sum of BME‐QM across all carpal bones, was achieved at threshold value 0.83 (Figure 4). The scatter plot of the data is shown in Figure 5.
Figure 4.
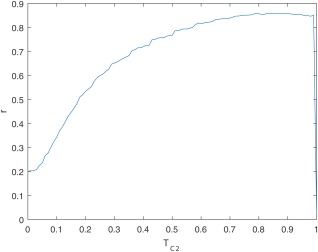
Pearson correlation coefficient r, over 56 training set patients, between the sum of visual BME scores across all carpal bones and the sum of BME‐QM across all carpal bones, as a function of .
Figure 5.
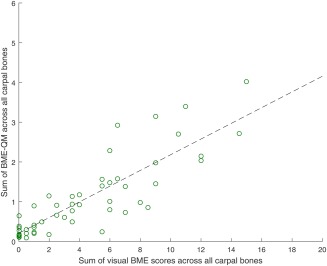
Scatter plot of sum of BME‐QM across all carpal bones versus sum of visual BME scores across all carpal bones for 56 training set patients. Each data point represents a single patient. r = 0.86, , 0.83. Dashed black line represents linear regression fit.
Validation
Out of 502 patients, BME‐QM was undefined in six patients because of failed segmentation. Three patients were excluded as a result of noise artifacts (n=2) and incomplete field of view (n=1) in their images. The MR scans of eight patients suffered from incomplete fat suppression. For the remaining 485 patients, the Pearson correlation between the sum of visual BME scores across all carpal bones and the sum of BME‐QM across all carpal bones was 0.83, . The scatter plot of the data is shown in Figure 6. Most patients formed clusters of steadily increasing BME‐QM values, as the visual score value increased. Some outliers from this general trend were clearly visible for visual score value of 0 and BME‐QM values between 1 and 2. These high quantitative values were the result of inaccurate segmentation of the carpal bones. Several patients whose images suffered from incomplete fat suppression produced BME‐QM values that were largely deviating from the observed regression fit.
Figure 6.
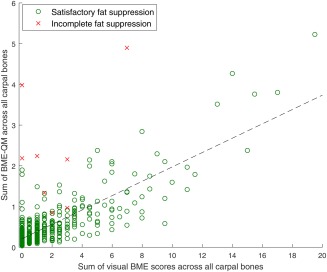
Scatter plot of sum of BME‐QM across all carpal bones versus sum of visual BME scores across all carpal bones for 493 validation set patients. Each data point represents a single patient. Linear regression fit (dashed black line) and Pearson correlation r were computed over 485 patients whose MR scans did not suffer from incomplete fat suppression (circular data points): 0.83, , 0.83.
DISCUSSION AND CONCLUSIONS
In this study, we investigated the feasibility of automatic quantification of BME on MRI of the wrist in patients with early arthritis through an atlas‐based approach. We chose to focus on the carpal bones, as they provide a complex multi‐object scenario for exploring the feasibility of an atlas‐based quantification framework. The advantage of this framework is that it can be straightforwardly expanded to other areas of the wrist and other joints by adding these areas of interest to the atlas. Validation results across 485 early arthritis patients indicated good correlation between BME‐QM and visual BME scores. It should be noted that perfect correlation is inherently not achievable because of the coarse grading scale of the visual score and the fine grading scale of BME‐QM.
Our training strategy helped to ensure that during validation BME‐QM correlated well across the entire range of the visual BME score. The fact that the correlation curve in Figure 4 is relatively flat for values between 0.75 and 0.9 suggests that there is a range of values in this interval that result in good agreement between quantitative and visual scores. Furthermore, because BME‐QM measures the fraction of voxels with C2 probability above , this appears to indicate that locations considered as BME in visual scoring often result in C2 probability values around 0.9. We also examined the effect of a smaller training set on optimization (data not shown), with five patients randomly selected from each category forming a training set of 20 patients. We observed a similarly stable high correlation for values between 0.75 and 0.9, suggesting that the optimization step is not overly sensitive to training set size, as long as patients from all categories of BME severity ( ) are represented in the training data.
The time required to execute the BME‐QM framework for one patient on an Intel Xeon E5‐1620 v3 CPU was approximately 58 min (SRR, ∼20 min; ABS, ∼35 min; BME quantification ∼3 min). Atlas‐based segmentation is the most time‐consuming step, but it can be accelerated 10‐fold by running image registrations between all atlas images and the target image in parallel. Because registrations are independent of each other, this can be easily achieved given sufficient computing power. However, in large cohort studies, in which evaluation of image data is often carried out days or weeks after the image is acquired, such acceleration may be irrelevant; an automatic framework can be executed immediately after image acquisition in an integrated fashion, thus ensuring quantitative results are available by the time a research project enters the evaluation phase.
Atlas‐based segmentation provided satisfactory segmentation for the vast majority of patients. In practice, failed segmentation cases will require manual adjustment by an expert in order for BME‐QM to be computed. Oversegmentation of bones or shifted segmentations that include synovium voxels increase the value of BME‐QM as a result of contrast enhancement in the synovium. It is preferable to slightly undersegment the bone to ensure the exclusion of synovium while retaining most of the bone marrow within the segmentation. That said, significant undersegmentation may lead to an upward bias in BME‐QM. Quantitative assessment of ABS accuracy in 13 patients revealed the tendency of ABS to undersegment bones (midrange recall rates and high precision rates). Therefore, the current framework may raise false alarms when bone volume is underestimated in the presence of moderate BME. The midrange recall rates also suggest unwanted variability in BME‐QM as a result of incomplete bone segmentation. The fact that the lowest recall rates were observed in the pisiform while the highest in the capitate, is likely because the pisiform is the smallest of the carpal bones, whereas the capitate is the largest of the carpal bones. An additional challenge during registration is the varied intensity and pattern of BME across patients. It is therefore advisable to avoid using very fine grid spacing during the B‐spline registration step, as alignment between images on a coarser scale should be less sensitive to these local variations. Another potential pitfall is inclusion of erosions in the segmentation result. Erosions may contain high intensities that will mistakenly contribute to the value of BME‐QM. To address these possible pitfalls and improve bone‐level recall rates, an automatic refinement step should follow ABS in the future. In addition, to ensure robustness of the atlas to variations in MRI acquisition protocols and scanners at different sites, it may be necessary to form a larger atlas set consisting of subatlases of wrist scans acquired under different echo/repetition times and magnetic field strengths. The most suitable subatlas can then be automatically identified based on the acquisition parameters of a specific target image.
Incomplete fat suppression during acquisition of MR scans has an adverse effect on the accuracy of BME‐QM. Bone marrow fat signal that is not properly suppressed results in high intensities that are mistaken for edema voxels by the clustering algorithm. Fat suppression quality requirements for BME‐QM are higher compared with visual scoring. This is because of the availability of precontrast image data in visual scoring and pattern recognition during visual assessment of increased signal intensity secondary to insufficient fat suppression. Although fat suppression issues are relatively rare, they must be identified before applying BME‐QM to reduce false positives. The possibility of identifying and compensating fat suppression issues automatically should be investigated. In addition, more robust fat suppression techniques that are less sensitive to bulk susceptibility, such as Dixon techniques, may be beneficial when BME‐QM is used.
A limitation of the current study is that the quality of carpal bone segmentation in training and validation set patients was judged subjectively. Quantitative assessment of segmentation accuracy was not possible, as no ground truth, manual segmentations were available for these patients. Quantification of segmentation accuracy would allow to supplement the BME measurement with a confidence measure. Another limitation is that pre‐contrast image data could not be included in the framework, as pre‐contrast T1 scans were acquired only in the coronal plane, whereas SRR requires a coronal and axial scan of the same sequence as input. Therefore, a straightforward voxel‐to‐voxel comparison between SRR T1‐Gd images and pre‐contrast T1 images was not possible. Inclusion of pre‐contrast data would allow to explore a subtraction methodology as a means of quantifying BME, and could facilitate the detection of fat suppression issues.
Recently, another framework aimed at automatically quantifying RA‐related biomarkers, called quantitative RAMRIS, was proposed by Bowes et al. 31, 32 and used in a treatment effects study by Conaghan et al. 33. These studies focus on measuring change over time, demonstrating higher sensitivity of quantitative measurements compared with RAMRIS. In contrast, we focused on validation of quantitative measurements at a single time point. In the future, it would be interesting to use BME‐QM for measuring change over time and evaluate its sensitivity.
We conclude that BME‐QM has the potential to provide a feasible alternative to visual scoring of BME on MRI of the wrist in patients with early arthritis. Complete automation requires further refinement of carpal bone segmentation and automatic detection and compensation of acquisition artifacts. Future work should also add more locations of interest relevant to RA to the atlas and extend this framework to other types of inflammation, such as synovitis and tenosynovitis. These developments can save time and manual effort for clinical researchers and help assess the value of MRI both for diagnosing RA and monitoring its treatment.
ACKNOWLEDGMENTS
We would like to sincerely thank Dirk H. J. Poot for providing us with the implementation of his super‐resolution algorithm and advice on applying the method to our image data. We also appreciate the input of Elize C. Newsum in visual scoring of the MR scans.
This research was supported by the Dutch Technology Foundation STW, under grant no. 13329. STW is part of the Netherlands Organization for Scientific Research (NWO), which is partly funded by the Dutch Ministry of Economic Affairs.
REFERENCES
- 1. McQueen FM, Benton N, Perry D, Crabbe J, Robinson E, Yeoman S, McLean L, Stewart N. Bone edema scored on magnetic resonance imaging scans of the dominant carpus at presentation predicts radiographic joint damage of the hands and feet six years later in patients with rheumatoid arthritis. Arthritis Rheum 2003;48:1814–1827. [DOI] [PubMed] [Google Scholar]
- 2. Hetland ML, Ejbjerg B, Hørslev‐Petersen K, et al. MRI bone oedema is the strongest predictor of subsequent radiographic progression in early rheumatoid arthritis. Results from a 2‐year randomised controlled trial (CIMESTRA). Ann Rheum Dis 2009;68:384–390. [DOI] [PubMed] [Google Scholar]
- 3. Bøyesen P, Haavardsholm EA, Ostergaard M, van der Heijde D, Sesseng S, Kvien TK. MRI in early rheumatoid arthritis: synovitis and bone marrow oedema are independent predictors of subsequent radiographic progression. Ann Rheum Dis 2011;70:428–433. [DOI] [PubMed] [Google Scholar]
- 4. Nieuwenhuis WP, van Steenbergen HW, Stomp W, Stijnen T, Huizinga TWJ, Bloem JL, van der Heijde D, Reijnierse M, van der Helm‐van Mil AHM. The course of bone marrow edema in early undifferentiated arthritis and rheumatoid arthritis: a longitudinal magnetic resonance imaging study at bone level. Arthritis Rheumatol (Hoboken, NJ) 2016;68:1080–1088. [DOI] [PubMed] [Google Scholar]
- 5. Østergaard M, Peterfy C, Conaghan P, et al. OMERACT rheumatoid arthritis magnetic resonance imaging studies. Core set of MRI acquisitions, joint pathology definitions, and the OMERACT RA‐MRI scoring system. J Rheumatol 2003;30:1385–1386. [PubMed] [Google Scholar]
- 6. Østergaard M, Edmonds J, McQueen F, Peterfy C, Lassere M, Ejbjerg B, Bird P, Emery P, Genant H, Conaghan P. An introduction to the EULAR‐OMERACT rheumatoid arthritis MRI reference image atlas. Ann Rheum Dis 2005;64:i3–i7. [DOI] [PMC free article] [PubMed] [Google Scholar]
- 7. Diamond AL. Foveal simultaneous brightness contrast as a function of inducing, and test‐field luminances. J Exp Psychol 1953;45:304–314. [DOI] [PubMed] [Google Scholar]
- 8. Heinemann EG. Simultaneous brightness induction as a function of inducing‐ and test‐field luminances. J Exp Psychol 1955;50:89–96. [DOI] [PubMed] [Google Scholar]
- 9. Leibowitz H, Mote FA, Thurlow WR. Simultaneous contrast as a function of separation between test and inducing fields. J Exp Psychol 1953;46:453–456. [DOI] [PubMed] [Google Scholar]
- 10. Li X, Yu A, Virayavanich W, Noworolski SM, Link TM, Imboden J. Quantitative characterization of bone marrow edema pattern in rheumatoid arthritis using 3 Tesla MRI. J Magn Reson Imaging 2012;35:211–217. [DOI] [PubMed] [Google Scholar]
- 11. Teruel JR, Burghardt AJ, Rivoire J, Srikhum W, Noworolski SM, Link TM, Imboden JB, Li X. Bone structure and perfusion quantification of bone marrow edema pattern in the wrist of patients with rheumatoid arthritis: a multimodality study. J Rheumatol 2014;41:1766–1773. [DOI] [PubMed] [Google Scholar]
- 12. Yang H, Rivoire J, Hoppe M, Srikhum W, Imboden J, Link TM, Li X. Computer‐aided and manual quantifications of MRI synovitis, bone marrow edema‐like lesions, erosion and cartilage loss in rheumatoid arthritis of the wrist. Skeletal Radiol 2015;44:539–547. [DOI] [PubMed] [Google Scholar]
- 13. Li X, Ma BC, Bolbos RI, Stahl R, Lozano J, Zuo J, Lin K, Link TM, Safran M, Majumdar S. Quantitative assessment of bone marrow edema‐like lesion and overlying cartilage in knees with osteoarthritis and anterior cruciate ligament tear using MR imaging and spectroscopic imaging at 3 Tesla. J Magn Reson Imaging 2008;28:453–461. [DOI] [PMC free article] [PubMed] [Google Scholar]
- 14. Dodin P, Abram F, Pelletier J‐P, Martel‐Pelletier J. A fully automated system for quantification of knee bone marrow lesions using MRI and the osteoarthritis initiative cohort. J Biomed Graph Comput 2012;3:51. [Google Scholar]
- 15. Dodin P, Martel‐Pelletier J, Pelletier J‐P, Abram F. A fully automated human knee 3D MRI bone segmentation using the ray casting technique. Med Biol Eng Comput 2011;49:1413–1424. [DOI] [PubMed] [Google Scholar]
- 16. de Rooy DPC, van der Linden MPM, Knevel R, Huizinga TWJ, van der Helm‐van Mil AHM. Predicting arthritis outcomes—what can be learned from the Leiden Early Arthritis Clinic? Rheumatology (Oxford) 2011;50:93–100. [DOI] [PubMed] [Google Scholar]
- 17. Stomp W, Krabben A, van der Heijde D, Huizinga TWJ, Bloem JL, van der Helm‐van Mil AHM, Reijnierse M. Aiming for a shorter rheumatoid arthritis MRI protocol: can contrast‐enhanced MRI replace T2 for the detection of bone marrow oedema? Eur Radiol 2014;24:2614–2622. [DOI] [PubMed] [Google Scholar]
- 18. Sudoł‐Szopińska I, Jurik AG, Eshed I, et al. Recommendations of the ESSR Arthritis Subcommittee for the use of magnetic resonance imaging in musculoskeletal rheumatic diseases. Semin Musculoskelet Radiol 2015;19:396–411. [DOI] [PubMed] [Google Scholar]
- 19. Frenzel T, Apte C, Jost G, Schöckel L, Lohrke J, Pietsch H. Quantification and assessment of the chemical form of residual gadolinium in the brain after repeated administration of gadolinium‐based contrast agents. Invest Radiol 2017:1–9. [DOI] [PMC free article] [PubMed] [Google Scholar]
- 20. Radbruch A, Haase R, Kickingereder P, Bäumer P, Bickelhaupt S, Paech D, Wick W, Schlemmer H‐P, Seitz A, Bendszus M. Pediatric brain: no increased signal intensity in the dentate nucleus on unenhanced T1‐weighted MR images after consecutive exposure to a macrocyclic gadolinium‐based contrast agent. Radiology 2017:1–9. [DOI] [PubMed] [Google Scholar]
- 21. Greenspan H, Oz G, Kiryati N, Peled S. MRI inter‐slice reconstruction using super‐resolution. Magn Reson Imaging 2002;20:437–446. [DOI] [PubMed] [Google Scholar]
- 22. Shilling RZ, Robbie TQ, Bailloeul T, Mewes K, Mersereau RM, Brummer ME. A super‐resolution framework for 3‐D high‐resolution and high‐contrast imaging using 2‐D multislice MRI. IEEE Trans Med Imaging 2009;28:633–644. [DOI] [PubMed] [Google Scholar]
- 23. Woo J, Murano EZ, Stone M, Prince JL. Reconstruction of high‐resolution tongue volumes from MRI. IEEE Trans Biomed Eng 2012;59:3511–3524. [DOI] [PMC free article] [PubMed] [Google Scholar]
- 24. Poot DHJ, Van Meir V, Sijbers J. General and efficient super‐resolution method for multi‐slice MRI. Med Image Comput Comput Assist Interv 2010;13:615–622. [DOI] [PubMed] [Google Scholar]
- 25. Klein S, Staring M, Murphy K, Viergever MA, Pluim JPW. Elastix: a toolbox for intensity‐based medical image registration. IEEE Trans Med Imaging 2010;29:196–205. [DOI] [PubMed] [Google Scholar]
- 26. Aizenberg E. Elastix parameters for alignment between coronal and axial images of the wrist. http://elastix.bigr.nl/wiki/index.php/Par0040. Published April 25, 2016. Accessed April 25, 2016.
- 27. Rohlfing T, Brandt R, Menzel R, Russakoff DB, Maurer CRJ. Quo vadis, atlas‐based segmentation? In: The handbook of biomedical image analysis. Volume III: registration models. Berlin: Springer; 2005. pp 435–486. [Google Scholar]
- 28. Aizenberg E. Elastix parameters for atlas‐based segmentation of carpal bones. http://elastix.bigr.nl/wiki/index.php/Par0041. Published April 25, 2016. Accessed April 25, 2016.
- 29. Bezdek JC. Pattern recognition with fuzzy objective function algorithms. Berlin: Springer; 1981. [Google Scholar]
- 30. Amiri M. Yashil's Fuzzy C‐Means Clustering MATLAB Toolbox Ver. 1.0. http://ce.sharif.edu/∼m_amiri/project/yfcmc/index.htm. Published June 23, 2003. Accessed February 12, 2016.
- 31. Bowes MA, Guillard G, Gill E, Vincent GR, Hensor E, Freeston JE, Vital EM, Bird P, Emery P, Conaghan PG. Novel quantification of MRI provides a more sensitive outcome measure than RAMRIS. In Proceedings of the ACR/ARHP Annual Meeting, Boston, Massachusetts, USA, 2014. Abstract 1178.
- 32. Bowes MA, Guillard G, Vincent GR, Freeston JE, Vital EM, Emery P, Conaghan PG. Quantitative MRI measurement of tenosynovitis demonstrates differing responses of synovitis and tenosynovitis after RA treatment. In Proceedings from the ACR/ARHP Annual Meeting, San Francisco, California, USA, 2015. Abstract 1314.
- 33. Conaghan PG, Østergaard M, Bowes MA, et al. Comparing the effects of tofacitinib, methotrexate and the combination, on bone marrow oedema, synovitis and bone erosion in methotrexate‐naive, early active rheumatoid arthritis: results of an exploratory randomised MRI study incorporating semiquantitative and quantitative techniques. Ann Rheum Dis 2016;75:1024–1033. [DOI] [PMC free article] [PubMed] [Google Scholar]


