

Abstract
At clinically relevant ixazomib concentrations, in vitro studies demonstrated that no specific cytochrome P450 (CYP) enzyme predominantly contributes to ixazomib metabolism. However, at higher than clinical concentrations, ixazomib was metabolized by multiple CYP isoforms, with the estimated relative contribution being highest for CYP3A at 42%. This multiarm phase 1 study (Clinicaltrials.gov identifier: NCT01454076) investigated the effect of the strong CYP3A inhibitors ketoconazole and clarithromycin and the strong CYP3A inducer rifampin on the pharmacokinetics of ixazomib. Eighty‐eight patients were enrolled across the 3 drug‐drug interaction studies; the ixazomib toxicity profile was consistent with previous studies. Ketoconazole and clarithromycin had no clinically meaningful effects on the pharmacokinetics of ixazomib. The geometric least‐squares mean area under the plasma concentration‐time curve from 0 to 264 hours postdose ratio (90%CI) with vs without ketoconazole coadministration was 1.09 (0.91‐1.31) and was 1.11 (0.86‐1.43) with vs without clarithromycin coadministration. Reduced plasma exposures of ixazomib were observed following coadministration with rifampin. Ixazomib area under the plasma concentration‐time curve from time 0 to the time of the last quantifiable concentration was reduced by 74% (geometric least‐squares mean ratio of 0.26 [90%CI 0.18‐0.37]), and maximum observed plasma concentration was reduced by 54% (geometric least‐squares mean ratio of 0.46 [90%CI 0.29‐0.73]) in the presence of rifampin. The clinical drug‐drug interaction study results were reconciled well by a physiologically based pharmacokinetic model that incorporated a minor contribution of CYP3A to overall ixazomib clearance and quantitatively considered the strength of induction of CYP3A and intestinal P‐glycoprotein by rifampin. On the basis of these study results, the ixazomib prescribing information recommends that patients should avoid concomitant administration of strong CYP3A inducers with ixazomib.
Keywords: multiple myeloma, ixazomib, drug‐drug interaction, pharmacokinetics, PBPK modeling, CYP3A
The oral proteasome inhibitor ixazomib is approved in the United States, the European Union, and other countries worldwide, in combination with lenalidomide (Revlimid) and dexamethasone (Rd), for the treatment of patients with multiple myeloma who have received at least 1 prior therapy.1, 2 Approval was based on the findings of the global, multicenter, double‐blind, placebo‐controlled, phase 3 TOURMALINE‐MM1 trial, which demonstrated superior progression‐free survival with ixazomib‐Rd compared to placebo‐Rd (median progression‐free survival of 20.6 vs 14.7 months; hazard ratio 0.74, P = .01), with limited toxicity associated with the addition of ixazomib to Rd.3
Ixazomib has been shown to be absorbed rapidly following oral administration4, 5 and has dose‐independent and time‐independent pharmacokinetics (PK).6 The clinical pharmacology of ixazomib was comprehensively evaluated during clinical development. Dedicated studies were conducted to examine the effect of food,7 severe renal impairment (including end‐stage renal disease requiring dialysis),8 and moderate or severe hepatic impairment on the PK of ixazomib,9 which showed that ixazomib systemic exposure was reduced under fed conditions, supporting ixazomib administration on an empty stomach, and elevated in these organ impairment settings, supporting use of a reduced starting dose for these patients.1, 2 Population PK analyses were performed to investigate the effect of age, body surface area, mild to moderate renal impairment, and mild hepatic impairment on ixazomib PK.6, 10 A concentration‐QTc analysis using data from 4 phase 1 studies showed that ixazomib does not prolong the QTc interval at clinically relevant exposures.11
Based on the results of a mass balance study, 62% of orally administered radiolabeled ixazomib was recovered in urine, with <3.5% of urinary excretion representing the parent drug, indicating that metabolism followed by urinary excretion of metabolites is the major clearance mechanism for ixazomib in humans.1, 12 In vitro studies indicate that ixazomib is metabolized by multiple cytochrome P450 (CYP) enzymes and non‐CYP enzymes. At clinically relevant ixazomib concentrations, in vitro studies using human cDNA‐expressed CYP isozymes showed that no specific CYP isozyme predominantly contributes to ixazomib metabolism. At higher than clinical concentrations, ixazomib was metabolized by multiple CYP isoforms with estimated relative contributions of 3A4 (42%), 1A2 (26%), 2B6 (16%), 2C8 (6%), 2D6 (5%), 2C19 (5%), and 2C9 (<1%).1 Enzyme kinetics of ixazomib metabolism have not been characterized. However, based on the in vitro data, it is conceivable that non‐CYP metabolism may represent a higher‐affinity process compared to CYP‐mediated metabolism. Because CYP3A was estimated to have the highest contribution among the CYP enzymes investigated, this multiarm PK drug‐drug interaction (DDI) study was conducted to determine the effect of the strong CYP3A inhibitors ketoconazole and clarithromycin and the strong CYP3A inducer rifampin on the PK of ixazomib. Additionally, a physiologically based pharmacokinetic (PBPK) model was developed to evaluate the plausibility of the observed substantial reduction in ixazomib exposure by the strong inducer rifampin in light of a minor overall contribution of CYP3A4 to ixazomib clearance based on minimal effects of strong CYP3A inhibitors on ixazomib systemic exposure. The results of this study were intended to provide guidance with regard to concomitant medication use during ixazomib administration.
Methods
Patients
Institutional review boards at all participating centers approved the study protocol and amendments. The trial was conducted in accordance with the Declaration of Helsinki and International Conference on Harmonisation Guideline for Good Clinical Practice and was registered at www.clinicaltrials.gov as NCT01454076. All patients provided written informed consent.
To be eligible for enrollment in the study, adult patients were required to have histologically or cytologically confirmed metastatic and/or advanced solid tumor malignancies or lymphoma for which no effective standard treatment was available, an Eastern Cooperative Oncology Group performance status of 0 or 1, an absolute neutrophil count ≥1.25 × 10⁹/L, and a platelet count >100 × 109/L (absolute neutrophil count ≥1.0 × 10⁹/L and platelet count >75 × 109/L for patients with lymphoma and an underlying malignant bone marrow involvement), total bilirubin <1.5 times the upper limit of the normal range, alanine transaminase and aspartate transaminase ≤2.5 times the upper limit of the normal range, and a calculated creatinine clearance >60 mL/min. Patients also had to have recovered from the reversible effects of prior anticancer therapy.
Patients were excluded if they had grade >2 peripheral neuropathy or any comorbid systemic illness or other severe concurrent disease that, in the judgment of the investigator, would have made the patient inappropriate for entry into the study or would have interfered significantly with the assessment of safety and/or toxicity. Patients were also excluded if they received any of the following before enrollment: systemic treatment with strong inhibitors of CYP1A2 or CYP3A, or strong CYP3A inducers, within 14 days; radiotherapy within 21 days; major surgery within 14 days; prior rituximab or other unconjugated antibody treatment within 42 days; any investigational products or systemic antineoplastic therapies within 21 days; autologous stem cell transplantation within 6 months; or allogeneic stem cell transplantation at any time. Patients were also prohibited from using moderate CYP1A2 or CYP3A inhibitors during cycle 1 (the PK cycle) of the study.
Study Design and Assessments
This was a multiarm DDI study for which the primary objective was to independently characterize the effect of ketoconazole, clarithromycin, and rifampin on the single‐dose PK of ixazomib. The secondary objective of the study was to characterize the safety and tolerability of oral ixazomib in patients with advanced solid tumors or lymphoma.
The ketoconazole DDI study used a fixed‐sequence design (Figure 1A). In cycle 1 (the PK cycle), patients received a single 2.5‐mg oral dose of ixazomib on day 1 and on day 15. Patients received ketoconazole at a dose of 400 mg once daily on days 12 through 25. Blood samples were collected at the following time points after the day 1 and day 15 doses of ixazomib for the measurement of plasma ixazomib concentrations: 0 (predose), 0.5, 1, 1.5, 2, 3, 4, 8, 24, 48, 72, 96, 120, 144, 168, 240, and 264 hours postdose. The primary end point of the study was the ratio of geometric mean maximum observed plasma concentration (Cmax) and area under the plasma concentration‐time curve from 0 to 264 hours postdose (AUC0‐264) for ixazomib with vs without ketoconazole coadministration.
Figure 1.
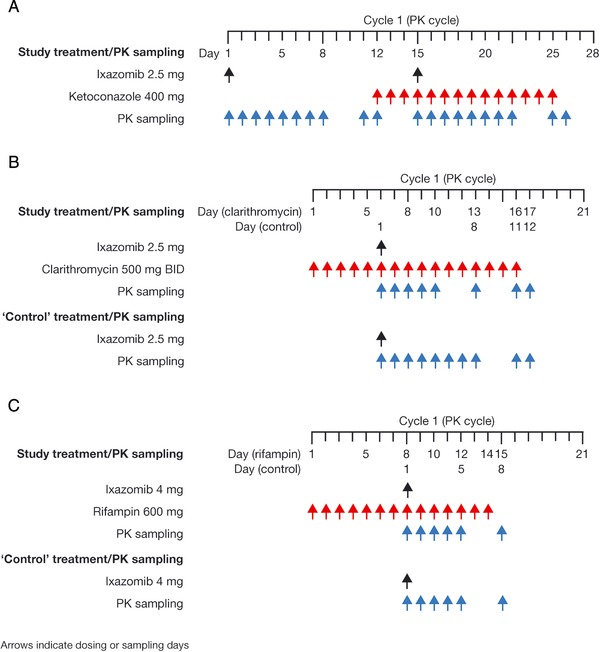
DDI study designs: study treatment and PK sampling during the PK cycle of the DDI study arms for (A) ketoconazole, (B) clarithromycin, and (C) rifampin. DDI indicates drug‐drug interaction; PK, pharmacokinetics.
In cycle 1 (the PK cycle) of the clarithromycin DDI study arm, patients received 500 mg of immediate‐release clarithromycin twice‐daily on days 1 to 16 (Figure 1B). After 5 days of clarithromycin pretreatment, patients received a single 2.5‐mg oral dose of ixazomib on day 6. Blood samples were collected at the following time points after ixazomib administration for the measurement of plasma ixazomib concentrations: 0 (predose), 0.5, 1, 1.5, 2, 3, 4, 8, 24, 48, 72, 96, 168, 240, and 264 hours postdose. The corresponding PK data collected from the PK‐evaluable patients in the ketoconazole DDI study following the first dose of ixazomib (ie, the day 1 dose of cycle 1 [period 1]) were used as the without‐clarithromycin reference condition. The primary end point of the clarithromycin DDI study was the ratio of geometric mean Cmax and AUC0‐264 for ixazomib with vs without clarithromycin coadministration.
In the rifampin DDI study arm, patients received 600 mg of rifampin once daily on days 1 to 14 of cycle 1 (Figure 1C). After 7 days of rifampin pretreatment, patients received a single 4‐mg oral dose of ixazomib on day 8. Blood samples were collected at the following time points after ixazomib administration for the measurement of plasma ixazomib concentrations: 0 (predose), 0.5, 1, 1.5, 2, 3, 4, 8, 24, 48, 72, 96, and 168 hours postdose. The corresponding PK data collected on day 1 from the PK‐evaluable patients in a separate arm of the present study, evaluating the relative bioavailability of 2 different capsule formulations of ixazomib after a 4‐mg dose,13 were used as the without‐rifampin reference condition. The primary end point of the rifampin DDI study was the ratio of geometric mean Cmax and the area under the plasma concentration‐time curve from time 0 to the time of the last quantifiable concentration (AUC0‐last) for ixazomib with vs without rifampin coadministration.
After completion of the PK cycle (cycle 1) in each DDI study arm, patients could continue in the study and receive 4 mg of ixazomib on days 1, 8, and 15 of each subsequent 28‐day cycle. Starting with cycle 4 and beyond, at the discretion of the investigator, patients had the option of escalating to a 5.3‐mg ixazomib dose. Patients could receive a maximum of 12 additional treatment cycles after cycle 1 unless it was determined that the patient would derive benefit from continued treatment. All doses of ixazomib were administered with the patient fasting from food and fluids, except for water and prescribed medications, for 2 hours before and for 1 hour after each dose. After the PK cycle (cycle 1), dose adjustments, interruptions, and/or delays were allowed based on clinical and laboratory findings, per prespecified dose modification guidelines.
Plasma concentrations of ixazomib were measured using a previously described, validated, liquid chromatography/tandem mass spectrometry assay with a dynamic range of 0.5 to 500 ng/mL.7, 9 Adverse events (AEs) were evaluated throughout the study and for up to 30 days after the last dose of ixazomib or the start of subsequent antineoplastic therapy. AEs were graded according to the National Cancer Institute Common Terminology Criteria for Adverse Events version 4.03.
Pharmacokinetic and Statistical Analyses
The PK‐evaluable population was defined as all patients who received the protocol‐specified doses of ixazomib and ketoconazole, clarithromycin, or rifampin during cycle 1 without dose reductions or interruptions, did not receive any excluded concomitant medication through the completion of PK sampling, and had sufficient concentration‐time data to permit the calculation of PK parameters by noncompartmental analysis methods. Patients who were not PK‐evaluable were replaced. The safety population comprised all patients who received at least 1 dose of any study drug (ie, ixazomib, ketoconazole, clarithromycin, or rifampin).
Plasma PK parameters for ixazomib were calculated using noncompartmental methods with Phoenix WinNonlin version 6.2 (Pharsight, St. Louis, Missouri). PK parameters were summarized using descriptive statistics.
For the estimation of the effect of ketoconazole on the PK of ixazomib, the ratios of geometric mean AUC and Cmax (with vs without ketoconazole) and the associated 90%CIs were calculated on the basis of the within‐patient variance calculated via a mixed‐effects ANOVA fitting terms for treatment. Patient was treated as a random effect in the model. After log transformation, AUC0‐264 and Cmax were separately analyzed. Point estimates and adjusted 90%CIs for the difference in treatment were calculated and then were exponentially back‐transformed to provide point and CI estimates for the ratios of interest. The effects of clarithromycin or rifampin on the PK of ixazomib were analyzed similarly; however, patient was not treated as a random effect in the ANOVA model for these study arms because they utilized a parallel‐group design.
Data from 2 separate arms of the present study,7, 13 in which a 2‐way crossover design was used with the same duration between ixazomib doses in the 2 periods as in the ketoconazole study arm, showed consistently higher ixazomib exposures in period 2 than those observed in period 1, indicating that the effect of ketoconazole on the PK of ixazomib was confounded by a period effect. To estimate the true effect of ketoconazole on the PK of ixazomib, a mixed‐effects ANOVA was conducted using pooled data from the ketoconazole DDI arm and the other 2 arms of the present study.7, 13
Physiologically Based Pharmacokinetic Modeling
A PBPK model was developed for ixazomib using the available physicochemical, in vitro, and clinical data. The PBPK model was developed using Simcyp version 15.1. The key input parameters of the ixazomib base and final models are summarized in Supplementary Table S1 and Supplementary Table S2, respectively.
The base model assumed first‐order absorption and in vitro reaction phenotyping data for ixazomib were initially used to assign the relative contribution of CYP3A (fmCYP3A4). The fmCYP3A4 value was subsequently refined using the clarithromycin DDI study data. Because ixazomib is a low‐affinity substrate of P‐glycoprotein (P‐gp),1 the final PBPK model incorporated an intestinal P‐gp component within the mechanistic absorption model. Intestinal CYP3A4 is inferred to not meaningfully contribute to presystemic metabolism of ixazomib, based on the lack of increase in Cmax during coadministration with the strong CYP3A inhibitors clarithromycin (geometric mean ratio of Cmax = 0.96) and ketoconazole (geometric mean ratio of Cmax = 1.01). Accordingly, intestinal CYP3A‐mediated metabolism was not considered in the PBPK model. The final PBPK model was then used to simulate the effects of ketoconazole, clarithromycin, and rifampin on the PK of ixazomib. The default Sim‐ketoconazole 400‐mg a day model within Simcyp version 15.1 was used with 1 modification: the lowest in vitro P‐gp Ki value of 0.42 μM determined in Caco‐2 cells using digoxin (1 μM) as the probe substrate was incorporated.14 The default SV‐clarithromycin model within Simcyp version 15.1 was used without any modification. The rifampin simulation used induction parameters from a previously reported rifampin model15 in which an Indmax value of 37.1 and an IndC50 value of 0.28 μM were used. This rifampin model was separately qualified against several CYP3A4 substrates with relatively low fmCYP3A4, including alfentanil, alprazolam, and zolpidem DDI data (data not shown).To incorporate the induction effect on intestinal P‐gp by rifampin, an intestinal P‐gp reference value of 4 in the ixazomib model was used. The assumed 4‐fold increase in intestinal P‐gp activity was based on in vivo studies in which duodenal biopsies were obtained from subjects treated with multiple doses of rifampin, and P‐gp expression was quantified by Western blotting.16, 17
For each DDI assessment, 10 virtual trials of 16 white subjects (age 23 to 86 years, proportion female = 0.44) were performed in the Simcyp Simulator using a modified Sim‐NEurCaucasian population to match the age distribution of the oncology population. The single modification was to change the default age distribution to account for the older age of the disease population used in the clinical studies compared to the default population settings. The dosing regimens in the virtual trials were identical to those used in the clinical studies.
Results
Patients and Treatment Exposure
A total of 88 patients were enrolled across the DDI studies, including 29 patients in the ketoconazole arm, 21 patients in the clarithromycin arm, and 18 and 20 patients in the test and reference groups, respectively, of the rifampin arm. The baseline demographics and patient characteristics across the study arms are summarized in Table 1. The most common cancer types across study arms were colorectal (27%), ovarian (13%), pancreatic (5%), and non‐small‐cell lung (5%) cancer.
Table 1.
Baseline Demographics and Disease Characteristics of the Safety Populations in Each DDI Study Arm
| Ketoconazole Arm (N = 29) | Clarithromycin Arm (N = 21) | Rifampin Arm (N = 38) | |
|---|---|---|---|
| Median age, y (range) | 64 (48‐79) | 60 (40‐78) | 62.5 (29‐81) |
| Male, n (%) | 12 (41) | 15 (71) | 19 (50) |
| Race, n (%)a | |||
| White | 22 (76) | 19 (90) | 32 (84) |
| Black | 5 (17) | 0 | 2 (5) |
| Asian | 0 | 1 (5) | 1 (3) |
| Other/not reported | 2 (6) | 1 (5) | 3 (8) |
| Median body weight, kg (range) | 77.7 (49.9‐123.2) | 78.8 (44.8‐121.4) | 71.3 (46.9‐109.3) |
| Disease type, n (%) | |||
| Colorectalb | 7 (24) | 7 (33) | 10 (26) |
| Ovarian | 7 (24) | 0 | 4 (11) |
| Endometrial | 1 (3) | 0 | 1 (3) |
| Esophageal | 0 | 0 | 1 (3) |
| Head and neck | 1 (3) | 0 | 1 (3) |
| Non‐small‐cell lung cancer | 1 (3) | 2 (10) | 1 (3) |
| Pancreatic | 0 | 1 (5) | 3 (8) |
| Prostate | 1 (3) | 0 | 1 (3) |
| Small‐cell lung cancer | 0 | 0 | 2 (5) |
| Uterine | 3 (10) | 0 | 0 |
| Otherc | 8 (28) | 11 (52) | 14 (37) |
| Disease stage, n (%)d | |||
| <IV | 2 (7) | 0 | 5 (13) |
| IV/IVA/IVB/IVC | 26 (90) | 20 (100) | 33 (87) |
| ECOG performance status, n (%)e | |||
| 0 | 8 (28) | 4 (21) | 12 (32) |
| 1 | 20 (69) | 14 (74) | 25 (66) |
| 2 | 1 (3) | 1 (5) | 0 |
| Median time since initial diagnosis, months (range) | 40 (10‐120) | 33 (3‐219) | 40.5 (4‐160) |
| Prior antineoplastic therapy, n (%) | 29 (100) | 21 (100) | 36 (95) |
| Prior radiation therapy, n (%) | 16 (55) | 11 (52) | 24 (63) |
| Prior surgical procedure, n (%) | 25 (86) | 18 (86) | 33 (87) |
The rifampin arm incorporated both a test (with rifampin, n = 18) and a reference (without rifampin, n = 20) group; the reference group was treated within a separate arm of the present study evaluating the relative bioavailability of 2 different capsule formulations of ixazomib.13
Not reported for 2 patients in the reference group of the rifampin arm.
Includes patients with colon cancer, rectal cancer, and colorectal cancer.
Other tumor types included adenocystic carcinoma, breast, cervical, gastric, intestinal, kidney, liver, lung cancer, melanoma, neuroendocrine carcinoma, perineural, recurrent pleomorphic adenoma (right submandibular gland), right parotid mucoepidermoid carcinoma, sarcoma, cancer of the thymus, urethral mass, and urothelial carcinoma metastasis to lung, all in 1 patient each.
Not available for 1 patient on the ketoconazole arm and for 1 patient on the clarithromycin arm.
Not available for 1 patient in the test group of the rifampin arm and for 2 patients in the clarithromycin arm.
DDI indicates drug‐drug interaction; ECOG, Eastern Cooperative Oncology Group.
At the data cutoff of August 4, 2014 for the ketoconazole and rifampin arms of the study, all patients in the ketoconazole arm had discontinued ixazomib treatment due to progressive disease (n = 14, 48%), AEs (n = 8, 28%), clinical progression/symptomatic deterioration (n = 4, 14%), or patient withdrawal (n = 3, 10%); nine patients (50%) in the test group of the rifampin arm had discontinued due to progressive disease (n = 8, 44%) or patient withdrawal (n = 1, 6%); the remaining 9 patients (50%) in the test group of the rifampin arm were ongoing on treatment. All patients in the reference group of the rifampin arm had discontinued study treatment due to disease progression (n = 15, 75%), patient withdrawal (n = 3, 15%), or AEs (n = 2, 10%).13 At the data cutoff for the clarithromycin arm of the study (April 27, 2015), prolonged follow‐up beyond the last patient completing the PK cycle (cycle 1) was not available; 2 patients (10%) discontinued treatment during cycle 1 without receiving ixazomib (both due to an AE).
Patients in the ketoconazole arm received a median of 2 cycles of ixazomib treatment (range 1‐19); 3 patients (10%) received ≥6 cycles. In the rifampin arm the median number of ixazomib treatment cycles was 2 (range 1‐7) for both the test and reference groups, with 1 (6%) and 2 (10%) patients receiving ≥6 cycles in the test and reference groups, respectively. In the clarithromycin arm of the study, 19 patients (90%) received ixazomib treatment beyond cycle 1.
Effect of Strong CYP3A Inhibitors on the PK of Ixazomib
Using a fixed‐sequence design, 16 PK‐evaluable patients received a single 2.5‐mg oral dose of ixazomib on day 1 of the PK cycle in the absence of ketoconazole (period 1) and on day 15 of the PK cycle in the presence of ketoconazole (period 2). Ketoconazole (400 mg) was administered once daily on days 12 to 25 of the PK cycle. When ixazomib was coadministered with ketoconazole in period 2, the geometric mean (%CV) AUC0‐264 value (1150 [46] h·ng/mL) was higher than the value observed when ixazomib was administered alone in period 1 (552 [33] h·ng/mL). The geometric least‐squares mean ratio (90%CI) for AUC0‐264 was 2.08 (1.91‐2.27). The geometric mean (%CV) Cmax values were similar in the presence and absence of ketoconazole: 39.3 (61) ng/mL and 39.0 (48) ng/mL, respectively (Table 2).
Table 2.
Plasma PK Parameters of Ixazomib With (Test Condition) and Without (Reference Condition) Coadministration of Ketoconazole, Clarithromycin, or Rifampin
| Arm/Parameter | Test Condition | Reference Condition | Geometric Least‐Squares Mean Ratio (90%CI) (Test/Reference) |
|---|---|---|---|
| Ketoconazole arm | N = 16 | N = 16 | … |
| Median Tmax, h (range) | 1.50 (0.50‐4.17) | 1.09 (0.47‐2.07) | … |
| Geometric mean Cmax, ng/mL (%CV) | 39.3 (61) | 39.0 (48) | 1.01 (0.78‐1.30) |
| Geometric mean AUC0‐264, h·ng/mL (%CV)a | N/A | N/A | 1.09 (0.91‐1.31) |
| Clarithromycin arm | N = 15 | N = 16 | … |
| Median Tmax, h (range) | 1 (0.42‐7.18) | 1.09 (0.47‐2.07) | … |
| Geometric mean Cmax, ng/mL (%CV) | 37.2 (50) | 39.0 (48) | 0.96 (0.67‐1.36) |
| Geometric mean AUC0‐264, h·ng/mL (%CV) | 613 (54) | 552 (33) | 1.11 (0.86‐1.43) |
| Rifampin arm | N = 16 | N = 14 | … |
| Median Tmax, h (range) | 1.45 (0.5‐4.12) | 1.49 (0.5‐7.5) | … |
| Geometric mean Cmax, ng/mL (%CV) | 25.7 (50) | 55.8 (57) | 0.46 (0.29‐0.73) |
| Geometric mean AUC0‐last, h·ng/mL (%CV) | 232 (50) | 907 (44) | 0.26 (0.18‐0.37) |
AUC0‐264 indicates area under the plasma concentration‐time curve from time 0 to 264 hours postdose; AUC0‐last, area under the plasma concentration‐time curve from time 0 to the time of the last quantifiable concentration; Cmax, maximum observed plasma concentration; N/A, not applicable; PK, pharmacokinetics; Tmax, time of first occurrence of Cmax
The values shown in this row are corrected for the period effect. The original values, not corrected for the period effect, were 1150 (46) and 552 (33) under the test condition and reference condition, respectively, with a geometric least‐squares mean ratio (90% CI) of 2.08 (1.91‐2.27).
Although higher ixazomib exposures were observed in period 2 in the presence of ketoconazole, the effect of ketoconazole on the PK of ixazomib was confounded by a period effect. Specifically, 2 separate arms of the present study, investigating the effect of food on ixazomib PK7 and the relative bioavailability of 2 capsule formulations,13 used a 2‐way crossover design with the same duration between ixazomib doses in the 2 periods as in the ketoconazole DDI study arm. In these 2 study arms,7, 13 ixazomib exposures in period 2 were consistently higher than those observed in period 1, with the estimated magnitude of the period effect (period 2 AUC vs period 1 AUC) being between 1.63‐ and 2.21‐fold. Therefore, in order to enable the estimation of the true effect of ketoconazole on the PK of ixazomib, a mixed‐effects ANOVA was conducted using pooled data from the ketoconazole DDI arm, the food effect study arm,7 and the relative bioavailability study arm.13 In this pooled analysis, terms were fitted for treatment, sequence, and period. The magnitude of the period effect in this pooled analysis (period 2 AUC vs period 1 AUC) was 1.91‐fold, which is similar to the observed period 2 (with ketoconazole) vs period 1 (without ketoconazole) AUC ratio of 2.08 from the ketoconazole DDI study. After accounting for this period effect, ketoconazole coadministration had no clinically meaningful effect on the PK of ixazomib. The geometric least‐squares mean AUC0‐264 ratio (90%CI) for ixazomib with vs without ketoconazole was 1.09 (0.91‐1.31) (Table 2).
In the clarithromycin DDI study arm, after 5 days of clarithromycin pretreatment (500 mg twice a day), 15 PK‐evaluable patients received a single 2.5‐mg, oral dose of ixazomib on day 6 of the PK cycle. Twice‐daily administration of clarithromycin continued on days 6 through 16. The PK data collected from the 16 PK‐evaluable patients in the ketoconazole DDI arm, following the first dose of ixazomib (ie, the day 1 dose of the PK cycle), were used as the without‐clarithromycin reference condition for the assessment of the effect of clarithromycin on the PK of ixazomib.
Plasma concentrations of ixazomib were similar in the presence and absence of clarithromycin (Figure 2). The geometric mean (%CV) AUC0‐264 value for ixazomib was 552 (33) h·ng/mL in the absence of clarithromycin, which was similar to the value observed in the presence of clarithromycin (613 [54] h·ng/mL). The geometric least‐squares mean ratio (90%CI) for AUC0‐264 was 1.11 (0.86‐1.43). The geometric mean (%CV) Cmax values for ixazomib with and without clarithromycin were 37.2 (50) ng/mL and 39.0 (48) ng/mL, respectively (Table 2). The corresponding geometric least‐squares mean ratio (90%CI) for Cmax was 0.96 (0.67‐1.36). Collectively, these data indicate that the PK of ixazomib is not meaningfully altered during coadministration with the strong CYP3A inhibitor clarithromycin.
Figure 2.
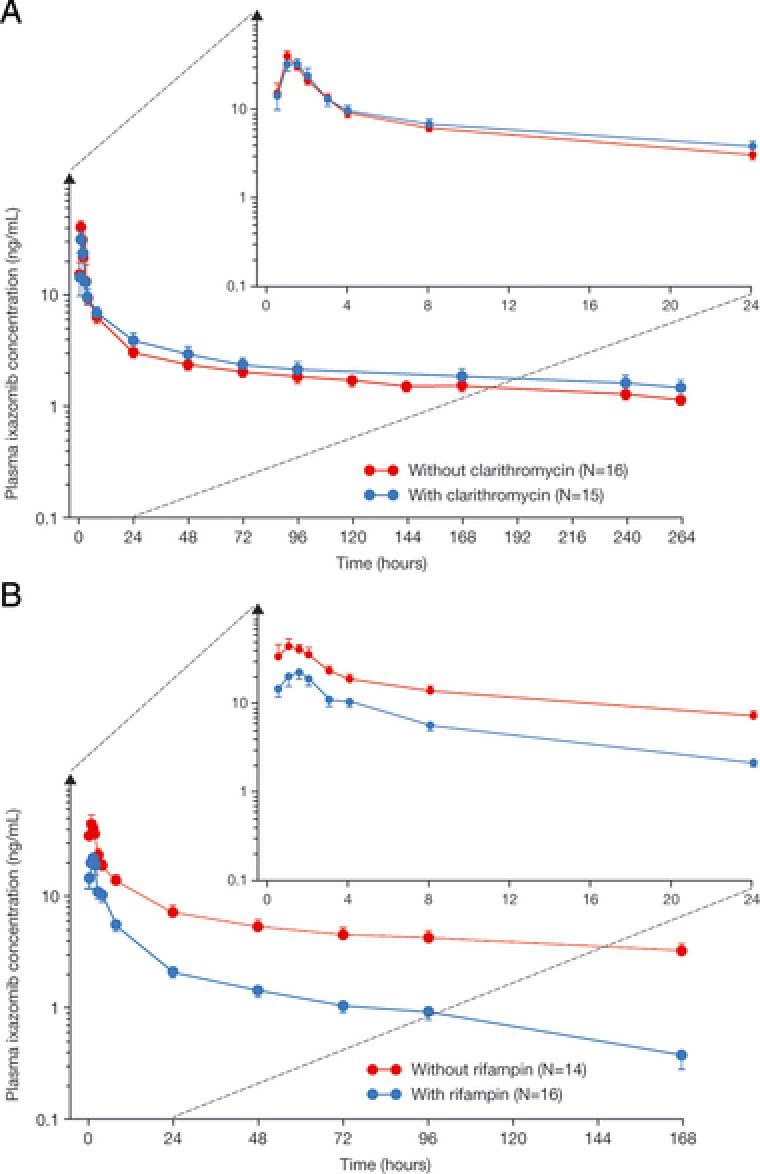
Mean (± SE) plasma ixazomib concentration‐time profiles (with insets showing the first 24 hours after dosing) with and without coadministration of (A) clarithromycin or (B) rifampin.
Effect of the Strong CYP3A Inducer Rifampin on the PK of Ixazomib
After 7 days of rifampin pretreatment (600 mg once daily), 16 PK‐evaluable patients received a single 4‐mg, oral dose of ixazomib on day 8 of the PK cycle. Administration of rifampin continued on days 8 to 14. The first‐dose PK data (ie, day 1 of the PK cycle) collected from the 14 PK‐evaluable patients in the separate arm of the study evaluating the relative bioavailability of 2 capsule formulations13 were used as the without‐rifampin reference condition for the purposes of assessing the effect of rifampin on the PK of ixazomib.
Rifampin coadministration resulted in lower plasma concentrations of ixazomib throughout the 168‐hour postdose interval (Figure 2). The geometric mean (%CV) AUC0‐last value for ixazomib was 907 (44) h·ng/mL without rifampin and decreased by approximately 74% to 232 (50) h·ng/mL with rifampin coadministration. The geometric mean (%CV) Cmax value for ixazomib was reduced from 55.8 (57) ng/mL in the absence of rifampin to 25.7 (50) ng/mL in the presence of rifampin (Table 2). The geometric least‐squares mean ratios (90%CI) for AUC0‐last and Cmax were 0.26 (0.18‐0.37) and 0.46 (0.29‐0.73), respectively.
Physiologically Based Pharmacokinetic Modeling Results
The fmCYP3A4 value in the final model was assigned using the observed clarithromycin DDI data. As the in vitro metabolism data and clinical DDI data with clarithromycin both suggested a minor contribution of CYP3A to the clearance of ixazomib, a series of simulations were performed with differing values of fmCYP3A4 in the range of 10% to 15%. An fmCYP3A4 value of 13% resulted in a predicted AUC ratio of 1.11, which was identical to the observed AUC ratio in the clarithromycin DDI study. Therefore, an fmCYP3A4 value of 13% was used in the final model. An intestinal P‐gp component was also included in the final PBPK model as in vitro data indicated that ixazomib was a low‐affinity substrate of P‐gp. The final PBPK model adequately predicted the PK of ixazomib after oral administration (Figure 3A, Table 3).
Figure 3.
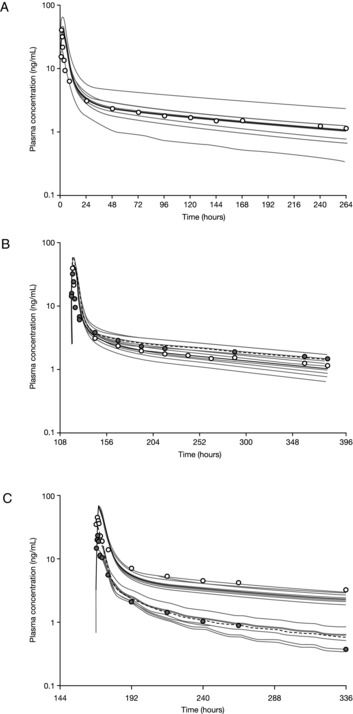
Physiologically based pharmacokinetic model‐predicted and observed mean plasma concentration‐time profiles for (A) ixazomib after oral administration of 2.5 mg; (B) ixazomib 2.5 mg with and without clarithromycin coadministration; and (C) ixazomib 4 mg with and without rifampin coadministration. (A) The gray lines represent the outcomes of simulated individual trials (10 trials each containing 16 patients). The solid black line represents the mean concentration‐time data for the simulated population (N = 160 patients). The open circles represent the observed mean concentration‐time data after day 1 administration of ixazomib in the ketoconazole DDI study. (B) Simulated (black lines; 10 trials each containing 16 patients) and observed (circles; data from the clarithromycin DDI study) mean plasma concentration‐time profiles of ixazomib after a single oral dose of 2.5 mg in the presence (dashed black line, filled circles) and absence (solid black line, open circles) of multiple daily doses of clarithromycin (500 mg twice daily for 16 days). The solid/dashed black lines represent the mean concentration‐time data for the simulated population (N = 160 patients). The gray lines represent the outcomes of simulated individual trials. (C) Simulated (black lines; 10 trials each containing 16 patients) and observed (circles; data from the rifampin DDI study) mean plasma concentration‐time profiles of ixazomib after a single oral dose of 4 mg in the presence (dashed black line, filled circles) and absence (solid black line, open circles) of multiple daily doses of rifampin (600 mg daily for 14 days). The solid/dashed black lines represent the mean concentration‐time data for the simulated population (N = 160 patients). The gray lines represent the outcomes of simulated individual trials. DDI indicates drug‐drug interaction.
Table 3.
Physiologically Based Pharmacokinetic Model‐Predicted and Observed PK Parameters for Ixazomib After Oral Administration of 2.5 mg
| Parameter | Observeda | Predicted |
|---|---|---|
| Median Tmax, h (range) | 1.09 (0.47‐2.07) | 1.98 (1.15‐3.05) |
| Geometric mean Cmax, ng/mL (%CV) | 39.0 (48) | 40.7 (32) |
| Geometric mean AUC0‐264, h·ng/mL (%CV) | 552 (33) | 617.4 (36) |
AUC0‐264 indicates area under the plasma concentration‐time curve from time 0 to 264 hours postdose; Cmax, maximum observed plasma concentration; PK, pharmacokinetic; Tmax, time of first occurrence of Cmax.
Observed values are after day‐1 administration of ixazomib in the ketoconazole DDI study.
The final PBPK model was then used to predict the effects of the strong CYP3A inhibitors clarithromycin (Figure 3B) and ketoconazole on the PK of ixazomib in order to determine if the model was able to adequately predict the observed clinical DDI study data. The model‐predicted geometric mean AUC ratio with vs without clarithromycin coadministration was 1.30 (Figure 4). Although this value is numerically higher than the observed geometric mean ratio of 1.11 in the clinical study, the predicted AUC ratio is contained within the 90%CI (0.86‐1.43) of the observed AUC ratio from the clinical study (Table 2). Similarly, the PBPK model was also able to adequately predict the effect of ketoconazole on the PK of ixazomib. The model‐predicted geometric mean AUC ratio with vs without ketoconazole was 1.25 (Figure 4). This value was contained within the 90%CI (0.91‐1.31) observed in the clinical DDI study with ketoconazole after accounting for the period effect (Table 2). Thus, the model predictions were consistent with the clinical DDI study results for these 2 strong inhibitors of CYP3A. The final model was also used to simulate clinical DDI studies with the additional strong CYP3A inhibitors ritonavir and itraconazole (Figure 4). The results provided further support for the lack of a clinically meaningful CYP3A inhibitor effect on the PK of ixazomib.
Figure 4.
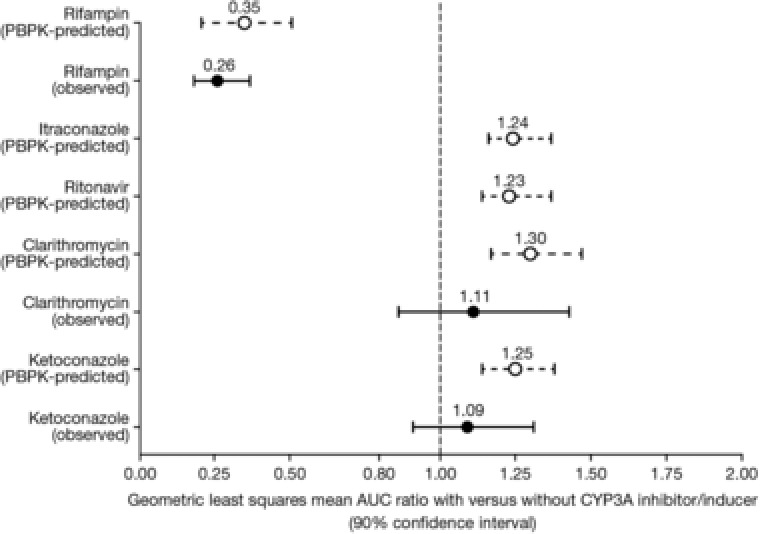
Physiologically based pharmacokinetic model‐predicted and observed geometric least‐squares mean AUC ratios for ixazomib with and without various strong CYP3A inhibitors and strong CYP3A inducers. For predicted data, error bars represent the 5th and 95th percentiles. AUC indicates area under the concentration‐time curve; CYP, cytochrome P450.
A rifampin DDI study was also simulated using the ixazomib PBPK model and previously reported induction parameters for rifampin.15 Figure 3C shows the model‐predicted and observed concentration‐time profiles of ixazomib with and without rifampin coadministration. The model predictions were generally consistent with the observed plasma ixazomib concentration‐time data. The model‐predicted geometric mean ratios for ixazomib Cmax and AUC with vs without rifampin coadministration were 0.43 and 0.35, respectively. These values were similar to the ratios observed in the clinical rifampin DDI study and were contained within the 90%CI for the geometric mean ratio for each parameter: Cmax, 0.29‐0.73; AUC, 0.18‐0.37 (Table 2). Therefore, the PBPK model was able to adequately predict the effect of rifampin on the PK of ixazomib (Figure 4).
Safety
All patients enrolled in the clinical DDI studies who received at least 1 dose of either ixazomib, ketoconazole, clarithromycin, or rifampin were included in the safety population. Table 4 presents a pooled summary of the safety data across all study arms as of the data cutoff date for each study. For the clarithromycin DDI study, safety data were only available for the PK cycle because of the absence of prolonged follow‐up after the PK cycle at the time of the data cutoff for this arm of the study.
Table 4.
Summary of Treatment‐Emergent Adverse Events and On‐Study Deaths Within Each of the DDI Study Arms and Overall
| Adverse Events, n (%) | Ketoconazole Arm (N = 29) | Clarithromycin Arm (N = 21)a | Rifampin Arm (N = 38) | Total (N = 88) |
|---|---|---|---|---|
| Any AE | 29 (100) | 16 (76) | 37 (97) | 82 (93) |
| Any drug‐related AE | 27 (93) | 4 (19) | 32 (84) | 63 (72) |
| Any grade ≥3 AE | 18 (62) | 2 (10) | 15 (39) | 35 (40) |
| Any drug‐related grade ≥3 AE | 10 (34) | 0 | 7 (18) | 17 (19) |
| Any serious AE | 12 (41) | 2 (10) | 7 (18) | 21 (24) |
| Any drug‐related serious AE | 3 (10) | 0 | 2 (5) | 5 (6) |
| AE leading to discontinuation | 8 (28) | 1 (5) | 4 (11) | 13 (15) |
| On‐study deaths | 2 (7) | 0 | 1 (3) | 3 (3) |
AE indicates adverse event; DDI, drug‐drug interaction.
Prolonged follow‐up beyond the last patient completing cycle 1 was not available; data are shown for AEs occurring in cycle 1 only.
Overall, 93% of patients enrolled across the 3 DDI study arms experienced at least 1 treatment‐emergent AE, and 72% of patients experienced a study drug‐related AE (Table 4). The most common study drug‐related AEs reported across the 3 study arms included nausea (n = 49, 56%), vomiting (n = 40, 45%), fatigue (n = 32, 36%), diarrhea (n = 28, 32%), decreased appetite (n = 15, 17%), asthenia (n = 13, 15%), dehydration (n = 12, 14%), and weight loss (n = 10, 11%). Grade ≥3 AEs were observed in 35 patients (40%), and study drug–related grade 3 AEs were reported in 17 patients (19%); there were no study drug‐related grade 4 AEs. The most common study drug‐related grade 3 AEs reported across the 3 study arms included fatigue (n = 9, 10%), diarrhea, nausea (each n = 3, 3%), thrombocytopenia, and vomiting (each n = 2, 2%).
Discussion
At clinically relevant ixazomib concentrations, in vitro studies indicated that no specific CYP isozyme predominantly contributes to ixazomib metabolism and that non‐CYP proteins/enzymes contribute to overall metabolism.1, 2 However, at concentrations exceeding those observed clinically, ixazomib was metabolized by multiple CYP isozymes with the estimated relative contribution being the highest for CYP3A4 (42%). Accordingly, this study examined the effect of the strong CYP3A inhibitors ketoconazole and clarithromycin and the strong CYP3A inducer rifampin on the PK of ixazomib.
The 3 DDI evaluations were conducted sequentially in this multiarm PK study with the effect of ketoconazole being investigated first using a fixed‐sequence design. Plasma exposures of ixazomib were higher in the second period of the study, in which ixazomib was administered in the presence of ketoconazole. However, these higher exposures were confounded by a period effect (partly associated with the long half‐life of ixazomib) that was also observed in the food effect7 and relative bioavailability13 studies, which used crossover study designs and the same ixazomib dosing schedule as the ketoconazole DDI study (ixazomib administration on days 1 and 15 of the PK cycle). After this period effect had been accounted for, the geometric least‐squares mean ratio (90%CI) for AUC0‐264 with vs without ketoconazole was 1.09 (0.91‐1.31), thereby indicating no clinically significant effect of ketoconazole on the PK of ixazomib.
The lack of a meaningful effect of strong CYP3A inhibitors on the PK of ixazomib was confirmed in the clarithromycin DDI study. Clarithromycin is a strong CYP3A inhibitor18, 19, 20, 21, 22, 23 that is also used as part of combination regimens for the treatment of multiple myeloma, such as the regimen comprised of clarithromycin, lenalidomide, and dexamethasone.24, 25 Therefore, the investigation of the effect of clarithromycin on the PK of ixazomib was of particular relevance given the potential for their concomitant use in patients with multiple myeloma. Coadministration of ixazomib with clarithromycin led to no apparent change in ixazomib total exposure, with geometric least‐squares mean ratios (90%CIs) for AUC0‐264 and Cmax of 1.11 (0.86‐1.43) and 0.96 (0.67‐1.36), respectively. Collectively, the clarithromycin and ketoconazole DDI study results indicate that the contribution of CYP3A to the apparent oral clearance of ixazomib is negligible and that no dose adjustment is necessary when ixazomib is coadministered with CYP3A inhibitors. The clarithromycin and ketoconazole DDI study findings are also consistent with the in vitro data at clinically relevant ixazomib concentrations, which indicated that no specific CYP isozyme predominantly contributes to ixazomib metabolism.
Ixazomib Cmax and AUC0‐last were reduced in the presence of rifampin by approximately 54% and 74%, respectively. Rifampin is a pleiotropic inducer of multiple pregnane X receptor–inducible drug‐metabolizing enzymes and transporters and is an established strong CYP3A inducer.18, 22, 26, 27 The observed reduction in ixazomib plasma exposures in the rifampin DDI study is likely explained by the increased collective contribution of pregnane X receptor–inducible enzymes and possibly P‐gp‐mediated efflux to the total clearance of ixazomib in the induced state. Furthermore, although the contribution of CYP3A to the overall clearance of ixazomib under baseline (uninduced) conditions is low, rifampin is a strong CYP3A inducer such that CYP3A‐mediated metabolism can be expected to be substantially induced during rifampin coadministration. This pronounced induction of CYP3A‐mediated metabolism causes a substantial increase in total clearance, thereby resulting in a clinically meaningful reduction in ixazomib systemic exposures upon strong CYP3A induction. Based on the results of the ixazomib‐rifampin DDI study, it is recommended that the concomitant administration of ixazomib with strong CYP3A inducers should be avoided.1, 2
The substantial decrease in systemic exposures of ixazomib during coadministration with the strong CYP3A inducer rifampin, despite the relatively small effects observed with the strong CYP3A inhibitors ketoconazole and clarithromycin (≤11% increase in AUC), was reconciled well by a PBPK model that incorporated a minor (13%) contribution of CYP3A to overall ixazomib clearance and quantitatively considered the strength of induction of CYP3A and intestinal P‐gp by rifampin. Although the model‐predicted geometric mean AUC ratios were numerically not identical to the clinically observed AUC ratios, the model‐predicted ratios were within the 90%CI for the observed ratio for each DDI study, demonstrating consistency of the model predictions with the clinical DDI study results. In addition, the PBPK modeling results are in agreement with the in vitro metabolism data at clinically relevant concentrations that indicated a minor role for CYP3A to ixazomib clearance.
The observation of clinically meaningful sensitivity to strong enzyme inducers, despite a minor contribution of the inducible enzyme and absence of clinically meaningful sensitivity to strong inhibitors, although apparently discordant, is not unprecedented and is consistent with enzyme kinetic principles of inhibition and induction DDIs. For example, although the contributions of CYP3A to the clearance of the tricyclic antidepressant nortriptyline and the antibiotic linezolid under baseline (uninduced) conditions are minor, induction of metabolism has been shown to produce clinically meaningful reductions in the exposures of these drugs.28, 29, 30, 31 Importantly, these clinical observations were reconciled well in translational investigations of these DDIs from first principles of multienzyme drug biotransformation kinetics in the case of nortriptyline32 and using PBPK modeling for linezolid.33 Another recent example of a similar apparent discordance between CYP3A inhibition and induction DDIs is the case of the vascular endothelial growth factor receptor inhibitor and investigational anticancer agent tivozanib.34 The results of ketoconazole and rifampin DDI studies with tivozanib are very similar to the results of the present DDI studies with ixazomib.34 Coadministration of steady‐state ketoconazole (400 mg/day) did not alter tivozanib AUC, with 90%CIs for the geometric mean ratios contained within the 80% to 125% equivalence range. In contrast, rifampin (600 mg/day) produced a 53% decrease in tivozanib AUC with a corresponding reduction in half‐life indicating increased systemic clearance of tivozanib upon strong CYP3A induction.34 The recent examples of tivozanib and ixazomib build on previous examples of a similar nature and reinforce generalizable lessons for assessing the risk for clinically relevant DDIs with inducers such as rifampin even when sensitivity to strong but selective CYP3A inhibition is low.35 The large extent of CYP3A induction by strong inducers such as rifampin, taken together with their pleiotropic mechanism of induction via engagement of upstream nuclear receptors that regulate expression of genes encoding multiple drug‐metabolizing enzymes and transporters, can lead to substantial, clinically meaningful reductions in victim drug exposure, even if the baseline contribution of CYP3A to its overall clearance is low, such that the effects of strong CYP3A inhibition are negligible. These principles are supported by a growing number of examples including the present report on ixazomib. More broadly, they have important implications for the translational assessment and management of DDI risk for investigational anticancer agents with enzyme inducers during clinical development, as well as implications for strategies for clinical DDI evaluation.36
The toxicity profile of ixazomib in these DDI studies was consistent with those seen in previous ixazomib studies,3, 4, 5, 7, 37, 38, 39 with no new safety issues observed. Gastrointestinal toxicities were among the most common AEs, with fatigue/asthenia, dehydration, and weight loss also among the drug‐related AEs occurring in ≥10% of patients. However, toxicities were generally of mild or moderate severity, with fatigue being the only drug‐related grade 3 AE occurring in >5% of patients overall.
Conclusions
In conclusion, the results of these DDI studies indicate that strong CYP3A inhibitors have no clinically meaningful effect on the PK of ixazomib and can therefore be coadministered without any ixazomib dose adjustments. Concomitant administration of ixazomib with strong CYP3A inducers should be avoided, as systemic exposures of ixazomib were significantly reduced by the pleiotropic strong inducer rifampin. These DDI study findings are reflected in the prescribing information for ixazomib.1, 2
Declaration of Competing Interests
Neeraj Gupta, Michael J. Hanley, Karthik Venkatakrishnan, Bingxia Wang, Guohui Liu, Chirag Patel, Cindy Xia, Xiaoquan Zhang, and Dixie‐Lee Esseltine are employees of Millennium Pharmaceuticals, Inc, Cambridge, MA, a wholly owned subsidiary of Takeda Pharmaceutical Company Limited. John Nemunaitis reports employment, ownership interests, and patents and royalties with Gradalis; honoraria from Amgen and AstraZeneca; membership in a speakers’ bureau for Amgen; and a consulting or advisory role for Gradalis and Amgen. Sunil Sharma reports stock or other ownership and patents, royalties, or other intellectual property with Salarius Pharmaceuticals and Beta Cat Pharmaceuticals; research funding from Millennium Pharmaceuticals, Inc, Cambridge, MA, a wholly owned subsidiary of Takeda Pharmaceutical Company Limited. Drew W. Rasco reports research funding from Millennium Pharmaceuticals, Inc, Cambridge, MA, a wholly owned subsidiary of Takeda Pharmaceutical Company Limited. Alice Ke and Karen Rowland Yeo are employees of Certara USA, Inc, Princeton, NJ, USA. Alberto Bessudo and Bert H. O'Neil have no conflicts of interest to declare.
Supporting information
Supplementary Table S1. Input parameter values used to simulate the kinetics of ixazomib in the base physiologically‐based pharmacokinetic model
Supplementary Table S2. ADAM Module input parameter values used to simulate the kinetics of ixazomib in the final physiologically‐based pharmacokinetic model
Acknowledgments
This work was funded by Millennium Pharmaceuticals, Inc, Cambridge, MA, a wholly owned subsidiary of Takeda Pharmaceutical Company Limited. Writing support during the development of the manuscript was provided by Steve Hill of FireKite, an Ashfield company, part of UDG Healthcare plc, which was funded by Millennium Pharmaceuticals, Inc and complied with Good Publication Practice 3 ethical guidelines.40
This work has been presented at the following meetings:
Poster presented at the 2013 Annual Meeting of the American Society of Clinical Oncology (ASCO), Chicago, IL, USA, May 31‐June 4, 2013 (ketoconazole arm).
Poster presented at the 2015 AACR‐NCI‐EORTC Molecular Targets and Cancer Therapeutics Conference, Boston, MA, USA, November 5‐9, 2015 (rifampin arm).
References
- 1. Millennium Pharmaceuticals Inc . NINLARO® (ixazomib) capsules, for oral use. Prescribing information, November 2016. http://www.ninlaro.com/downloads/prescribing-information.pdf. Accessed April 13, 2017.
- 2. Takeda Pharma A/S. NINLARO® European Public Assessment Report—Product Information . http://www.ema.europa.eu/docs/en_GB/document_library/EPAR_-_Product_Information/human/003844/WC500217620.pdf. Accessed December 15, 2016.
- 3. Moreau P, Masszi T, Grzasko N, et al. Oral ixazomib, lenalidomide, and dexamethasone for multiple myeloma. N Engl J Med. 2016;374(17):1621–1634. [DOI] [PubMed] [Google Scholar]
- 4. Kumar SK, Bensinger WI, Zimmerman TM, et al. Phase 1 study of weekly dosing with the investigational oral proteasome inhibitor ixazomib in relapsed/refractory multiple myeloma. Blood. 2014;124(7):1047–1055. [DOI] [PMC free article] [PubMed] [Google Scholar]
- 5. Richardson PG, Baz R, Wang M, et al. Phase 1 study of twice‐weekly ixazomib, an oral proteasome inhibitor, in relapsed/refractory multiple myeloma patients. Blood. 2014;124(7):1038–1046. [DOI] [PMC free article] [PubMed] [Google Scholar]
- 6. Gupta N, Zhao Y, Hui AM, Esseltine DL, Venkatakrishnan K. Switching from body surface area‐based to fixed dosing for the investigational proteasome inhibitor ixazomib: a population pharmacokinetic analysis. Br J Clin Pharmacol. 2014;79(5):789–800. [DOI] [PMC free article] [PubMed] [Google Scholar]
- 7. Gupta N, Hanley MJ, Venkatakrishnan K, et al. The effect of a high‐fat meal on the pharmacokinetics of ixazomib, an oral proteasome inhibitor, in patients with advanced solid tumors or lymphoma. J Clin Pharmacol. 2016;56(10):1288–1295. [DOI] [PMC free article] [PubMed] [Google Scholar]
- 8. Gupta N, Hanley MJ, Harvey RD, et al. A pharmacokinetics and safety phase 1/1b study of oral ixazomib in patients with multiple myeloma and severe renal impairment or end‐stage renal disease requiring haemodialysis. Br J Haematol. 2016;174(5):748–759. [DOI] [PMC free article] [PubMed] [Google Scholar]
- 9. Gupta N, Hanley MJ, Venkatakrishnan K, et al. Pharmacokinetics of ixazomib, an oral proteasome inhibitor, in solid tumour patients with moderate or severe hepatic impairment. Br J Clin Pharmacol. 2016;82(3):728–738. [DOI] [PMC free article] [PubMed] [Google Scholar]
- 10. Gupta N, Diderichsen PM, Hanley MJ, et al. Population pharmacokinetic analysis of ixazomib, an oral proteasome inhibitor, including data from the phase III TOURMALINE‐MM1 study to inform labelling. Clin Pharmacokinet. e‐pub ahead of print; https://doi.org/10.1007/s40262-017-0526-4. 2017. [DOI] [PMC free article] [PubMed] [Google Scholar]
- 11. Gupta N, Huh Y, Hutmacher MM, et al. Integrated nonclinical and clinical risk assessment of the investigational proteasome inhibitor ixazomib on the QTc interval in cancer patients. Cancer Chemother Pharmacol. 2015;76(3):507–516. [DOI] [PubMed] [Google Scholar]
- 12. Gupta N, Zhang S, Pusalkar S, et al. A phase 1 mass balance study of ixazomib, an oral proteasome inhibitor (PI), using accelerator mass spectrometry (AMS) in patients with advanced solid tumors [abstract]. Clin Pharmacol Ther. 2017;101:Abstract 615. [Google Scholar]
- 13. Hanley MJ, Gupta N, Venkatakrishnan K, et al. Phase I study to assess the relative bioavailability of two capsule formulations of ixazomib, an oral proteasome inhibitor, in patients with advanced solid tumors or lymphoma [abstract]. Clin Pharmacol Ther. 2016;99:Abstract PII‐023. [DOI] [PubMed] [Google Scholar]
- 14. Kishimoto W, Ishiguro N, Ludwig‐Schwellinger E, Ebner T, Schaefer O. In vitro predictability of drug‐drug interaction likelihood of P‐glycoprotein‐mediated efflux of dabigatran etexilate based on [I]2/IC50 threshold. Drug Metab Dispos. 2014;42(2):257–263. [DOI] [PubMed] [Google Scholar]
- 15. Yamashita F, Sasa Y, Yoshida S, et al. Modeling of rifampicin‐induced CYP3A4 activation dynamics for the prediction of clinical drug‐drug interactions from in vitro data. PLoS One. 2013;8(9):e70330. [DOI] [PMC free article] [PubMed] [Google Scholar]
- 16. Greiner B, Eichelbaum M, Fritz P, et al. The role of intestinal P‐glycoprotein in the interaction of digoxin and rifampin. J Clin Invest. 1999;104(2):147–153. [DOI] [PMC free article] [PubMed] [Google Scholar]
- 17. Westphal K, Weinbrenner A, Zschiesche M, et al. Induction of P‐glycoprotein by rifampin increases intestinal secretion of talinolol in human beings: a new type of drug/drug interaction. Clin Pharmacol Ther. 2000;68(4):345–355. [DOI] [PubMed] [Google Scholar]
- 18. European Medicines Agency Committee for Human Medicinal Products . Guideline on the investigation of drug interactions. http://www.ema.europa.eu/docs/en_GB/document_library/Scientific_guideline/2012/07/WC500129606.pdf. Accessed February 15, 2017.
- 19. Gorski JC, Jones DR, Haehner‐Daniels BD, et al. The contribution of intestinal and hepatic CYP3A to the interaction between midazolam and clarithromycin. Clin Pharmacol Ther. 1998;64(2):133–143. [DOI] [PubMed] [Google Scholar]
- 20. Gurley B, Hubbard MA, Williams DK, et al. Assessing the clinical significance of botanical supplementation on human cytochrome P450 3A activity: comparison of a milk thistle and black cohosh product to rifampin and clarithromycin. J Clin Pharmacol. 2006;46(2):201–213. [DOI] [PMC free article] [PubMed] [Google Scholar]
- 21. Quinney SK, Haehner BD, Rhoades MB, et al. Interaction between midazolam and clarithromycin in the elderly. Br J Clin Pharmacol. 2008;65(1):98–109. [DOI] [PMC free article] [PubMed] [Google Scholar]
- 22. US Food and Drug Administration Center for Drug Evaluation and Research (CDER) . Guidance for Industry—Drug Interaction Studies—Study Design, Data Analysis, Implications for Dosing, and Labeling Recommendations. http://www.fda.gov/downloads/Drugs/Guidances/ucm292362.pdf. Accessed February 15, 2017.
- 23. Yeates RA, Laufen H, Zimmermann T. Interaction between midazolam and clarithromycin: comparison with azithromycin. Int J Clin Pharmacol Ther. 1996;34(9):400–405. [PubMed] [Google Scholar]
- 24. Gay F, Rajkumar SV, Coleman M, et al. Clarithromycin (Biaxin)‐lenalidomide‐low‐dose dexamethasone (BiRd) versus lenalidomide‐low‐dose dexamethasone (Rd) for newly diagnosed myeloma. Am J Hematol. 2010;85(9):664–669. [DOI] [PMC free article] [PubMed] [Google Scholar]
- 25. Niesvizky R, Jayabalan DS, Christos PJ, et al. BiRD (Biaxin [clarithromycin]/Revlimid [lenalidomide]/dexamethasone) combination therapy results in high complete‐ and overall‐response rates in treatment‐naive symptomatic multiple myeloma. Blood. 2008;111(3):1101–1109. [DOI] [PubMed] [Google Scholar]
- 26. Backman JT, Olkkola KT, Neuvonen PJ. Rifampin drastically reduces plasma concentrations and effects of oral midazolam. Clin Pharmacol Ther. 1996;59(1):7–13. [DOI] [PubMed] [Google Scholar]
- 27. Gorski JC, Vannaprasaht S, Hamman MA, et al. The effect of age, sex, and rifampin administration on intestinal and hepatic cytochrome P450 3A activity. Clin Pharmacol Ther. 2003;74(3):275–287. [DOI] [PubMed] [Google Scholar]
- 28. Blassmann U, Roehr AC, Frey OR, et al. Decreased linezolid serum concentrations in three critically ill patients: clinical case studies of a potential drug interaction between linezolid and rifampicin. Pharmacology. 2016;98(1‐2):51–55. [DOI] [PubMed] [Google Scholar]
- 29. Hoyo I, Martinez‐Pastor J, Garcia‐Ramiro S, et al. Decreased serum linezolid concentrations in two patients receiving linezolid and rifampicin due to bone infections. Scand J Infect Dis. 2012;44(7):548–550. [DOI] [PubMed] [Google Scholar]
- 30. Self T, Corley CR, Nabhan S, Abell T. Case report: interaction of rifampin and nortriptyline. Am J Med Sci. 1996;311(2):80–81. [DOI] [PubMed] [Google Scholar]
- 31. von Bahr C, Steiner E, Koike Y, Gabrielsson J. Time course of enzyme induction in humans: effect of pentobarbital on nortriptyline metabolism. Clin Pharmacol Ther. 1998;64(1):18–26. [DOI] [PubMed] [Google Scholar]
- 32. Venkatakrishnan K, von Moltke LL, Greenblatt DJ. Nortriptyline E‐10‐hydroxylation in vitro is mediated by human CYP2D6 (high affinity) and CYP3A4 (low affinity): implications for interactions with enzyme‐inducing drugs. J Clin Pharmacol. 1999;39(6):567–577. [DOI] [PubMed] [Google Scholar]
- 33. Gandelman K, Zhu T, Fahmi OA, et al. Unexpected effect of rifampin on the pharmacokinetics of linezolid: in silico and in vitro approaches to explain its mechanism. J Clin Pharmacol. 2011;51(2):229–236. [DOI] [PubMed] [Google Scholar]
- 34. Cotreau MM, Siebers NM, Miller J, Strahs AL, Slichenmyer W. Effects of ketoconazole or rifampin on the pharmacokinetics of tivozanib hydrochloride, a vascular endothelial growth factor receptor tyrosine kinase inhibitor. Clin Pharmacol Drug Dev. 2015;4(2):137–142. [DOI] [PubMed] [Google Scholar]
- 35. Venkatakrishnan K. DDI risk assessment and evaluation in clinical development: interfacing drug metabolism and clinical pharmacology In: Lyubimov A, ed. Encyclopedia of Drug Metabolism and Interactions. Hoboken, NJ: John Wiley & Sons; 2012. https://doi.org/10.1002/9780470921920.edm118. Accessed February 15, 2017. [Google Scholar]
- 36. Venkatakrishnan K, Pickard MD, von Moltke LL. A quantitative framework and strategies for management and evaluation of metabolic drug‐drug interactions in oncology drug development: new molecular entities as object drugs. Clin Pharmacokinet. 2010;49(11):703–727. [DOI] [PubMed] [Google Scholar]
- 37. Gupta N, Goh YT, Min CK, et al. Pharmacokinetics and safety of ixazomib plus lenalidomide‐dexamethasone in Asian patients with relapsed/refractory myeloma: a phase 1 study. J Hematol Oncol. 2015;8:103. [DOI] [PMC free article] [PubMed] [Google Scholar]
- 38. Kumar SK, Berdeja JG, Niesvizky R, et al. Safety and tolerability of ixazomib, an oral proteasome inhibitor, in combination with lenalidomide and dexamethasone in patients with previously untreated multiple myeloma: an open‐label phase 1/2 study. Lancet Oncol. 2014;15(13):1503–1512. [DOI] [PubMed] [Google Scholar]
- 39. Merlini G, Sanchorawala V, Zonder JA, et al. Long‐term outcome of a phase 1 study of the investigational oral proteasome inhibitor (PI) ixazomib at the recommended phase 3 dose (RP3D) in patients (pts) with relapsed or refractory systemic light‐chain (AL) amyloidosis (RRAL) [abstract]. Blood. 2014;124:3450.25293779 [Google Scholar]
- 40. Battisti WP, Wager E, Baltzeret L, et al. Good publication practice for communicating company‐sponsored medical research: GPP3. Ann Intern Med. 2015;163:461–464. [DOI] [PubMed] [Google Scholar]
Associated Data
This section collects any data citations, data availability statements, or supplementary materials included in this article.
Supplementary Materials
Supplementary Table S1. Input parameter values used to simulate the kinetics of ixazomib in the base physiologically‐based pharmacokinetic model
Supplementary Table S2. ADAM Module input parameter values used to simulate the kinetics of ixazomib in the final physiologically‐based pharmacokinetic model