Abstract
Purpose
The homeostasis of intracranial pressure (ICP) is of paramount importance for maintaining normal brain function. A noninvasive technique capable of making direct measurements of ICP currently does not exist. MR elastography (MRE) is capable of noninvasively measuring brain tissue stiffness in vivo, and may act as a surrogate to measure ICP. The objective of this study was to investigate the impact of changing ICP on brain stiffness using MRE in a swine model.
Methods
Baseline MRE measurements were obtained, and then catheters were surgically placed into the left and right lateral ventricles of three animals. ICP was systematically increased over the range of 0 to 55 millimeters mercury (mmHg), and stiffness measurements were made using brain MRE at vibration frequencies of 60 hertz (Hz), 90 Hz, 120 Hz, and 150 Hz.
Results
A significant linear correlation between stiffness and ICP in the cross‐subject comparison was observed for all tested vibrational frequencies (P ≤ 0.01). The 120 Hz (0.030 ± 0.004 kilopascal (kPa)/mmHg, P < 0.0001) and 150 Hz (0.031 ± 0.008 kPa/mmHg, P = 0.01) vibrational frequencies had nearly identical slopes, which were approximately two‐ to three‐fold higher than the 90 Hz (0.017 ± 0.002 kPa/mmHg, P < 0.0001) and 60 Hz (0.009 ± 0.002 kPa/mmHg, P = 0.001) slopes, respectively.
Conclusion
In this study, MRE demonstrated the potential for noninvasive measurement of changes in ICP. Magn Reson Med 79:1043–1051, 2018. © 2017 The Authors Magnetic Resonance in Medicine published by Wiley Periodicals, Inc. on behalf of International Society for Magnetic Resonance in Medicine. This is an open access article under the terms of the Creative Commons Attribution‐NonCommercial‐NoDerivs License, which permits use and distribution in any medium, provided the original work is properly cited, the use is non‐commercial and no modifications or adaptations are made.
Keywords: intracranial pressure, magnetic resonance elastography, brain stiffness, viscoelasticity
INTRODUCTION
The homeostasis of intracranial pressure (ICP) is of paramount importance for maintaining normal brain function. Several pathological conditions can lead to a loss of homeostasis that results in elevated ICP. High levels of ICP can compress important brain regions, specifically the brain stem, triggering high‐risk side effects such as abnormal breathing, cardiovascular stress, and potentially death. Maintaining normal ICP is of utmost importance for patient care, including postsurgical monitoring in patients with neurosurgical conditions. Currently, a noninvasive method for measuring and monitoring ICP does not exist.
A lumbar puncture (LP) is a valuable diagnostic tool that can be used to measure ICP. During the procedure, cerebral spinal fluid (CSF) samples also can be obtained for treatment planning; however, medical conditions such as obstructive hydrocephalus can contraindicate performing a LP. Hydrocephalus is a common condition that results from the obstruction of CSF flow or resorption. However, different types of hydrocephalus exist, which look similar radiologically but are caused by different mechanisms. For instance, obstructive or noncommunicating hydrocephalus results from the blockage of CSF flow anywhere from the foramen of Monro to the outlet foramina of the fourth ventricle. Common causes include benign and malignant tumors, aqueductal stenosis, and hematomas. Communicating hydrocephalus, however, may develop following meningitis, subarachnoid hemorrhage, or idiopathic causes such as normal pressure hydrocephalus, which allow a LP to be performed safely. The hallmark of hydrocephalus is increased volume of CSF associated with enlarged ventricles. Increased CSF volume often elevates ICP. A noninvasive method to measure ICP could significantly improve patient care.
Several groups have investigated the role of MR elastography (MRE), a noninvasive quantitative stiffness imaging technique capable of measuring the viscoelastic properties of tissues in vivo, for the diagnosis of neurological diseases. The MRE approach requires an external source of vibration to generate shear waves within the tissue of interest. The displacement field generated by the shear waves is imaged with MR phase‐contrast sequences. Finally, displacement fields are converted into quantitative stiffness maps through mathematical inversion techniques 1. MRE techniques estimate a map of the absolute shear modulus (stiffness) of the brain in kilopascal (kPa), which have shown to significantly change in brain tumors 2, 3, normal pressure hydrocephalus 4, 5, multiple sclerosis 6, 7, and different types of dementia 8, 9. Furthermore, groups have established baseline measurements of brain stiffness in healthy volunteer populations by investigating cross‐sectional changes in brain viscoelasticity with respect to age and sex 10, 11, 12.
Recently, a study has reported that MRE stiffness is sensitive to changes due to altered venous drainage during jugular compression 13, which the authors suggest are due to neurovascular pressure changes in the brain. The authors were not able to report that jugular compression resulted in an increase in brain stiffness, but instead reported that volunteers who do not divert venous blood through extrajugular pathways have higher brain stiffness than those who do. The hypothesis of our study is that changing ICP alters the biomechanics or effective viscoelasticity of brain parenchyma, and brain stiffness may serve as a surrogate to ICP. Therefore, the objective of this study was to establish a swine model to investigate the relationship between acute changes in ICP and brain stiffness as measured with MRE.
METHODS
This study was approved by our Institutional Animal Care and Use Committee. Four domestic swine (Manthei Hog Farm, LLC, Rochester, Minnesota, USA) were used for the investigation of this study (35 ± 3 kg). The first animal was used to determine the optimal MRE baseline parameters without undergoing any surgery. In the other three animals, the relationship between stiffness and ICP was investigated by increasing ICP through two surgically implanted catheters while monitoring acute stiffness changes with MRE.
Presurgical MR Imaging
For surgical planning, a MRI‐compatible stereotactic frame with a nine fiducial marker localizer box 14, 15 was mechanically attached with screws to the porcine skull. This stereotactic frame subsequently was used as the platform to couple the source of vibration or driver to the skull to generate shear waves within the brain. With the frame attached, an anatomical T1‐weighted 3D magnetization‐prepared rapid gradient‐echo sequence was obtained for surgical planning and catheter targeting. Imaging was performed on a 3T closed‐bore MRI scanner (GE, Signa HDx, Waukesha, Wisconsin, USA) with the following imaging parameters: repetition time (TR) = 8 ms; echo time (TE) = 3.3 ms; slice thickness = 0.6 mm; number of excitations = 3; matrix size = 320 × 320; field of view (FOV) = 24 cm; and acquisition time = 6 min, with a custom‐made four‐channel receive‐only surface coil placed on the top of the pig's head within the stereotactic frame, as previously described 15.
Following anatomical imaging, and within the same scan session, MRE was performed to measure baseline brain stiffness presurgery at a range of vibration frequencies. MRE was conducted at 60 hertz (Hz), 90 Hz, 120 Hz, and 150 Hz vibration frequencies; and the image acquisition included a modified spin‐echo echo‐planar imaging sequence with the following parameters: TR/TE = 3,600 to 3,800/46 to 62 ms; FOV = 24 cm; matrix size = 72 × 72; 35 contiguous 3‐mm‐thick axial slices; vibration frequency matched motion‐encoding gradient; motion‐encoding in all three directions; and eight‐phase offsets. MRE postprocessing involved: 1) applying a [5 × 5 × 5] quartic smoothing kernel 16, 2) calculating the curl of the displacement images, and 3) calculating the stiffness with a previously described amplitude squared weighted direct inversion algorithm 1, 17, which can be described mathematically as:
where G* is the complex shear modulus; ρ is the tissue density (assumed to be 1,000 kg/m3); ω is the angular velocity of the vibration; u is the 3D (3 × 1) displacement vector of a single voxel; ∇2 is the 3D Laplace operator; and † is the pseudo inverse. This is derived from solving a system of simultaneous linear equations—one for each sensitization direction—for the quantity 1/µ, and is equivalent to least‐squares fitting, assuming no noise in the displacement. It also is equivalent to amplitude‐squared weighting of separate 1/µ results for each sensitization direction. Stiffness over the entire brain volume was reported as the median magnitude of the complex shear modulus |G*|, where G* is defined as a complex number with real part equal to the storage shear modulus (G′) and imaginary part equal to the loss shear modulus (G″).
Surgical Catheter Placement
To simultaneously monitor and be able to intermittently increase ICP, silicon 1.5‐mm lumen pediatric catheters (BACTISEAL EVD, Codman, Raynham, Massachusetts, USA) were implanted in the left and right lateral ventricles of the animals using a procedure similar to that previously described for an intraparenchymal drug‐delivery system technique by MR image‐guided stereotactic targeting 18. Briefly, this technique involves three steps: 1) an MRI‐compatible stereotactic frame with a nine fiducial marker localizer box 14, 15 was mechanically attached with screws to the porcine skull; 2) a high‐resolution T1‐weighted anatomical MRI of the pig brain with the stereotactic frame was acquired; 3) the DICOM image data was then transferred to a stereotactic planning computer for catheter projection planning.
Two burr holes were made through the skull for catheter placement. To secure a tight seal and minimize CSF leak, the burr holes were minimized to be ∼8 mm, with an internal groove in the bone layer. Dental etch was used on top of the dry skull surface around the burr holes. Four to five titanium skull screws (3 mm) were used around the burr holes and etch layer. Then, a dental cement was used to secure the pediatric catheters to the skull (Fig. 1A). Unique to this study, a catheter was placed in both the left and right ventricles of the brain (Fig. 1B). Communication between the two catheters was confirmed during surgery by attaching a saline drip to one catheter and draining CSF from the other catheter. An inline pressure monitor was then connected to the drainage line to continuously monitor pressure throughout the experiment (Fig. 2). Prior to postsurgical imaging, the baseline was measured to be 0 millimeters mercury (mmHg) in the first two pigs and 28 mmHg in the third pig. In the third pig, free communication between the ventricles did not occur, which resulted in the higher baseline pressure. Sedation was maintained with 1.5% to 3% isoflurane during surgery and 1.5% to 1.75% isoflurane during the experiments. Vital signs continuously were monitored throughout the procedures.
Figure 1.
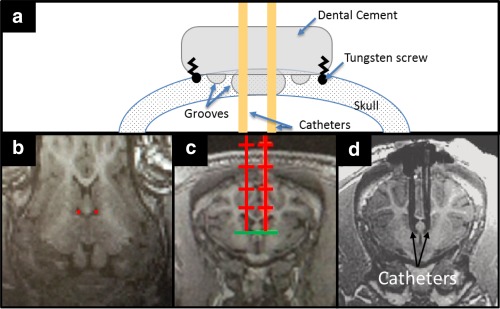
(A) Schematic diagram of surgical dental cement cap and catheter placement through the skull. (B‐D) Catheter trajectory planning using high‐resolution T1‐weighted images. (B) Oblique‐coronal and (C) axial reconstructed image of pig brain, with the prescribed catheter placements shown in red. (D) Postsurgical axial reconstructed image after catheter placement. One catheter was used to increase ICP, whereas the other catheter was used to continuously monitor ICP.
ICP, intracranial pressure.
Figure 2.
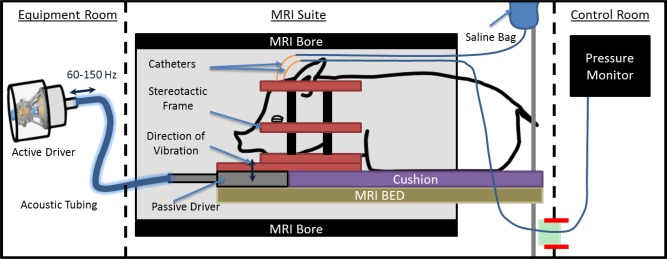
MRI schematic diagram of postsurgical MR elastography, imaging, and pressure‐monitoring setup.
Hz, hertz.
Postsurgical MR Imaging
Following surgery, to measure brain stiffness as a function of ICP, the anesthetized animal with the stereotactic frame in place was repositioned within the MRI bore. The inline pressure monitor was kept outside the scanner room and connected by a drainage line that traveled through the waveguide of the scanner and attached to one of the pediatric catheters. The second catheter was connected to a saline bag kept inside the scanner room on an MRI‐compatible intravenous (IV) pole next to the scanning table. ICP values were increased by raising the height of the saline bag with the extendable IV pole and monitoring the pressure values outside the scanner (Fig. 2). Each animal had three to four steps of increasing pressure. Imaging was conducted only after the pressure had stabilized for 1 min on the pressure monitor.
At each pressure level, and prior to any MRE acquisition, anatomical T1‐weighted images of the porcine brain were obtained to document any morphological changes of the brain. A short, 4‐min and 20‐s inversion recovery–spoiled gradient recalled pulse sequence was used with the following parameters: slice thickness = 1.2 mm; matrix size = 256 × 256; FOV = 27 cm; sagittal acquisition plane; TR/TE = 7 ms/2.8 ms; flip angle = 11 degrees; and acceleration factor = 1.7, with a custom‐made four‐channel receive‐only surface coil placed on the top of the pig's head within the stereotactic frame. MRE was conducted postsurgery at the same frequencies as for presurgery for three (1 pig) and four (2 pigs) different ICP values ranging from 0 mmHg to 55 mmHg.
The same MRE imaging acquisition and postprocessing protocol was followed for the postsurgical scans, as described prior to surgery. A pairwise comparison on a voxel‐by‐voxel level was not possible due to ventricular deformations caused by catheter placement, as well as ventricular enlargement due to increased ICP. Therefore, to measure within‐subject changes in brain stiffness with respect to ICP, the stiffness distribution of all voxels in the brain volume was compared between the postsurgical baseline and the states of elevated ICP using a one‐sided Mann‐Whitney U test of significance 19. Effect sizes were calculated for each comparison by calculating the r value, as described by Fritz et al. 20, for which the guidelines for r values are such that a large effect size is 0.5; a medium effect size is 0.3; and a small effect size is 0.1. To assess whether a linear correlation existed between brain stiffness and ICP across subjects, a multiple linear regression was applied to all the data, with pressure as a continuous independent variable, pig number as a nominal independent variable, and stiffness as the dependent variable. No significant correlation between stiffness and pig number was observed, but a significant correlation existed between stiffness and ICP. Therefore, another linear regression was applied comparing only the median brain stiffness and ICP across subjects at each frequency. A P value of 0.05 was considered statistically significant.
RESULTS
Postsurgical Stiffness and Morphological Changes with Increased ICP
At baseline, prior to surgery, the median |G*| of the entire brain across all three pigs ranged from 1.58 to 1.92 kPa, 2.76 to 3.22 kPa, 4.09 to 4.74 kPa, and 5.70 to 5.8 kPa for frequencies of 60 Hz, 90 Hz, 120 Hz, and 150 Hz, respectively. Ventricle size increased progressively with stepwise increased ICP, as shown in Figure 3 for pig 1. At a pressure of 20 mmHg, an observable increase in only one ventricle is present (compare the initial ventricle size overlays in the bottom row of Fig. 3). At a pressure of 36 mmHg, both ventricles increased in size. Postsurgery, after the drainage of CSF and prior to elevating ICP, the median |G*| decreased in all three pigs. The decrease in |G*| across all three pigs was in the ranges of 0.015 to 0.025 kPa, 0.011 to 0.13 kPa, 0.20 to 0.42 kPa, and 0.71 to 0.78 kPa at vibration frequencies of 60 Hz, 90 Hz, 120 Hz, and 150 Hz, respectively. In the third pig, good communication between the two catheters was not achieved. As a result, not as much CSF was drained from the ventricles of the third pig; however, the amount of CSF that was drained still produced a decrease in stiffness after surgery.
Figure 3.
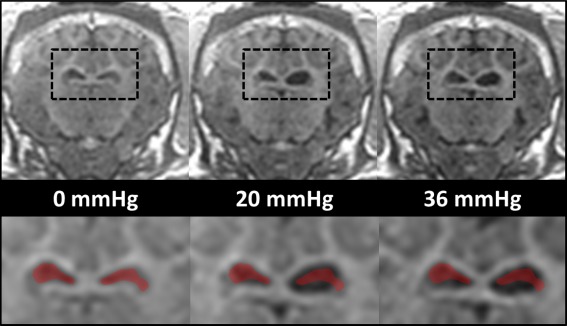
Anatomical images of ventricles under different pressure levels postcatheter implantation in pig 1 (top row). The black dashed boxes in the top row have been magnified in the bottom row. For comparison purposes, the ventricles at 0 mmHg have been overlaid in red in all three magnified images. mmHg, millimeters mercury.
Within‐ and Cross‐Subject Stiffness Changes with Increased ICP
The within‐subject median |G*| values over the entire brain volume have been plotted in Figure 4 and listed in Table 1 as a function of ICP for vibration frequencies of 60 Hz, 90 Hz, 120 Hz, and 150 Hz. The P values and corresponding effect sizes from the one‐sided Mann‐Whitney U test across all frequencies and for each ICP value within each subject have been listed in Table 2. In pig 1, there was a statistically significant increase and a small effect size in |G*| at pressures above 36 mmHg for all frequencies. In pig 2, there was a significant increase in stiffness across all frequencies and all elevations in pressure, except at 120 Hz, and a pressure of 19 mmHg. However, a small effect size only was observed when pressures reached 38 mmHg for all frequencies. In pig 3, a significant increase in |G*| was observed at all frequencies for a pressure of 42 mmHg when compared to a baseline of 26 mmHg. The cross‐subject linear correlations and their respective measured median stiffness values at each vibration frequency have been plotted in Figure 5, and all parameters of the regression model have been listed in Table 3. Note that Figure 5 illustrates the same data as Figure 4, but no distinction has been made between pigs. For all vibration frequencies, a statistically significant linear correlation (P ≤ 0.01) was found between median brain stiffness and ICP. Sample elastograms illustrating the observed changes in brain stiffness over the span of the experiment for all three pigs are shown in Figure 6.
Figure 4.
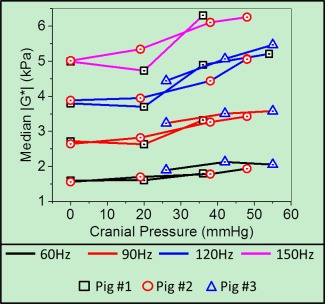
Median |G*| (kPa) as a function of intracranial pressure at 60 Hz, 90 Hz, 120 Hz, and 150 Hz vibration frequencies, and for all three pigs.
Hz, hertz; kPA, kilopascal; mmHg, millimeters mercury.
Table 1.
Median |G*| (kPa) at Each Frequency and Ventricular Pressure for All Three Pigs
| Frequencies | |||||
|---|---|---|---|---|---|
| Pressure (mmHg) | 60 Hz | 90 Hz | 120 Hz | 150 Hz | |
| Pig 1 | Baseline | 1.61 | 2.82 | 4.22 | 5.70 |
| 0 | 1.60 | 2.72 | 3.80 | 4.99 | |
| 20 | 1.61 | 2.63 | 3.70 | 4.73 | |
| 36 | 1.80 | 3.32 | 4.90 | 6.31 | |
| 54 | NA | NA | 5.21 | NA | |
| Pig 2 | Baseline | 1.58 | 2.76 | 4.09 | 5.80 |
| 0 | 1.56 | 2.64 | 3.88 | 5.01 | |
| 19 | 1.70 | 2.82 | 3.95 | 5.34 | |
| 38 | 1.78 | 3.26 | 4.44 | 6.11 | |
| 48 | 1.94 | 3.43 | 5.07 | 6.26 | |
| Pig 3 | Baseline | 1.92 | 3.22 | 4.74 | NA |
| 26 | 1.89 | 3.23 | 4.44 | NA | |
| 42 | 2.13 | 3.51 | 5.06 | NA | |
| 55 | 2.05 | 3.58 | 5.47 | NA | |
Baseline corresponds to stiffness prior to surgery.
Hz, hertz; kPA, kilopascal; mmHg, millimeters mercury; not acquired, NA.
Table 2.
P Values and Effect Sizes (r) of One‐sided (tail = left) Mann‐Whitney U Test Across All Frequencies and Pressure Values for Each Pig
| Compared Pressures (mmHg) | Frequencies | |||
|---|---|---|---|---|
| 60 Hz | 90 Hz | 120 Hz | 150 Hz | |
| P Value/Effect Size (r) | P Value/Effect Size (r) | P Value/Effect Size (r) | P Value/Effect Size (r) | |
| Pig 1 | ||||
| 0 vs. 20 | 0.003/0.02 | 1.0/0.02 | 1.0/0.03 | 1.0/0.05 |
| 0 vs. 36 | < 0.0001/0.12 | < 0.0001/0.23 | < 0.0001/0.29 | < 0.0001/0.25 |
| 0 vs. 54 | NA | NA | < 0.0001/0.35 | NA |
| Pig 2 | ||||
| 0 vs. 19 | < 0.0001/0.09 | < 0.0001/0.07 | 0.058/0.01 | < 0.0001/0.07 |
| 0 vs. 38 | < 0.0001/0.15 | < 0.0001/0.23 | < 0.0001/0.15 | < 0.0001/0.20 |
| 0 vs. 48 | < 0.0001/0.22 | < 0.0001/0.28 | < 0.0001/0.29 | < 0.0001/0.24 |
| Pig 3 | ||||
| 26 vs. 42 | < 0.0001/0.09 | < 0.0001/0.11 | < 0.0001/0.17 | NA |
| 26 vs. 55 | < 0.0001/0.09 | < 0.0001/0.14 | < 0.0001/0.26 | NA |
An effect size is considered small, medium, or large when r equals 0.1, 0.3, and 0.5, respectively.
Hz, hertz; mmHg, millimeters mercury; not acquired, NA.
Figure 5.
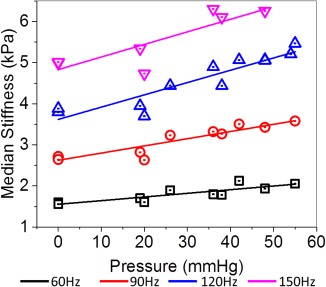
Cross‐subject median change in |G*| as a function of frequency and intracranial pressure for all three pigs. The linear regression lines for each vibration frequency have been plotted.
Hz, hertz; kPA, kilopascal; mmHg, millimeters mercury.
Table 3.
P Values from Linear Regression (stiffness (kPa) = (stiffness/pressure slope) *(pressure) + intercept), Across All Frequencies and Pressure Values for All Three Pigs Combined
| Vibration Frequency | 0 mmHg Intercept (kPa) | Stiffness/Pressure Slope (kPa/mmHg) | P Value | R Squared |
|---|---|---|---|---|
| 60 Hz | 1.55 ± 0.06 | 0.009 ± 0.002 | 0.001 | 0.74 |
| 90 Hz | 2.62 ± 0.08 | 0.017 ± 0.002 | < .0001 | 0.86 |
| 120 Hz | 3.62 ± 0.15 | 0.030 ± 0.004 | < .0001 | 0.85 |
| 150 Hz | 4.83 ± 0.24 | 0.031 ± 0.008 | 0.01 | 0.73 |
Hz, hertz; kPA, kilopascal; mmHg, millimeters mercury.
Figure 6.
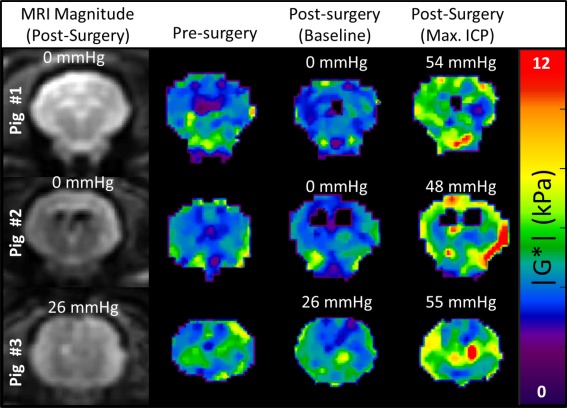
Elastograms (|G*|) of presurgery and postsurgery at baseline and postsurgery at maximum ICP in three pigs and at a 120 hertz vibration frequency.
ICP, intracranial pressure; kPA, kilopascal; mmHg, millimeters mercury.
DISCUSSION
This study demonstrated both decreased ICP results in lowered brain stiffness and increased ICP results in increased brain stiffness within the same subject and across subjects in a swine model. Postsurgical baseline measurements with the associated drainage of CSF and accompanying lowered ICP were shown to decrease the median brain stiffness by 0.01 to 0.03 kPa, 0.01 to 0.12 kPa, 0.20 to 0.42 kPa, and 0.71 to 0.78 kPa at vibration frequencies of 60 Hz, 90 Hz, 120 Hz, and 150 Hz, respectively. A significant correlation between increased ICP and increased brain stiffness in the cross‐subject comparison for all tested vibrational frequencies (60 Hz, 90 Hz, 120 Hz, and 150 Hz) was observed. The 120 Hz (0.030 ± 0.004 kPa/mmHg) and 150 Hz (0.031 ± 0.008 kPa/mmHg) vibrational frequencies had nearly identical slopes, which were approximately two‐ to three‐fold higher than the 90 Hz (0.017 ± 0.002 kPa/mmHg) and 60 Hz (0.009 ± 0.002 kPa/mmHg) slopes, respectively. This suggests that, with current stiffness inversion methods, higher frequencies may be more sensitive to changes in pressure. Although this is a small sample population, it is encouraging to see that a linear relationship exists between absolute ICP and stiffness across subjects.
It appears that for pig 1 there was a pressure range from 0 to 20 mmHg in which brain stiffness did not increase with ICP (Fig. 4) (Table 1). Once past this range, the median brain stiffness for pig 1 showed a significant increase with increased ICP, which was especially noticeable at higher vibration frequencies. For the other two pigs, significant increases in stiffness were observed at all pressure levels tested. From a mechanical standpoint, increases in tissue stiffness result when a tissue is compressed such that the relationship between stress and strain becomes nonlinear, causing a rise in stiffness. The 0 to 20 mmHg range may represent this linear relationship, whereas the 20 to 30 mmHg range may represent the transition to a nonlinear relationship in this specific case. Coincidentally, stiffness values in the 20 to 30 mmHg range overlapped with the baseline stiffness measurements made prior to surgery for all animals. In a swine model, this suggests that normal brain function occurs when the brain is under some nonlinear mechanical strain, and this overlapped with the range in which stiffness was observed to increase with ICP in all three pigs. A schematic of this hypothesis has been shown in Figure 7. If this is valid, stiffness will be correlated with pressure in the nonlinear region, whereas this relationship will not hold in the linear region. The stiffness is the rate of change or slope of the stress‐strain curve. A linear stress‐strain curve would yield a constant stiffness corresponding to its slope. A nonlinear stress‐strain curve with a constant second derivative (i.e., parabolic in shape) would yield a stiffness that varies linearly with pressure. These normal ICP values may be different than those observed in human subjects in whom ICP values greater than 15 mmHg sometimes can be considered above average 21. Future studies in humans will be needed to investigate this.
Figure 7.
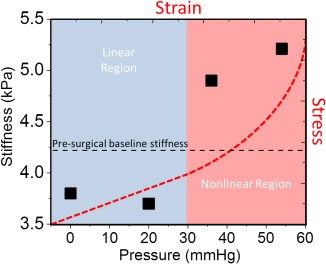
Schematic of hypothetical stress‐strain curve (top‐right axes, red dashed line) as a possible explanation for the observed stiffness‐pressure measurements (bottom‐left axes, solid black squares) in pig 1 (120 Hz). At each pressure, the slope of the stress‐strain curve corresponds to the stiffness of the brain parenchyma. In the linear region, the slope of the stress‐strain curve is constant across all pressures; that is, the stiffness remains constant. In the nonlinear region, the slope is continually increasing, thus giving rise to increasing stiffness. Assuming that pressure is the dominant factor, the presurgical baseline‐stiffness measurement (black dashed line) suggests that normal brain function occurs in the nonlinear region of the stress‐strain curve.
>Hz, hertz; kPA, kilopascal; mmHg, millimeters mercury.
It may appear from the elastograms in Figure 6 that the distribution of brain stiffness is not uniform throughout the entire brain, which may suggest that only regions of tissue are increasing in stiffness with acute changes in pressure, and that these do not become significant enough to affect the entire brain volume until higher ICP values are reached. However, the linear correlation between median stiffness and ICP suggests that this is a global phenomenon because it is affecting the entire distribution. It is not within the scope of this paper to evaluate if MRE is capable of measuring localized regions of increased pressure in this animal model. However, future studies could help support or disprove the hypothesis that some forms of hydrocephalus result from localized CSF accumulation, leading to local compression in certain regions in the brain 5, 22.
To the knowledge of the authors, this is the first study to investigate the relationship of |G*| and absolute ICP in vivo. Hatt et al. 13 performed brain MRE on nine healthy normal volunteers with and without jugular compression. They acquired a single slice in the brain using a vibration frequency of 30 Hz, and were not able to report a significant difference in brain stiffness between these two conditions. Pattison et al. 23, building on Shapiro et al.’s 24 feline hydrocephalus model, performed MRE at a vibration frequency of 85 Hz in 18 female feline subjects, 12 of which received kaolin injections to induce an acute form of hydrocephalus. Pattison et al. did not report ICP values, and no formal statistics are reported on their stiffness results; however, they did report a mean increase in parenchymal stiffness from 5.4 ± 2.8 kPa to 9.3 ± 5.1 kPa between the baseline values and the hydrocephalic state, respectively. Mousavi et al. 25, with a strain MRI‐imaging approach, demonstrated that volumetric strain correlated with whole‐brain dilation in five healthy volunteers by using the Valsalva maneuver to alter ICP. Hirsch et al. 26 used MRE and phase‐contrast MRI measurements to show that volumetric strain in the brain could be increased by 45% with abdominal muscle contractions. Lastly, Weaver et al. 27, with MRE and a poroelastic model, showed that fluid pressure carries a portion of the stress that contributes to the mean shear modulus in the brain. However, because ICP was not recorded during any of these studies, it currently is not possible to compare these to our results. In addition, previous studies conducted in the liver and spleen have reported supporting evidence that a direct correlation with MRE stiffness and different levels of pressure and static strain does exist 28, 29.
Alperin et al. 30 introduced an alternative noninvasive phase contrast MRI method to measure both ICP and elastance index by measuring CSP volume change and blood flow. The authors reported a strong linear correlation between their elastance index and an invasive ICP measurement in five patients, and were able to apply their technique to differentiate normal volunteers from patients with chronically elevated ICP. Some of the advantages of MRE over the described technique are that MRE is capable of producing localized stiffness measurements, does not depend on the accuracy of lumen segmentation, and is an independent measurement of the tissue's response to pressure and not a direct derivative of the pressure in the CSF itself. Several other groups also have used invasive pressure‐volume measurements, with the addition of different aliquots of artificial CSF, to estimate an elasticity slope from elastance measurements. These techniques have been investigated in a series of animal experiments 31, 32, 33 and in patient populations 34, 35 in various disorders of the CSF system. Again, these measurements are made on the response of the lumen and not necessarily the underlying tissue mechanics within the entire brain. Although the elastance index is a different metric than |G*|, these results give support that elasticity may be a valuable biomarker for disease differentiation and motivate further exploration of MRE in human subjects.
The limitations of this study were the small sample size, the measurement of only acute changes in ICP versus chronic ICP elevations, and low 3‐mm isotropic MRE acquisition resolution. In addition, proper drainage of CSF was not possible in pig 3, resulting in a baseline ICP of 26 mmHg instead of 0 mmHg. However, similar responses in stiffness still were observed, both directly after surgery and with elevations in ICP in pig 3. Although the number of subjects used was small, the experiment was designed to elicit a graded response within each animal, with multiple within‐animal correlations being acquired. Thus, the number of data points was larger than the number of animals used, improving statistical power. We previously also have shown, despite small sample sizes, that consistent results with high statistical power can be achieved in stereotactic swine surgeries 36, 37, 38. Lastly, the objectives of this study were to demonstrate the feasibility of measuring stiffness in vivo, while simultaneously increasing and monitoring ICP through two implanted catheters in the left and right ventricles of the swine brain, which means that it still is not clear whether the elevated stiffness in response to increased ICP is a transient or long‐term effect.
If a linear relationship between stiffness and pressure holds in human subjects, it may have significant implications for surgical planning and therapy monitoring. An important note is that the ICP values tested in this study were within the range of pressures previously observed and tested in patients 35, 39. Therefore, this motivates future studies investigating the role of MRE for presurgical planning, shunt therapy monitoring, and potentially quantitative evaluation of brain stiffness pre– and post–high‐volume lumbar CSF drainage.
CONCLUSION
MRE demonstrated a direct relationship between brain stiffness and ICP across the entire brain volume. A statistically significant increase in stiffness was observed both within and across subjects in response to elevations in ICP. This study motivates future investigation in human subjects to determine if MRE has a role in the diagnosis and management of patients with changes in ICP and hydrocephalus.
Supported by the Theodore W. Batterman Family Foundation and NIH grant R01 EB001981 (R.L.E.).
Richard Ehman and John Huston and the Mayo Clinic have intellectual property rights and a potential financial interest in some of the technology used in this study.
REFERENCES
- 1. Manduca A, Oliphant TE, Dresner MA, Mahowald JL, Kruse SA, Amromin E, Felmlee JP, Greenleaf JF, Ehman RL. Magnetic resonance elastography: non‐invasive mapping of tissue elasticity. Med Image Anal 2001;5:237–254. [DOI] [PubMed] [Google Scholar]
- 2. Xu L, Lin Y, Han JC, Xi ZN, Shen H, Gao PY. Magnetic resonance elastography of brain tumors: preliminary results. Acta Radiol 2007;48:327–330. [DOI] [PubMed] [Google Scholar]
- 3. Hughes JD, Fattahi N, Van Gompel J, Arani A, Meyer F, Lanzino G, Link MJ, Ehman R, Huston J. Higher‐resolution magnetic resonance elastography in meningiomas to determine intratumoral consistency. Neurosurgery 2015;77:653–658. [DOI] [PMC free article] [PubMed] [Google Scholar]
- 4. Streitberger KJ, Wiener E, Hoffmann J, et al. In vivo viscoelastic properties of the brain in normal pressure hydrocephalus. NMR Biomed 2011;24:385–392. [DOI] [PubMed] [Google Scholar]
- 5. Fattahi N, Arani A, Perry A, Meyer F, Manduca A, Glaser K, Senjem ML, Ehman RL, Huston J. MR elastography demonstrates increased brain stiffness in normal pressure hydrocephalus. Am J Neuroradiol 2016;37:462–467. [DOI] [PMC free article] [PubMed] [Google Scholar]
- 6. Wuerfel J, Paul F, Beierbach B, Hamhaber U, Klatt D, Papazoglou S, Zipp F, Martus P, Braun J, Sack I. MR‐elastography reveals degradation of tissue integrity in multiple sclerosis. Neuroimage 2010;49:2520–2525. [DOI] [PubMed] [Google Scholar]
- 7. Streitberger KJ, Sack I, Krefting D, Pfuller C, Braun J, Paul F, Wuerfel J. Brain viscoelasticity alteration in chronic‐progressive multiple sclerosis. PloS One 2012;7:e29888. [DOI] [PMC free article] [PubMed] [Google Scholar]
- 8. Murphy MC, Huston J 3rd, Jack CR Jr, Glaser KJ, Manduca A, Felmlee JP, Ehman RL. Decreased brain stiffness in Alzheimer's disease determined by magnetic resonance elastography. J Magn Reson Imaging 2011;34:494–498. [DOI] [PMC free article] [PubMed] [Google Scholar]
- 9. Huston J, Murphy MC, Boeve BF, Fattahi N, Arani A, Glaser KJ, Manduca A, Jones DT, Ehman RL. Magnetic resonance elastography of frontotemporal dementia. J Magn Reson Imaging 2016;43:474–478. [DOI] [PMC free article] [PubMed] [Google Scholar]
- 10. Arani A, Murphy MC, Glaser KJ, Manduca A, Lake DS, Kruse SA, Jack CR Jr, Ehman RL, Huston J 3rd. Measuring the effects of aging and sex on regional brain stiffness with MR elastography in healthy older adults. Neuroimage 2015;111:59–64. [DOI] [PMC free article] [PubMed] [Google Scholar]
- 11. Sack I, Beierbach B, Wuerfel J, Klatt D, Hamhaber U, Papazoglou S, Martus P, Braun J. The impact of aging and gender on brain viscoelasticity. Neuroimage 2009;46:652–657. [DOI] [PubMed] [Google Scholar]
- 12. Sack I, Streitberger KJ, Krefting D, Paul F, Braun J. The influence of physiological aging and atrophy on brain viscoelastic properties in humans. PloS One 2011;6:e23451. [DOI] [PMC free article] [PubMed] [Google Scholar]
- 13. Hatt A, Cheng S, Tan K, Sinkus R, Bilston LE. MR elastography can be used to measure brain stiffness changes as a result of altered cranial venous drainage during jugular compression. AJNR Am J Neuroradiol 2015;36:1971–1977. [DOI] [PMC free article] [PubMed] [Google Scholar]
- 14. Shon YM, Lee KH, Goerss SJ, Kim IY, Kimble C, Van Gompel JJ, Bennet K, Blaha CD, Chang SY. High frequency stimulation of the subthalamic nucleus evokes striatal dopamine release in a large animal model of human DBS neurosurgery. Neurosci Lett 2010;475:136–140. [DOI] [PMC free article] [PubMed] [Google Scholar]
- 15. Min HK, Hwang SC, Marsh MP, et al. Deep brain stimulation induces BOLD activation in motor and non‐motor networks: An fMRI comparison study of STN and EN/GPi DBS in large animals. Neuroimage 2012;63:1408–1420. [DOI] [PMC free article] [PubMed] [Google Scholar]
- 16. Romano AJ, Bucaro JA, Ehman RL, Shirron JJ. Evaluation of a material parameter extraction algorithm using MRI‐based displacement measurement. IEEE Trans Ultrason Ferroelectr Freq Control 2000;47:1575–1581. [DOI] [PubMed] [Google Scholar]
- 17. Oliphant TE, Manduca A, Ehman RL, Greenleaf JF. Complex‐valued stiffness reconstruction for magnetic resonance elastography by algebraic inversion of the differential equation. Magnet Reson Med 2001;45:299–310. [DOI] [PubMed] [Google Scholar]
- 18. Kim I, Paek S, Nelson BD, Knight EJ, Marsh MP, Bieber AJ, Bennet KE, Lee KH. Implementation of a chronic unilateral intraparenchymal drug delivery system in a swine model. J Neurosci Methods 2014;227:29–34. [DOI] [PMC free article] [PubMed] [Google Scholar]
- 19. Siegel S. Nonparametric Statistics: For the Behavioral Sciences. Tokyo, Japan: McGraw‐Hill Kogakusha; 1956. [Google Scholar]
- 20. Fritz CO, Morris PE, Richler JJ. Effect size estimates: current use, calculations, and interpretation. J Exp Psychol Gen 2012;141:2–18. [DOI] [PubMed] [Google Scholar]
- 21. Morritt DG, Yeh FJ, Wall SA, Richards PG, Jayamohan J, Johnson D. Management of isolated sagittal synostosis in the absence of scaphocephaly: a series of eight cases. Plast Reconstr Surg 2010;126:572–580. [DOI] [PubMed] [Google Scholar]
- 22. Chakravarty A. Unifying concept for Alzheimer's disease, vascular dementia and normal pressure hydrocephalus: a hypothesis. Med Hypotheses 2004;63:827–833. [DOI] [PubMed] [Google Scholar]
- 23. Pattison AJ, Lollis SS, Perrinez PR, Weaver JB, Paulsen KD. MR elastography of hydrocephalus In: Hu XP, ed. SPIE Medical Imaging: Biomedical Applications in Molecular, Structural, and Functional Imaging. Volume 2009;72620A. [Google Scholar]
- 24. Shapiro K, Takei F, Fried A, Kohn I. Experimental feline hydrocephalus. The role of biomechanical changes in ventricular enlargement in cats. J Neurosurg 1985;63:82–87. [DOI] [PubMed] [Google Scholar]
- 25. Mousavi SR, Fehlner A, Streitberger KJ, Braun J, Samani A, Sack I. Measurement of in vivo cerebral volumetric strain induced by the Valsalva maneuver. J Biomech 2014;47:1652–1657. [DOI] [PubMed] [Google Scholar]
- 26. Hirsch S, Klatt D, Freimann F, Scheel M, Braun J, Sack I. In vivo measurement of volumetric strain in the human brain induced by arterial pulsation and harmonic waves. Magn Reson Med 2013;70:671–683. [DOI] [PubMed] [Google Scholar]
- 27. Weaver JB, Pattison AJ, McGarry MD, Perreard IM, Swienckowski JG, Eskey CJ, Lollis SS, Paulsen KD. Brain mechanical property measurement using MRE with intrinsic activation. Phys Med Biol 2012;57:7275–7287. [DOI] [PMC free article] [PubMed] [Google Scholar]
- 28. Yin M, Kolipaka A, Woodrum DA, et al. Hepatic and splenic stiffness augmentation assessed with MR elastography in an in vivo porcine portal hypertension model. J Magn Reson Imaging 2013;38:809–815. [DOI] [PMC free article] [PubMed] [Google Scholar]
- 29. Clarke EC, Cheng S, Green M, Sinkus R, Bilston LE. Using static preload with magnetic resonance elastography to estimate large strain viscoelastic properties of bovine liver. J Biomech 2011;44:2461–2465. [DOI] [PubMed] [Google Scholar]
- 30. Alperin NJ, Lee SH, Loth F, Raksin PB, Lichtor T. MR‐Intracranial pressure (ICP): a method to measure intracranial elastance and pressure noninvasively by means of MR imaging: baboon and human study. Radiology 2000;217:877–885. [DOI] [PubMed] [Google Scholar]
- 31. Bragin DE, Bush RC, Muller WS, Nemoto EM. High intracranial pressure effects on cerebral cortical microvascular flow in rats. J Neurotrauma 2011;28:775–785. [DOI] [PMC free article] [PubMed] [Google Scholar]
- 32. Bragin DE, Statom GL, Yonas H, Dai X, Nemoto EM. Critical cerebral perfusion pressure at high intracranial pressure measured by induced cerebrovascular and intracranial pressure reactivity. Crit Care Med 2014;42:2582–2590. [DOI] [PMC free article] [PubMed] [Google Scholar]
- 33. Grubb RL Jr, Raichle ME, Phelps ME, Ratcheson RA. Effects of increased intracranial pressure on cerebral blood volume, #blood |flow, and oxygen utilization in monkeys. J Neurosurg 1975;43:385–398. [DOI] [PubMed] [Google Scholar]
- 34. Sklar FH, Diehl JT, Beyer CW Jr, Clark WK. Brain elasticity changes with ventriculomegaly. J Neurosurg 1980;53:173–179. [DOI] [PubMed] [Google Scholar]
- 35. Sklar FH, Beyer CW Jr, Clark WK. Physiological features of the pressure‐volume function of brain elasticity in man. J Neurosurg 1980;53:166–172. [DOI] [PubMed] [Google Scholar]
- 36. Paek SB, Min HK, Kim I, Knight EJ, Baek JJ, Bieber AJ, Lee KH, Chang SY. Frequency‐dependent functional neuromodulatory effects on the motor network by ventral lateral thalamic deep brain stimulation in swine. Neuroimage 2015;105:181–188. [DOI] [PMC free article] [PubMed] [Google Scholar]
- 37. Gibson WS, Ross EK, Han SR, Van Gompel JJ, Min HK, Lee KH. Anterior thalamic deep brain stimulation: functional activation patterns in a large animal model. Brain Stimul 2016;9:770–773. [DOI] [PMC free article] [PubMed] [Google Scholar]
- 38. Ross EK, Kim JP, Settell ML, Han SR, Blaha CD, Min HK, Lee KH. Fornix deep brain stimulation circuit effect is dependent on major excitatory transmission via the nucleus accumbens. Neuroimage 2016;128:138–148. [DOI] [PMC free article] [PubMed] [Google Scholar]
- 39. Wall SA, Thomas GP, Johnson D, Byren JC, Jayamohan J, Magdum SA, McAuley DJ, Richards PG. The preoperative incidence of raised intracranial pressure in nonsyndromic sagittal craniosynostosis is underestimated in the literature. J Neurosurg Pediatr 2014;14:674–681. [DOI] [PubMed] [Google Scholar]


