

Abstract
Time spent in the doctor’s waiting room captures an important aspect of the healthcare experience. We analyzed data on 21 million outpatient visits obtained from electronic health record systems, allowing us to measure time spent in the waiting room beyond the scheduled appointment time. Median wait time was just over 4 minutes. Almost one-fifth of visits had waits longer than 20 minutes, and 10% were over 30 minutes. Waits were shorter for early morning appointments, younger patients, and at larger practices. Median wait time was 4.1 minutes for privately-insured and 4.6 minutes for Medicaid patients; adjusting for patient and appointment characteristics, Medicaid patients were 20% more likely than the privately-insured to wait longer than 20 minutes (P<0.001), with most of this disparity explained by differences in practices and providers they saw. Wait time for Medicaid patients relative to the privately-insured was longer in states with relatively lower Medicaid reimbursement rates.
Introduction
Anyone who has ever spent time sitting in a doctor’s office waiting for her appointment to begin must have wondered whether her experience was typical. Wait times to see physicians are a source of potential frustration and dissatisfaction with care quality, as well as lost productivity for individual patients. This study examined the time spent waiting in the doctor’s office beyond the scheduled appointment time (hereafter, “wait time”) using detailed administrative data on over 21 million outpatient visits. We quantified how wait time varied across patient, visit, and provider characteristics.
We then specifically examined the experience of Medicaid patients relative to privately insured individuals. Differences in wait times between Medicaid and privately insured patients may capture an important aspect of differences in the (non-health) quality of their healthcare experience. The results may therefore shed light on issues of timely and equitable care, two of the six aims for improvement in the Institute of Medicine’s Crossing the Quality Chasm Report.1
Existing studies comparing quality of care by insurance status typically examined differences in health outcomes from specific treatments2;3 or rates of receipt of appropriate care.4;5 Such comparisons may be contaminated by underlying health differences in the different populations;6 this is less likely to be a concern with a wait time measure. The few existing studies of wait time in an outpatient setting have been based on survey responses regarding “perceived time in the waiting room”7 or total clinic time.8 A larger literature on wait times in the emergency department is also based on such survey measures which may suffer from systematic response or recall biases,9–11 issues that are less likely to arise with our administrative data.
Our analysis of wait-time differentials for Medicaid patients complements work documenting other disparities in healthcare faced by Medicaid patients. Physician self-reports and audit studies have found that Medicaid patients have to wait longer to schedule outpatient appointments,12–24 and that they were more likely to face barriers to care.25
Study Data and Methods
Data
The de-identified data were provided by athenahealth, a large national provider of electronic health records, electronic medical billing, and practice management software. The data covered all outpatient visits during calendar year 2013 that were associated with medical practices that have the company’s software installed.
The software captured the timing of key stages of every medical appointment. Our primary outcome variable was an estimate of the length of time a patient waited before the appointment began. We measured waiting as beginning when the patient arrives at the practice and checks in at the front desk, or at the time for which the appointment was scheduled, whichever is later. Waiting ended when the patient saw a medical practitioner. This is measured by the first keystroke or mouse click in the “intake” phase of the software; the measure therefore assumes that user activity occurs promptly at the start of intake. Wait time was negative if the patient arrived early and was seen prior to the originally scheduled time of the appointment; this was done so that we did not attribute long wait times to early arrivals. We also analyzed the patient’s arrival time relative to the original scheduled time of the appointment.
The data also contained rich information on the patients and their care from linked billing information. For each visit we observed the specialty of the primary medical professional seen, and (masked) identifiers of the medical practice and the primary medical professional. We also observed the patient’s age, gender, census region of residence, the primary payer (insurer) of the medical bill, up to eight diagnosis codes (International Classification of Diseases, Ninth Revision, Clinical Modification), the procedures that were performed (Current Procedure Terminology (CPT) codes), allowable charges, and transacted payments. We grouped the primary payer type into five categories: private, Medicaid, Medicare, self-pay, or “other.” We used the CPT codes to construct total work relative value units (RVUs) by summing the work component of RVUs for each CPT billed during the visit. RVUs are a standard summary measure of the intensity of the visit and form the basis for Medicare reimbursement.26 We used “allowable charges” – which are extremely similar to “transacted payments” – to measure reimbursement rates. Due to delays in implementing planned 2013 and 2014 Medicaid rate increases under the Affordable Care Act (ACA),27 our 2013 data primarily reflected 2012 (that is, prior to the temporary ACA rate increase) Medicaid payment rates; see Appendix Section 1 for details.28 MIT’s institutional review board reviewed this study and granted exempt status (protocol #: 1509231371).
Statistical analysis
We summarized the median wait time for all patients and stratified by patient age, gender, region of residence, primary insurance, the time of day of the visit, practice size, and physician specialty.
To compare wait times for Medicaid patients to wait times for the privately insured, we analyzed a linear probability model in which the dependent variable was an indicator variable for whether wait time was longer than 20 minutes. The key explanatory variable was an indicator variable for whether the patient was covered by Medicaid, as opposed to privately insured. Results were similar for other definitions of wait times (e.g. longer than 15, 30, or 40 minutes).
We first report results from a univariate model, and then adjust for available confounders using various characteristics of the patient and the visit. We also quantify the extent to which longer wait times of Medicaid patients could be explained by differences in the types of practices or physicians they visited by adding indicator variables for the particular practice and the particular medical professional within the practice. Finally, we allow the difference in wait time between Medicaid and privately insured patients to vary with the patient’s state of residence and examine the correlation between the relative generosity by which physicians are compensated for seeing Medicaid patients compared to privately insured patients and the relative wait times of Medicaid patients; Appendix Section 3 provides more detail on this specification.28
Limitations
One potential limitation is that we analyzed a convenience sample of ambulatory practices that use a particular billing software. However, visits in our data appeared similar along most patient and physician characteristics to the 2012 National Ambulatory Medical Care Survey (NAMCS),29 which was designed to be representative of all outpatient visits in the United States (Appendix Exhibit A1).28 A notable exception is that larger physician groups were overrepresented and solo practices were under-represented in our sample, presumably due to the greater propensity of larger practices to adopt information technology products such as this particular billing software. In addition, certain census regions – such as the Atlantic South – appear over-represented. Our sample had a higher share of patients covered by private insurance compared to the NAMCS while the share of patients covered by Medicaid was similar; see Appendix Section 2 for details.28 While we control for these observable differences across providers, there could be unobservable differences in provider objectives or key attributes of the physicians that we are unable to account for in this analysis.
Another potential limitation is that our measure of wait time was based on time stamps, which may not have always been accurately recorded. However, as long as the measurement error is similar across types of patients and visits, it should not bias comparisons of wait time across groups such as patients of different insurance status.
Finally, we measured only one aspect of wait time. We could not measure any additional wait time inside the physician’s examination room; prior work has measured the combined time spent waiting for and obtaining outpatient medical care from self reports, but has been unable to distinguish between the two.8 We also could not measure wait time to schedule an appointment. This has been the focus of other studies that found, based on physician self reports and audit studies, that Medicaid patients had to wait longer to schedule outpatient appointments.12–16;23;24
Results
Wait and arrival times
We observed claim, billing, demographic, and wait time data for 21.4 million visits from 2,581 unique practices. Exhibit 1 shows the distribution of wait time for the entire baseline sample, and separately for Medicaid and for privately insured patients. Across all patients, 32.8% of patients had negative wait time, meaning that they arrived and began their appointment before its originally scheduled time. The median wait time was 4.1 minutes; among individuals who have a positive wait time, median wait time is 9.5 minutes. Across all patient visits, 17% had a wait time longer than 20 minutes, 10% longer than 30 minutes, and 5% over 45 minutes.
Exhibit 1. Distribution of Wait Time.
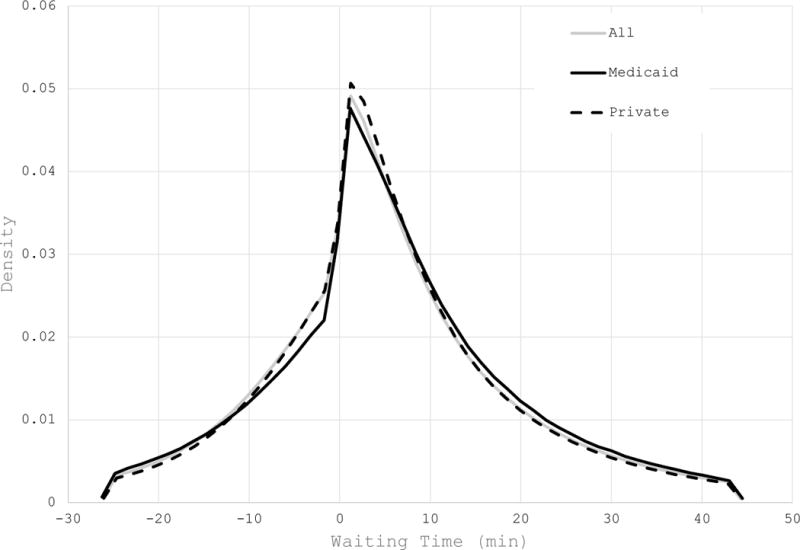
Source/Notes: SOURCE Author’s analysis of data from athenahealth NOTES Figure shows the kernel density of wait time in the baseline sample after trimming the bottom 5% of the distribution and the top 5%. The gray line shows it for the entire baseline sample (except the trimmed outliers; N = 19.3 million), and then separately for Medicaid (black; N = 2.1 million) and privately-insured (dashed; N = 12.3 million) patients.
We present descriptive statistics on how wait times and arrival times varied across patient and provider characteristics in Exhibit 2. Looking at the share of visits with wait times over 20 minutes, we find that wait times were lower for early morning appointments, younger patients, and at larger practices. Wait times were longer for female patients; this may partially be explained by differences in wait times across specialties. Appendix Exhibit A2 documents that, across physician specialties, wait times were longer for visits with obstetricians/gynecologists, general surgeons and ophthalmologists, and shortest for psychiatry, dermatology and pediatrics.28 It also shows variation in wait time by geograpahy: wait times were shortest in New England and longest in the East South Central of the United States, where they were three times higher than in New England. This is in contrast to the literature on appointment wait times, which has found that scheduling lead times were higher in Massachusetts.23;24
Exhibit 2.
Wait and Arrival Times by Patient and Visit Characteristics
| Share of visits | Wait timea | Arrival timeb | |||
|---|---|---|---|---|---|
| Median | % over 20 min | Median | % on time | ||
| (1) | (2) | (3) | (4) | (5) | |
| All | 100.0 | 4.1 | 17.0 | −5.7 | 67.6 |
| Age | |||||
| <5 | 8.2 | 4.0 | 13.4 | −2.8 | 59.9 |
| 5-14 | 9.1 | 3.7 | 14.3 | −3.8 | 62.4 |
| 15-24 | 8.7 | 4.6 | 16.7 | −3.3 | 61.0 |
| 25-44 | 20.5 | 4.8 | 17.7 | −3.8 | 62.4 |
| 45-64 | 27.9 | 4.1 | 17.8 | −6.3 | 69.8 |
| 65+ | 25.6 | 3.2 | 17.8 | −8.7 | 76.0 |
| Gender | |||||
| Female | 61.2 | 4.3 | 17.5 | −5.3 | 66.8 |
| Male | 38.8 | 3.6 | 16.2 | −6.2 | 69.0 |
| Primary insurance | |||||
| Private | 63.1 | 4.1 | 16.3 | −5.0 | 66.5 |
| Medicaid | 10.8 | 4.6 | 18.0 | −4.5 | 62.9 |
| Medicare | 20.9 | 3.3 | 18.1 | −8.5 | 75.0 |
| Self-pay | 3.3 | 5.2 | 19.5 | −3.6 | 60.6 |
| Other | 1.9 | 4.1 | 19.2 | −5.3 | 64.8 |
| Time of day | |||||
| Before 10am | 25.5 | 3.8 | 14.4 | −4.6 | 65.3 |
| 10am - 12pm | 27.2 | 4.6 | 19.5 | −6.2 | 69.0 |
| 12pm - 2pm | 14.6 | 3.8 | 15.2 | −5.3 | 66.8 |
| 2pm - 4pm | 24.6 | 4.3 | 18.3 | −6.4 | 69.3 |
| After 4pm | 8.1 | 3.2 | 15.9 | −5.6 | 66.8 |
| Practice sizec | |||||
| 1 | 6.1 | 5.1 | 23.4 | −3.9 | 60.9 |
| 2 | 5.0 | 4.1 | 17.7 | −4.7 | 64.9 |
| 3-5 | 12.0 | 4.0 | 16.8 | −5.4 | 67.7 |
| 6-10 | 11.7 | 4.0 | 15.9 | −5.3 | 67.7 |
| >10 | 65.3 | 4.0 | 16.6 | −6.0 | 68.5 |
SOURCE Author’s analysis of data from athenahealth. NOTES Table is based on the baseline sample (N=21.4 million). Each observation represents an outpatient visit.
Wait time is the time (in minutes) between the patient’s check-in time or the appointment’s scheduled time (whichever is latest) and the time the patient is seen by a medical practitioner.
Arrival time is the difference (in minutes) between the time the patients checks in and the appointment’s scheduled time. Negative values imply early arrival; Positive values imply late arrival.
Practice size represents the number of medical practitioners filing claims at the practice.
Medicaid patients had longer wait times than privately insured patients. The median wait time for Medicaid patients was 4.6 minutes, compared to 4.1 minutes for the privately insured. In addition, 18.0% of visits for Medicaid patients had a wait time of over 20 minutes compared to 16.3% for the privately insured. In contrast, Medicare patients had shorter median wait times but a greater share of visits with long wait times, again compared to the privately insured. Most of these differences are explained by the age distribution of Medicare patients. Visits by patients who paid by themselves also had longer wait times.
Median arrival time was approximately 6 minutes prior to the start of the appointment. About two thirds of patients arrived on time – i.e. before the start of the appointment – with the elderly being the most punctual age group; young children arrived late for over 40% of their visits. Patients were least likely to arrive on time to morning appointments and to practices with a single physician. Across specialties, dermatology was associated with the most punctual patients, while physician assistants were most likely to experience late arrivals; see Appendix Exhibit A2.28
Longer wait time for Medicaid patients
Exhibit 1 shows that Medicaid patients had a greater share of visits with long wait times. They also had a smaller share of visits with negative wait times, reflecting the fact that Medicaid patients were more likely to arrive late for their appointments (Exhibit 2 and Appendix Exhibit A3).28
Exhibit 3 compares wait times for Medicaid and privately insured patients. Column (1) shows the raw differences in wait times. We find that 16.3% of privately insured patients waited longer than 20 minutes; Medicaid patients were 1.7 percentage points (P < 0.001) more likely than privately insured patients to wait 20 minutes or longer, a relative increase of 10%. Some of this could reflect differences between Medicaid and privately insured patients in arrival time, or other patient and appointment characteristics. Column (2) therefore controls flexibly for the arrival time of the patient relative to their scheduled appointment time, as well as for a rich set of available confounders about the patient (age, gender, and census region) and the appointment (the visit’s log RVUs, the physician’s specialty, the day of the week of the appointment, and the time of day of the appointment). Controlling for these characteristics doubled the difference in wait time between Medicaid and privately insured patients, with Medicaid patients now 3.4 percentage points (P < 0.001) more likely than privately insured patients to wait 20 minutes or longer, or 21% more likely to wait 20 minutes or longer than privately insured patients. Column (3) controls for the diagnosis codes associated with the visit, which does little to affect the results reported in column (2). This supports our hypothesis that differences in wait times are not contaminated by differences in health characteristics between Medicaid and privately insured patients.
Exhibit 3.
Estimates of Relative Wait Time of Medicaid Patients
| Probability of waiting > 20 min | |||||
|---|---|---|---|---|---|
| No Controls | Controlsa + Census Region Fixed Effects | Controls + Diagnosisb + Census Region Fixed Effects | Controls + Practice Fixed Effects | Controls + Medical Practioner Fixed Effects | |
| (1) | (2) | (3) | (4) | (5) | |
| Medicaid | 0.0170 | 0.0338 | 0.0318 | 0.0153 | 0.0090 |
| (0.0068) | (0.0071) | (0.0075) | (0.0071) | (0.0017) | |
| R2 | 0.0003 | 0.0406 | 0.0679 | 0.1242 | 0.1620 |
SOURCE Author’s analysis of data from athenahealth. NOTES Table is based on the baseline sample, restricted to patients with either Medicaid or private insurance (N=15.8 million outpatient visits). The mean of the dependent variable for privately insured is 0.1626.
Controls include six bins for patient age (0-4 yrs, 5-14 yrs, 15-24 yrs, 25-44 yrs, 45-64 yrs, 65+ years), patient gender, five time of day bins (before 10am, 10am-12pm, 12pm-2pm, 2pm-4pm, 4pm and after), seven days of the week, four arrival binary variables (arrived at least twenty minutes early, arrived at least ten minutes early, arrived on time, and arrived less than ten minutes late). We also control for twelve physician specialty groups and total work relative value units associated with the visit which reflects the procedures preformed.
Controls for diagnosis consist of indicator variables for each observed combination of (up to eight) ICD-9 diagnosis codes for the visit.
About half of the difference in wait time between Medicaid and privately insured patients in column (2) can be explained by differences in the practices that Medicaid patients visit. The difference in wait time falls to 1.5 percentage points (P = 0.03), a relative increase of 9%, once we condition on which practice the patient attended in column (4). This is particularly striking given that variation across practices explains only 10% of the overall variation in wait time across all visits (not shown).
Another quarter of the difference in wait time between Medicaid and privately insured patients from column (2) can be explained by differences in the identity of the medical practitioners whom patients saw within the practice; column (5) shows that, even among visits to the same practice and physician, Medicaid patients were associated with a 0.9 percentage point (P < 0.001) greater propensity to wait 20 minutes or longer (a relative increase of 6%).
These results are robust to a number of sensitivity analyses. These include analyzing wait times of longer than 15 minutes, longer than 30 minutes or longer than 40 minutes (Appendix Exhibit A4), analyzing wait times separately by arrival time (Appendix Exhibit A5) and excluding visits to nurse practitioners and physician assistants from the analysis (Appendix Exhibit A6), and analyzing wait times separately by practice size (Appendix Exhibit A7).28
Private-Medicaid Wait Time Differences by State
Medicaid payment rates are set at the state level; the relative generosity of Medicaid reimbursement therefore varies across states. Exhibit 4 examines how the relative wait time of Medicaid patients compared to privately insured patients varied across states with different relative reimbursement rates for Medicaid compared to private insurance. Both the difference in wait time by state (vertical axis) and the difference in reimbursement rates by state (horizontal axis) control for all patient and visit characteristics included in Exhibit 3 column (2), except census region. The figure shows a negative relationship between relative wait times and reimbursement rates; states with higher Medicaid reimbursement rates had (relatively) shorter Medicaid wait times.
Exhibit 4. Relationship Betweeen Differences in Wait Times and Reimbursement Rates Between Medicaid and Private Insurance, by State.
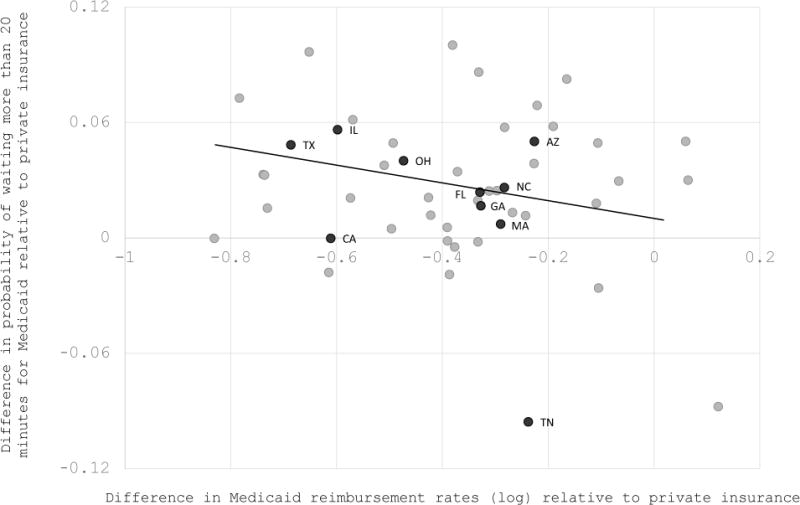
Source/Notes: SOURCE Author’s analysis of data from athenahealth NOTES Figure plots the difference in relative Medicaid wait time against relative Medicaid log reimbursement rates. The former is computed by regressing an indicator variable for waiting more than 20 minutes on state identifiers interacted with insurance type, controlling for age bins, gender, (natural) log RVUs, day of the week, time of day, arrival time, and physician specialty. The difference was then calculated by subtracting the coefficient on private insurance for a given state from the coefficient on Medicaid insurance for that state. The latter was computed in an analogous way, using (natural) log “allowable charges” as the dependent variable. Each point represents a state. The number of Medicaid visits by state ranged from 4,570 (Alaska) to 2,214,899 (Texas); we labeled the ten states with the most Medicaid visits. The dashed line is the best-fit line, weighted by the number of Medicaid visits, and its estimated slope is −0.041 (P < 0.001).
Discussion
Patient wait time is an important component of the quality of the overall healthcare experience. We provided a largescale study of wait time for ambulatory care in the United States, using data on over 21 million outpatient visits. Median wait time was less than 5 minutes, but almost one-fifth of patients waited longer than 20 minutes, and 5% waited longer than 45 minutes. Wait times were lower for early morning appointments, for younger patients, and in larger practices.
Medicaid patients experienced significantly longer wait-times than the privately insured. Adjusting for patient and appointment characteristics, Medicaid patients were 20% more likely than private patients to wait 20 minutes or longer. A key driver of this discrepancy was differences in the practices and providers whom Medicaid patients visit. This supports previous research suggesting that practices and physicians that disproportionately serve Medicaid patients differ in other aspects of the care environment; these differences include differences in practice location such as per capita income and urban status30–33 and physician characteristics such as medical school attended, years practicing, and probability of being board certified.31;33;34
However, even when they saw the same physician in the same practice, Medicaid patients waited 5% longer than privately insured patients. This is somewhat harder to interpret. It is possible that this reflects provider triaging of patients by insurance status. Alternately, it could reflect assortative scheduling; since the data show that Medicaid patients were more likely to be late to their appointments, days with many Medicaid patients could put practices behind schedule.
We also found that Medicaid patients were especially likely to wait longer than private patients in states with less generous Medicaid reimbursement rates. One potential explanation for this correlation is that in higher reimbursement states Medicaid patients have more access to high quality practices and providers. Physician surveys suggest that higher reimbursement is positively correlated with their willingness to accept Medicaid patients.30;32–34 These results are intriguing in the context of the ongoing policy debate around Medicaid reimbursement rates. Concerns about whether Medicaid patients face barriers to accessing high quality care are widespread, particularly in light of historically low reimbursement rates for Medicaid patients.23;35–38
This work is, to our knowledge, the first large-scale administrative study of wait times in an ambulatory setting, allowing us to document the distribution of wait times, patterns of wait times across patient and provider characteristics, and decomposition of wait time differences. Our analysis complements other studies that found lower health quality of care received by Medicaid patients from examining health outcomes from specific treatments2;3 or rates of receipt of appropriate care.4;5 Our non-health quality measure captures a different aspect of the care experience for Medicaid patients. It avoids some of the challenges in measuring care quality and its differences across populations, including biases from self reports, classification errors in determining appropriate care, and, most importantly, health differences between Medicaid and privately insured patients.6 In particular, wait time differences between Medicaid and privately insured patients are not affected by differences in the observable health of these populations, as reflected by diagnosis codes. However, differences in wait time for Medicaid and privately insured patients could potentially reflect other differences between such patients, such as income, rather than insurance per se. This may have implications for the efficiency of differential wait times, as higher income patients forego higher potential wages when they wait in physician’s offices.
Conclusion
Our results provide new evidence about how long patients wait to see their doctors, and how much longer Medicaid patients wait. Wait time is one component of quality of care and may proxy for other aspects of the healthcare experience. Medicaid patients wait even longer relatively to privately insured patients in states with lower Medicaid reimbursement rates.
Supplementary Material
Contributor Information
Tamar Oostrom, Massachusetts Institute of Technology.
Liran Einav, Stanford University.
Amy Finkelstein, Massachusetts Institute of Technology.
Notes
- 1.Institute of Medicine Crossing the Quality Chasm: A New Health System for the 21st Century. 1st. Washington, D.C: National Academy Press; 2001. [PubMed] [Google Scholar]
- 2.Gaglia MA, Torguson R, Xue Z, Gonzalez MA, Ben-Dor I, Maluenda G, et al. Effect of Insurance Type on Adverse Cardiac Events After Percutaneous Coronary Intervention. Am J Cardiol. 2011;107(5):675–80. doi: 10.1016/j.amjcard.2010.10.041. [DOI] [PubMed] [Google Scholar]
- 3.Kwok J, Langevin SM, Argiris A, Grandis JR, Gooding WE, Taioli E. The impact of health insurance status on the survival of patients with head and neck cancer. Cancer. 2010;116(2):476–85. doi: 10.1002/cncr.24774. [DOI] [PMC free article] [PubMed] [Google Scholar]
- 4.Weissman JS, Vogeli C, Levy DE. The Quality of Hospital Care for Medicaid and Private Pay Patients. Med Care. 2013;51(5):389–95. doi: 10.1097/MLR.0b013e31827fef95. [DOI] [PubMed] [Google Scholar]
- 5.McMorrow S, Long SK, Fogel A. Primary Care Providers Ordered Fewer Preventative Services for Women with Medicaid than for Women with Private Coverage. Health Aff. 2015;34(6):1001–9. doi: 10.1377/hlthaff.2014.0907. [DOI] [PubMed] [Google Scholar]
- 6.Frakt A, Carroll AE, Pollack HA, Reinhardt U. Our Flawed but Beneficial Medicaid Program. N Engl J Med. 2011;364(16):e31. doi: 10.1056/NEJMp1103168. [DOI] [PubMed] [Google Scholar]
- 7.Leddy KM, Kaldenberg DO, Becker BW. Timeliness in Ambulatory Care Treatment: An Examination of Patient Satisfaction and Wait Times in Medical Practices and Outpatient Test and Treatment Facilities. J Ambul Care Manage. 2003;26(2):138–49. doi: 10.1097/00004479-200304000-00006. [DOI] [PubMed] [Google Scholar]
- 8.Ray KN, Chari AV, Engberg J, Bertolet M, Mehrotra A. Disparities in Time Spent Seeking Medical Care in the United States. JAMA Intern Med. 2015;175(12):1983–6. doi: 10.1001/jamainternmed.2015.4468. [DOI] [PMC free article] [PubMed] [Google Scholar]
- 9.Park CY, Lee MA, Epstein AJ. Variation in Emergency Department Wait Times for Children by Race/Ethnicity and Payment Source. Health Serv Res. 2009 Dec;44(6):2022–2039. doi: 10.1111/j.1475-6773.2009.01020.x. [DOI] [PMC free article] [PubMed] [Google Scholar]
- 10.Horwitz LI, Green J, Bradley EH. US Emergency Department Performance onWait Time and Length of Visit. Ann Emerg Med. 2010;55(2):133–41. doi: 10.1016/j.annemergmed.2009.07.023. [DOI] [PMC free article] [PubMed] [Google Scholar]
- 11.Wilper AP, Woolhandler S, Lasser KE, McCormick D, Cutrona SL, Bor DH, et al. Waits To See An Emergency Department Physician: U.S. Trends And Predictors, 19972004. Health Aff. 2008;27(2):84–95. doi: 10.1377/hlthaff.27.2.w84. [DOI] [PubMed] [Google Scholar]
- 12.Medical Access Study Group. Access of Medicaid Recipients to Outpatient Care. N Engl J Med. 1994;330:1426–30. doi: 10.1056/NEJM199405193302007. [DOI] [PubMed] [Google Scholar]
- 13.Asplin BR, Rhodes KV, Levy H, Lurrie N, Crain AL, Carlin BP, et al. Insurance status and access to urgent ambulatory care follow-up appointments. JAMA. 2005;294(10):1248–54. doi: 10.1001/jama.294.10.1248. [DOI] [PubMed] [Google Scholar]
- 14.Richards MR, Saloner B, Kenney GM, Rhodes K, Polsky D. Access Points for the Underserved: Primary Care Appointment Availability at Federally Qualified Health Centers in 10 States. Med Care. 2014;52:818–25. doi: 10.1097/MLR.0000000000000184. [DOI] [PubMed] [Google Scholar]
- 15.Government Accountability Office Medicaid and CHIP: Most Physicians Serve Covered Children but Have Difficulty Referring them to Specialists. Washington, DC: U.S. Government Accountability Office; 2011. GAO-11-624. (Accessed March 7, 2016 at http://www.gao.gov/new.items/d11624.pdf) [Google Scholar]
- 16.Bisgaier J, Rhodes KV. Auditing Access to Specialty Care for Children with Public Insurance. N Engl J Med. 2011;364(24):2324–33. doi: 10.1056/NEJMsa1013285. [DOI] [PubMed] [Google Scholar]
- 17.Skaggs DL, Clemens SM, Vitale MG, Femino JD, Kay RM. Access to Orthopedic Care for Children With Medicaid Versus Private Insurance in California. Pediatrics. 2001;107(6):1405–9. doi: 10.1542/peds.107.6.1405. [DOI] [PubMed] [Google Scholar]
- 18.Resneck J, Pletcher MJ, Lozano N. Medicare, Medicaid, and Access to Dermatologists: The Effect of Patient Insurance on Appointment Access and Wait Times. J Am Acad Dermatol. 2004;50(1):85–92. doi: 10.1016/s0190-9622(03)02463-0. [DOI] [PubMed] [Google Scholar]
- 19.Galbraith AA, Grossman DC, Koepsell TD, Heagerty PJ, Christakis DA. Medicaid Acceptance and Availability of Timely Follow-up for Newborns With Medicaid. Pediatrics. 2005;116(5):1148. doi: 10.1542/peds.2004-2584. [DOI] [PubMed] [Google Scholar]
- 20.Blanchard J, Ogle K, Thomas O, Lung D, Asplin B, Lurie N. Access to Appointments Based on Insurance Status in Washington, D.C. J Health Care Poor Underserved. 2008;19(3):687–96. doi: 10.1353/hpu.0.0036. [DOI] [PubMed] [Google Scholar]
- 21.Chaudhry SB, Armbrecht ES, Shin Y, Matula S, Caffrey C, Varade R, et al. Pediatric access to dermatologists: Medicaid versus private insurance. J Am Acad Dermatol. 2013;68(5):738–48. doi: 10.1016/j.jaad.2012.10.034. [DOI] [PubMed] [Google Scholar]
- 22.Tipirneni R, Rhodes KV, Hayward RA, Lichtenstein RL, Reamer EN, Davis MM. Primary Care Appointment Availability For New Medicaid Patients Increased After Medicaid Expansion In Michigan. Health Aff. 2015;34(8):1399–1406. doi: 10.1377/hlthaff.2014.1425. [DOI] [PubMed] [Google Scholar]
- 23.Polsky D, Richards M, Basseyn S, Wissoker D, Kenney GM, Zuckerman S, et al. Appointment Availability after Increases in Medicaid Payments for Primary Care. N Engl J Med. 2015;372(6):537–45. doi: 10.1056/NEJMsa1413299. [DOI] [PubMed] [Google Scholar]
- 24.Rhodes KV, Kenney GM, Friedman AB, Saloner B, Lawon C, Chearo D, et al. Primary Care Access for New Patients on the Eve of Health Care Reform. JAMA Intern Med. 2014;174(6):861–9. doi: 10.1001/jamainternmed.2014.20. [DOI] [PubMed] [Google Scholar]
- 25.Cheung PT, Wiler JL, Lowe RA, Ginde AA. Health policy/brief research report: National Study of Barriers to Timely Primary Care and Emergency Department Utilization Among Medicaid Beneficiaries. Ann Emerg Med. 2012;60:4–10. doi: 10.1016/j.annemergmed.2012.01.035. [DOI] [PubMed] [Google Scholar]
- 26.Coberly S. The Basics: Relative Value Units (RVUs) National Health Policy Forum. 2015 (Accessed August 10, 2016 at https://www.nhpf.org/library/thebasics/basics_rvus_011215.pdf) [PubMed]
- 27.Medicaid and CHIP Payment Access Commission. Report to Congress on Medicaid and CHIP. 2015 (Accessed May 30, 2016 at https://www.macpac.gov/wp-content/uploads/2015/03/An-Update-on-the-Medicaid-Primary-Care-Payment-Increase.pdf)
- 28.To access the Appendix, click on the Appendix link in the box to the right of the article online.
- 29.Center for Disease Control. National Ambulatory Medical Care Survey Summary Table. 2012 (Accessed August 15, 2016 at http://www.cdc.gov/nchs/data/ahcd/namcs_summary/2012_namcs_web_tables.pdf)
- 30.Komaromy M, Lurie N, Bindman AB. California physicians’ willingness to care for the poor. West J Med. 1995;162(2):127–132. [PMC free article] [PubMed] [Google Scholar]
- 31.Geissler KH, Lubin B, Ericson KMM. Access is Not Enough. Med Care. 2016;54(4):350. doi: 10.1097/MLR.0000000000000488. [DOI] [PubMed] [Google Scholar]
- 32.Perloff JD, Kletke P, Fossett JW. Which Physicians Limit Their Medicaid Participation, and Why. Health Serv Res. 1995;30(1):7–26. [PMC free article] [PubMed] [Google Scholar]
- 33.Perloff JD, Kletke PR, Neckerman KM. Physicians’ Decisions to Limit Medicaid Participation: Determinants and Policy Implications. J Health Polit Policy Law. 1987;12(2):221–236. doi: 10.1215/03616878-12-2-221. [DOI] [PubMed] [Google Scholar]
- 34.Cunningham P, May J. Medicaid patients increasingly concentrated among physicians. Center For Studying Health System Change. 2006;(16):1–5. [PubMed] [Google Scholar]
- 35.Decker SL. In 2011 Nearly One-Third Of Physicians Said They Would Not Accept New Medicaid Patients, But Rising Fees May Help. Health Aff. 2012;31(8):1673–9. doi: 10.1377/hlthaff.2012.0294. [DOI] [PMC free article] [PubMed] [Google Scholar]
- 36.Cunningham PJ, Nichols LM. The Effects of Medicaid Reimbursement on the Access to Care of Medicaid Enrollees: A Community Perspective. Med Care Res Rev. 2005;62(6):676–96. doi: 10.1177/1077558705281061. [DOI] [PubMed] [Google Scholar]
- 37.Berman S, Dolins J, Tang Sf, Yudkowsky B. Factors that influence the willingness of private primary care pediatricians to accept more Medicaid patients. Pediatrics. 2002;110:239–48. doi: 10.1542/peds.110.2.239. [DOI] [PubMed] [Google Scholar]
- 38.Davidson SM. Physician Participation in Medicaid: Background and Issues. J Health Polit Policy Law. 1982;6(4):703–17. doi: 10.1215/03616878-6-4-703. [DOI] [PubMed] [Google Scholar]
Associated Data
This section collects any data citations, data availability statements, or supplementary materials included in this article.