

Abstract
Non-alcoholic steatohepatitis (NASH) is a form of non-alcoholic fatty liver disease (NAFLD) characterized by steatosis, inflammation, and fibrosis often associated with metabolic syndrome. Fibroblast growth factor 15 (FGF15), an endocrine factor mainly produced in the distal part of small intestine, has emerged to be a critical factor in regulating bile acid homeostasis, energy metabolism, and liver regeneration. We hypothesized that FGF15 alters the development of each of the listed features of NASH. To test this hypothesis, four-week old male Fgf15−/− and their corresponding wild-type (WT) mice were fed either a high fat diet (HFD) or a control chow diet for six months. The results confirmed that HFD feeding for six months in WT mice recapitulated human NASH phenotype, including macrovesicular steatosis, inflammation, and fibrosis. Whereas FGF15 deficiency had no effect on the severity of liver steatosis or inflammation, it was associated with decreased liver fibrosis. Furthermore, FGF15 deficiency resulted in abnormal bile acid homeostasis, increased insulin resistance, increased HFD-induced serum triglycerides, decreased inductions of hepatic cholesterol content by HFD, and altered gene expression of lipid metabolic enzymes. These data suggest that FGF15 improves lipid homeostasis and reduces bile acid synthesis, but promotes fibrosis during the development of NASH.
Keywords: Fibroblast growth factor 15, Non-alcoholic steatohepatitis, Fibrosis, Metabolic syndrome, Bile acids
1. Introduction
Non-alcoholic steatohepatitis (NASH) is a more severe stage within the spectrum of non-alcoholic fatty liver disease (NAFLD) that is often associated with metabolic syndrome, characterized by steatosis, inflammation, and fibrosis. NASH can progress in severity leading to the development of end-stage liver diseases such as cirrhosis and hepatocellular carcinoma (HCC). The prevalence of NASH is currently on the rise and in 2011, it was estimated that NASH afflicts 3-5% of people in the United States (Vernon et al., 2011). Unfortunately, there is currently no approved therapeutics for the treatment of NASH. To address this problem, intense research efforts are ongoing with a few compounds currently in clinical trials. Several of these compounds modulate the functions of a nuclear receptor, farnesoid X receptor (FXR), and its response gene, fibroblast growth factor 19 (FGF19).
Fibroblast growth factor 15 (FGF15) is a member of the family of fibroblast growth factors (FGFs) and its human orthologue is FGF19. Though FGF15 and FGF19 are orthologues they share only 50% amino acid sequence homology (Nishimura et al., 1999; Xie et al., 1999). Unlike most other FGFs, FGF15 does not bind extracellular heparin sulfate and can travel through systemic circulation to affect functions in distal organs. For this reason, FGF15 is known as an endocrine FGF (Ornitz and Itoh, 2015). Upon the activation of FXR in the ileum, FGF15 is induced in enterocytes and secreted into the portal circulation. In the liver, FGF15 binds to its predominant receptor, fibroblast growth factor receptor 4 (FGFR4), a tyrosine kinase receptor, which then activates the mitogen-activated protein kinases (MAPK) signaling pathway. This results in down regulation of the expression of the Cytochrome P450 7a1 (Cyp7a1) gene which encodes a rate-limiting enzyme for bile acid synthesis (Inagaki et al., 2005; Song et al., 2009; Kong et al., 2012; Li et al., 2014). Therefore, FGF15 acts as a negative feedback factor maintaining bile acid homeostasis. Activation of FGFR4 by FGF15 is dependent upon the presence of β-Klotho, a binding partner of FGFR4, which serves as an obligate co-receptor for FGF15 (Lin et al., 2007; Ornitz and Itoh, 2015). In addition to MAPK signaling, FGFR4 activation induces other signaling pathways including phosphoinositide 3-kinase-Protein Kinase B (PI3K-AKT), Rat sarcoma viral oncogene homolog (RAS), signal transducer and activator of transcription (STAT), and phospholipase C-γ (PLC) pathways (Ornitz and Itoh, 2015). FGFR4 has also been shown to antagonize the pathways mediated by nuclear factor kappa-light-chain-enhancer of activated B cells (NF-κB) (Drafahl et al., 2010) and cAMP regulator element binding-peroxisome proliferator-activated receptor γ coactivator 1α (CREB-PGC-1α) (Potthoff et al., 2011). FGF15 may also bind the FGFR1c/β-klotho dimer, but to a lesser extent (Kurosu et al., 2007).
In addition to maintaining bile acid homeostasis, FGF15/19 signaling plays a role in a number of other metabolic functions. For example, in transgenic gain-of-function studies, FGF19 increases insulin sensitivity, decreases serum cholesterol and triglyceride levels, and aids in weight loss (Tomlinson et al., 2002; Fu et al., 2004). FGF15/19 also regulates cellular energy homeostasis by decreasing gluconeogenesis (Potthoff et al., 2011), while increasing protein and glycogen synthesis (Kir et al., 2011). Additionally, FGF15 strongly enhances cell proliferation, stimulating HCC development (Uriarte et al., 2015) and liver regeneration (Uriarte et al., 2013; Kong et al., 2014). Recent studies have also shown that FGF15 may play a detrimental role in the development of carbon tetrachloride induced liver fibrosis (Uriarte et al., 2015). Thus, liver fibrosis was reduced in carbon tetrachloride-treated Fgf15 knockout (KO) mice when compared to wild type (WT) mice. In vitro treatment of hepatocytes with FGF15 induced the expression of connective tissue growth factor (Ctgf), which may enhance fibrosis via activating hepatic stellate cells (HSCs) (Uriarte et al., 2015). However, the role of FGF15 in NALFD and NASH development has not been clarified.
In the current study, we aimed to analyze the effects of FGF15 deficiency in mice on the development of NASH with a focus on steatosis, inflammation, and fibrosis. A long-term high fat diet (HFD) feeding model was selected as it best recapitulates symptoms of metabolic syndrome in humans.
2. Methods
2.1. Animals and treatment
A whole body Fgf15 KO mouse strain (Fgf15−/−) was used with a mixed 75% A129/25% C57BL/6J background (Kong et al., 2014). WT mice with the same genetic background were used as controls. Briefly, homozygous KO and wild-type (WT) colonies were littermates obtained from heterozygous breeders (Fgf15+/−) on a mixed 75% A129/25% C57BL/6J background. The established homozygous KO and WT colonies were expanded with similar genetic background. Four week old male KO and WT mice were fed a HFD (60% calories from lard, 0.2796% cholesterol, 20% calories from carbohydrate, Research Diets catalog #D12492, New Brunswick, NJ; n = 5 for WT and n = 4 for KO) or purified control chow diet (10% calories from lard, 0.00136% cholesterol, 70% calories from carbohydrates, Research Diets catalog # D12450J; n = 4 for both WT and KO). Mice were group-housed and provided food and water ad libitum. Total body weights were measured weekly. Five months after commencing the designated diet, an oral glucose tolerance test was performed. Animals were euthanized at the end of the sixth month of feeding. Blood, liver and ileum samples were collected as previously described (Kong et al., 2009). The animal protocols conducted in this study were approved by the Rutgers Institutional Animal Care and Use Committee.
2.2. Serum biochemical parameters and hepatic lipid composition
Serum levels of triglyceride, cholesterol, bile acids, alanine aminotransferase activity (ALT), and alkaline phosphatase activity (ALP) were measured using commercially available kits according to the manufacturers’ instructions (triglycerides, cholesterol, ALT, and ALP kits -Pointe Scientific, Canton, MI; total bile acids kit - Bioquant, San Diego, CA). Hepatic lipid content was measured as previously described (Li et al., 2012). In brief, tissue lipid extracts were generated by homogenizing 100 mg of tissue in a buffer containing 18 mM Tris (pH 7.5), 300 mM mannitol, 50 mM EGTA, and 0.1 mM phenylmethylsulfonyl fluoride. The homogenate was incubated overnight in 2:1 chloroform-methanol solution with overhead shaking. Water was added to the mixture and the samples were centrifuged to separate the aqueous and lipid phases. The lipid phase was collected and dried via vacuum. The concentrated lipids were dissolved in 60% tertbutanol and 40% Triton X-114/methanol (2:1) mix and analyzed for triglyceride and cholesterol using the previously described kits.
2.3. Histology
Frozen liver samples were sectioned and stained with hematoxylin and eosin (H&E) or Sirius Red and severity scored for histomorphological characteristics of NAFLD. Fibrosis was represented as the percent of tissue area positive for Sirius Red staining determined using ImageJ software (Schneider et al., 2012). Liver sections were immunohistochemically stained for desmin (PIPA519063; Thermo Fisher Scientific, Waltham, MA) with percent positive stained cells calculated with Image Pro Plus (Media Cybernetics Inc., Rockville, MD). Images were captured with a VS120 Slide Scanner (Olympus, Center Valley, PA).
2.4. Gene expression
Total RNA was extracted from homogenized frozen tissue samples in TRIzol Reagent (Thermo Fisher Scientific; Waltham, MA) and reverse transcribed to cDNA. Relative expression of genes of interest was determined via RT q-PCR with Sybr Green chemistry. Primer sequences are listed in Table 1. Expression of β-actin was used to normalize mRNA levels.
Table 1.
List of primers used in this study.
| Gene | Forward primer | Reverse primer |
|---|---|---|
| β-Actin | 5′- GCGTGACATCAAAGAGAAGC- 3′ | 5′- CTCGTTGCCAATAGTGATGAC- 3′ |
| αSMA | 5′- CCTGACGGGCAGGTGATC- 3′ | 5′- ATGAAAGATGGCTGGAAGAGAGTCT- 3′ |
| Acss2 | 5′- AAACACGCTCAGGGAAAATCA- 3′ | 5′- ACCGTAGATGTATCCCCCAGG- 3′ |
| Bsep | 5′- TGAATGGACTGTCGGTATCTGTG- 3′ | 5′- CCACTGCTCCCAACGAATG- 3′ |
| Cd36 | 5′- GATGACGTGGCAAAGAACAG- 3′ | 5′- TCCTCGGGGTCCTGAGTTAT- 3′ |
| Collagen 1α1 | 5′- GAGAGAGCATGACCGATGGATT- 3′ | 5′- TGTAGGCTACGCTGTTCTTGCA- 3′ |
| Ctgf | 5′- GGCCTCTTCTGCGATTTCG- 3′ | 5′- CCATCTTTGGCAGTGCACACT- 3′ |
| Cyp4a10 | 5′- TTCCCTGATGGACGCTCTTTA- 3′ | 5′- GCAAACCTGGAAGGGTCAAAC- 3′ |
| Cyp7a1 | 5′- AACAACCTGCCAGTACTAGATAGC- 3′ | 5′- GTGTAGAGTGAAGTCCTCCTTAGC- 3′ |
| Cyp8b1 | 5′- AGTACACATGGACCCCGACATC- 3′ | 5′- GGGTGCCATCCGGGTTGAG- 3′ |
| Fas | 5′- GCTGCGGAAACTTCAGGAAAT - 3′ | 5′- AGAGACGTGTCACTCCTGGACTT - 3′ |
| Fgf15 | 5′- GCCATCAAGGACGTCAGCA- 3′ | 5′- CTTCCTCCGAGTAGCGAATCAG- 3′ |
| Fxr | 5′- TCCGGACATTCAACCATCAC- 3′ | 5′- TCACTGCACATCCCAGATCTC- 3′ |
| Ibabp | 5′-CCCCAACTATCACCAGACTTC - 3′ | 5′- ACATCCCCGATGGTGGAGAT- 3′ |
| Icam1 | 5′- CAGTCCGCTGTGCTTTGAGA- 3′ | 5′- CGGAAACGAATACACGGTGAT- 3′ |
| Mtp | 5′- CAAGCTCACGTACTCCACTGAAG- 3′ | 5′- TCATCATCACCATCAGGATTCCT- 3′ |
| Tgfβ1 | 5′- TTGCCCTCTACAACCAACACAA- 3′ | 5′- GGCTTGCGACCCACGTAGTA- 3′ |
| Timp1 | 5′- CCTTGCAAACTGGAGAGTGACA- 3′ | 5′- AGGCAAAGTGATCGCTCTGGT- 3′ |
| Tnfα | 5′- ACAAGGCTGCCCCGACTAC- 3′ | 5′- TTTCTCCTGGTATGAGATAGCAAATC- 3′ |
2.5. Protein analysis
Crude membrane fractions were prepared to allow for the determination of relative BSEP protein levels in the liver by western blot. Crude membrane fractions were prepared as previously described (Csanaky et al., 2009). Protein concentration of the crude membrane faction was measured by BCA assay (Pierce Biotechnology, Rockford, IL) and 50 μg of protein was resolved in a 10% polyacrylamide gel. Protein was transferred to a PVDF membrane and blocked in 5% nonfat dry milk for 2 hours. Membranes were incubated with anti-BSEP primary antibodies (K44, 1:3000) overnight followed by a 1 hour incubation in a species-specific secondary antibody conjugated to horseradish peroxidase. Bands were detected using Pierce ECL western blotting substrate (Pierce Biotechnology, Rockford, IL). Membrane were stripped (Restore Western Blot Stripping Buffer; Thermo Scientific, Waltham, MA) and re-probed with anti-β-actin antibody (1:1000; JLA20, EMD Millipore, Temecula, CA) as a loading control.
2.6. Statistical analysis
The data are expressed as mean ± standard deviation (SD). Comparison of the multiple treatment groups was performed using two-way ANOVA followed by post-hoc Tukey test. The result is considered significant with P-value less than 0.05. Correlations between ALT and lipid levels were analyzed using simple linear regression and F-test.
3. Results
3.1. Effects of FGF15 deficiency on metabolic syndrome development, liver steatosis, and lipid homeostasis
FGF15 deficient mice fed the chow diet were found to have increased insulin resistance when compared to WT mice, revealed by the glucose tolerance test (Fig. 1A). A trend was seen for worsened insulin resistance in KO mice fed the HFD compared to WT mice (AUC from glucose tolerance test; p-value = 0.06). The effects on insulin resistance were not associated with differences in weight gain as at no point were total body weights found to be different between WT and KO mice on matching diets (Fig. 1B). As early as day 7 after initiation of the study, both WT and KO mice fed the HFD had significantly increased body weights compared to mice on the control diet. Six months of HFD, but not the control chow diet, induced hepatic steatosis in WT mice (Fig. 1C and D). FGF15 deficiency did not affect the severity of hepatic steatosis revealed by staining with Oil Red O. Furthermore, the hepatic triglyceride content measured in liver homogenates from Fgf15−/− mice was not different from those measured in WT mouse livers fed a matching diet (Fig. 1E). There were decreased hepatic total cholesterol levels in KO versus WT mice fed a HFD (Fig. 1E).
Fig. 1.
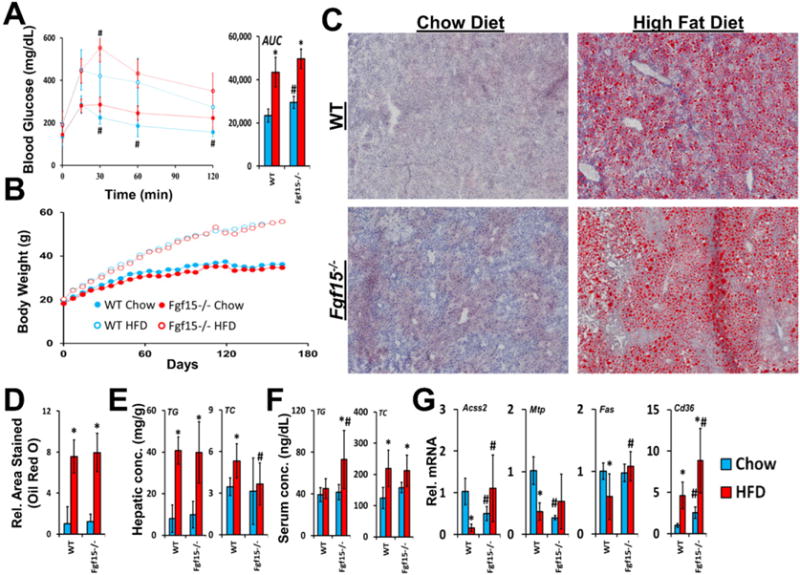
Effects of FGF15 deficiency on development of metabolic syndrome and steatosis. (A) Blood glucose levels were measured after administering an oral glucose challenge. The area under the curve (AUC) from the glucose-time graph was calculated for each group. (B) Body weights were measured weekly after initiating the assigned diet. Body weights of both WT and KO mice fed the HFD were significantly greater when compared to chow diet fed mice as early as day 7. (C) Isolated frozen liver sections were stained with Oil Red O (images taken at 4× magnification) and (D) relative area stained quantified. (E) Tissue concentrations of hepatic total cholesterol and triglycerides were quantified. FGF15 deficiency led to decreased hepatic total cholesterol compared to WT mice. (F) FGF15 deficiency led to increased serum triglycerides when fed HFD. (G) The relative mRNA expression of genes involved in lipid homeostasis was altered in Fgf15−/− mice. *Statistical significance between diets; #Statistical significance between WT and KO mice on corresponding diets (p ≤ 0.05).
In WT mice, HFD increased serum total cholesterol levels but did not affect serum triglycerides (Fig. 1F). In contrast to WT mice, KO mice on HFD had increased serum triglycerides. No differences in serum total cholesterol levels were found between WT and KO mice on either diet.
Although differential effects of FGF15 deficiency on steatosis were not observed histologically or in measurements of hepatic triglyceride content, the expression of genes involved in lipid homeostasis were altered (Fig. 1G). In WT mice HFD resulted in down-regulation of mRNA expression of the fatty acid synthase (Fas) and acyl-CoA synthetase short-chain 2 (Acss2). This was not observed in Fgf15 KO mice fed the HFD, and in fact, expression of these two genes was up-regulated. Basal mRNA levels of microsomal triglyceride transfer protein (Mtp) were reduced in the KO mice. HFD led to decreased Mtp mRNA levels in WT comparable to those of KO. Cd36 encodes for uptake transporter for lipoproteins (Calvo et al., 1998) and long-chain fatty acids (Baillie et al., 1996). HFD increased mRNA levels of Cd36 in both WT and KO mice. There was greater Cd36 expression in KO mice on both diets compared to WT mice.
3.2. Effects on hepatic inflammation and serum biomarkers
WT mice on HFD had mild histomorphologic characteristics and NAFLD Activity Scores of hepatic inflammation (Fig. 2A and B). In WT mice, HFD led to elevations in ALT and ALP activities, indicating hepatocellular and biliary epithelium injury. (Fig. 2C and D). Although the KO mice had higher basal ALP activities, the increase in ALT and ALP following HFD was not seen in KO mice. Knockout of Fgf15 did not significantly alter the expression of the inflammatory mediators tumor necrosis factor α (Tnfα) and intercellular adhesion molecule 1 (Icam1) (Fig. 2F).
Fig. 2.
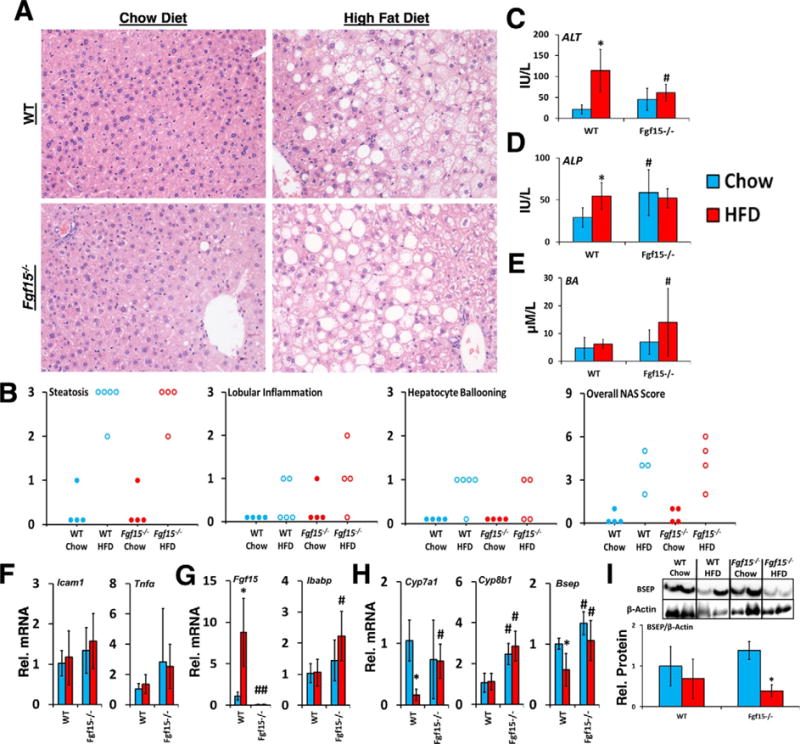
Effects of FGF15 deficiency on liver histology, biomarkers, and bile homeostasis. (A) Liver sections were stained with HE. Images were taken at 20× magnification. (B) HE stained slides were scored based on NAFLD Activity Score criteria. (C and D) FGF15 deficiency led to a basal increased in ALP but attenuated the HFD induced increase in ALT. (E) KO mice fed the HFD had greater serum bile acid levels than WT mice. (F) No differences were observed in the relative mRNA expression of Tnfα and Icam1 in KO mice. (G) Relative mRNA expression of ileal Fgf15 and Ibabp, and (H) hepatic Cyp7a1, Cyp8b1, and Bsep was determined. (I) Relative protein levels of Bsep normalized to β-actin were decreased by HFD in both WT and KO. *Statistical significance between diets; #Statistical significance between WT and knockout mice on corresponding diets (p ≤ 0.05).
As shown in Fig. 2G and H, in WT mice, HFD led to an increase in Fgf15 mRNA expression in ileum, and a decrease in hepatic mRNA expression of the genes encoding bile salt export pump (Bsep) and Cyp7a1. These changes in gene expression were not observed in KO mice fed the HFD at the RNA level. However, HFD decreased the levels of Bsep protein in KO mice more markedly than in WT mice (Fig. 2I). Both chow and HFD fed KO mice had greater Cyp8b1 expression than WT mice. Total serum bile acid levels were greater in HFD-fed KO mice compared to WT mice (Fig. 2E). The relative mRNA levels of ileal intestinal bile acid binding protein (Ibabp) were increased in KO HFD mice compared to WT mice indicating greater activation of ileal FXR (Fig. 2G).
A linear regression analysis comparing ALT to serum and hepatic triglyceride and total cholesterol levels was performed (Fig. 3). The results showed strong correlations of ALT to both hepatic total cholesterol (R2 = 0.57, p < 0.001) and serum total cholesterol levels (R2 = 0.54, p = 0.001). A weaker correlation was found when correlating ALT to hepatic triglyceride content (R2 = 0.33, p = 0.02), and no correlation was observed with serum triglycerides (R2 = 0.01, p = 0.7).
Fig. 3.
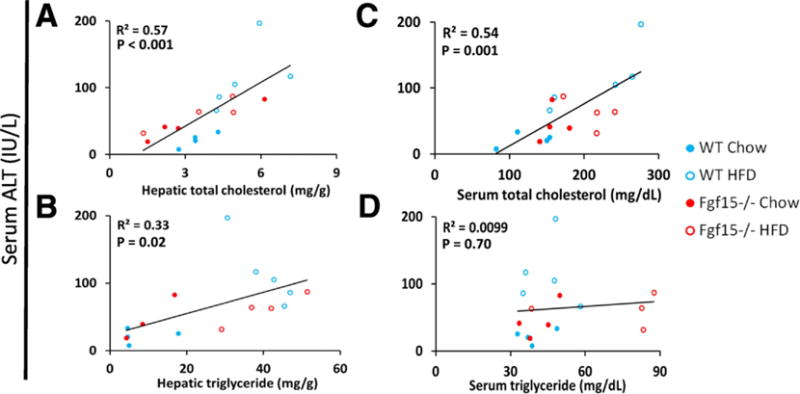
Strong linear correlation between hepatic and serum cholesterol content and serum ALT. Linear regression analysis comparing serum ALT to serum and hepatic total cholesterol and triglycerides was performed. Displayed p-values were calculated by F-test. The scatterplots include datum points from all study animals and are colored based on the group of the respective mouse.
3.3. Effects on hepatic fibrosis
Long-term HFD caused moderate fibrosis in WT mice, however, in this NASH-induced fibrosis model, KO mice are protected from fibrosis (Fig. 4A and B). FGF15 deficiency reduced HFD-induced fibrosis similar to that of WT mice on the control diet. There was also a basal decrease in collagen in Fgf15−/− mice fed the chow diet. In agreement with the Sirius Red staining, the gene expression of collagen 1α1 and tissue inhibitor of metalloproteases 1 (Timp1) was markedly induced by HFD in WT mice (Fig. 4C). Moreover, the chow diet fed KO mice had similar Timp1 but lower collagen 1α1 expression compared to the WT mice. The HFD-induced collagen 1α1 was much smaller in KO mice. There was a trend for decreased α-smooth muscle actin (αSMA; p = 0.06) and Timp1 (p = 0.06) expression in KO mice fed the HFD compared to WT mice. The hepatic expression of transforming growth factor β1 (Tgfβ1) was not changed regardless of diet or FGF15 deficiency. HFD decreased expression of Ctgf but no difference in expression was observed between WT and KO mice. An immunohistochemical staining for the HSC marker, desmin, revealed that the HFD increased the percentage of desmin-positive cells in the livers of WT but not KO mice (Fig. 5).
Fig. 4.
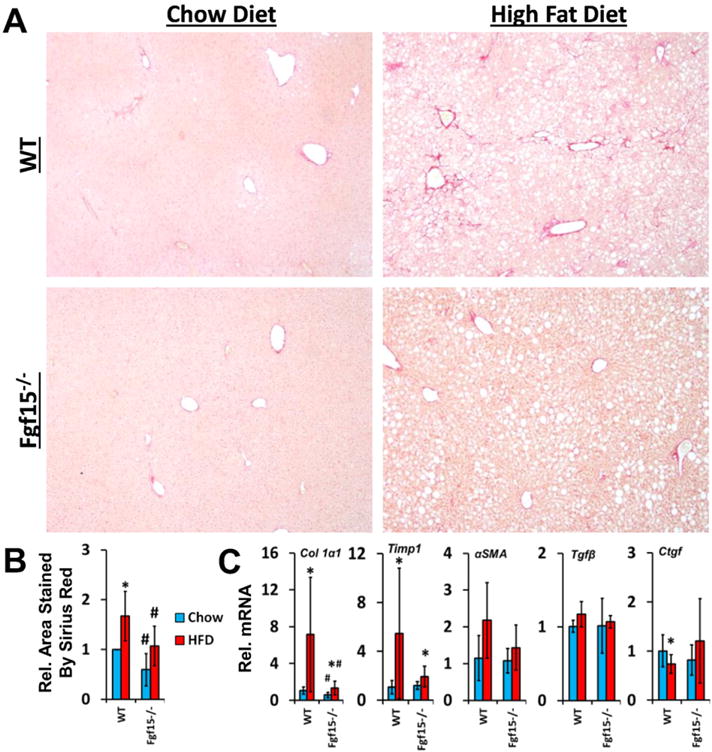
Deficiency of FGF15 attenuates both basal and HFD induced liver fibrosis. (A) Liver sections were stained with Sirius Red (image taken at 4×) and (B) the relative area of the liver stained was quantified. (C) The relative mRNA expression of Collagen 1α1 and Timp1 was decreased in HFD fed Fgf15−/− mice compared to WT mice while expression of Tgfβ1 and Ctgf was not altered. There was a trend for decreased αSMA in HFD-fed KO mice compared to WT mice. *Statistical significance between diets; #Statistical significance between WT and KO mice on corresponding diets (p ≤ 0.05).
Fig. 5.
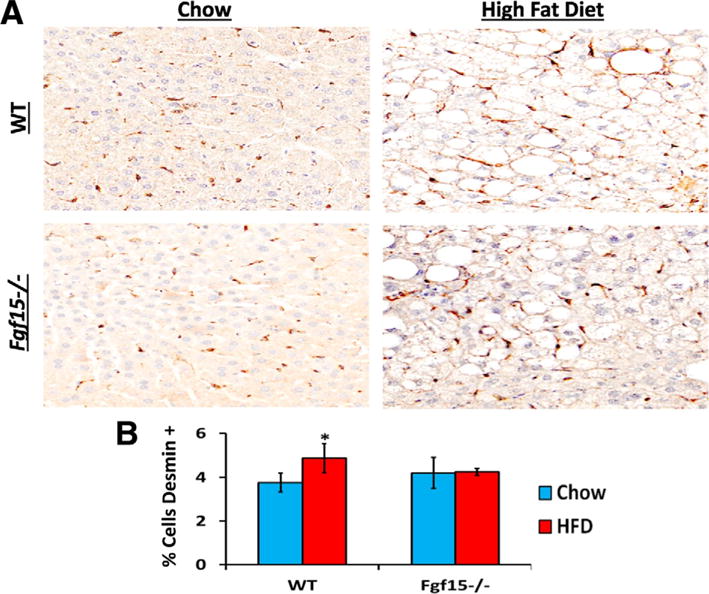
Effects of FGF15 deficiency on the number of HSC in the liver. (A) Liver sections were stained using immunohistochemistry targeting the HSC marker desmin. (B) HFD lead to an increased percentage of desmin positive cells in livers of WT mice but not of FGF15 deficient mice. *Statistical significance between diets; #Statistical significance between WT and KO mice on corresponding diets (p ≤ 0.05).
4. Discussion
In the present studies, we analyzed the effects of FGF15 deficiency in mice on NASH development. The role of FGF15 in maintaining bile acid homeostasis has been previously described (Li et al., 2014). Briefly, activation of FXR in ileal enterocytes leads to the production and secretion of FGF15 into the hepatic portal circulation. FGF15 travels to the liver and activates its predominant receptor, FGFR4, on hepatocytes, which subsequently suppresses bile acid synthesis through the down-regulation of the gene expression of Cyp7a1 (Li et al., 2014). In agreement, these FGF15-mediated negative feedback mechanisms on bile acid production were observed in our studies. HFD in WT animals resulted in up-regulation of FGF15 in the ileum. This is correlated with down-regulation of hepatic mRNA expression of Cyp7a1 and Bsep. Knockout of Fgf15 removed this negative feedback regulation and the expression of Cyp7a1, Cyp8b1, and Bsep remained constant or higher during HFD feeding, manifesting as an increase in total serum bile acid concentrations. Counterintuitively, the levels of Cyp7a1 expression in control fed KO mice were not elevated compared to WT. The reason is not clear but we speculate an age-related propensity for increased liver inflammation (Li et al., 2006), or other factors of the KO mice at the end of this long-term feeding may have contributed to the lack of Cyp7a1 induction as we normally show in younger KO mice.
Previous reports have shown that FGF15/19 regulates glucose homeostasis. Postprandial secretion of FGF15 has been found to repress hepatic gluconeogenesis via inhibition of the CREB-PGC-1α pathway (Potthoff et al., 2011). Transgenic expression of FGF19 in the muscles of mice led to increased basal metabolic rates (Tomlinson et al., 2002). These transgenic mice were resistant to HFD-induced weight gain and also had enhanced insulin sensitivity. Similar findings were observed in a study with HFD in ob/ob mice supplemented with FGF19, which showed that daily administration of FGF19 for one week led to increased metabolic rates, improved insulin sensitivity, and weight loss (Fu et al., 2004). Corresponding to the findings of these FGF19 gain-of-function studies, in our loss-of-function study we observed that Fgf15−/− mice exhibited exacerbated insulin resistance. Furthermore, supplementation of ob/ob mice with recombinant FGF19 led to decreased serum triglyceride and cholesterol levels (Fu et al., 2004). Similarly, basal serum cholesterol levels in our Fgf15 KO mice were elevated compared to WT mice. Whereas no effect was observed on basal serum triglyceride levels in Fgf15−/− mice, there were increased triglycerides in WT mice compared to KO when fed a HFD.
The HFD in our study led to the development of hepatic steatosis in WT mice and a compensatory decrease in expression of genes involved in lipid synthesis, Fas and Acss2. Knockout of Fgf15 prevented this compensatory decrease as the expression of Fas and Acss2 in chow fed and HFD fed Fgf15−/− mice was the same. Additionally, Fgf15−/− mice fed the control diet had decreased expression of Mtp, which is involved in VLDL secretion from the liver, compared to WT. Based on these findings, it is to be expected that Fgf15−/− mice would have exacerbated steatosis as there would be increased lipid synthesis and reduced triglyceride efflux from the liver. Conversely, we found that knockout of Fgf15 had no effect on the severity of steatosis observed histologically or on hepatic lipid compositions. It is possible that FGF15 protects the liver from the development of steatosis and that our model of six months of HFD may have overwhelmed this protective effect. In a similar study to ours, transgenic expression of FGF19 in HFD fed ob/ob mice led to decreased hepatic triglyceride and cholesterol content (Fu et al., 2004). Based on these findings, we speculate that a study with a shorter duration may allow for enhanced understanding of how FGF15 signaling mitigates the development of hepatic steatosis.
Currently, there are two models which attempt to describe the etiology of NASH. The first “two-hit” model proposes that NASH is the result of two sequential events: the accumulation of hepatic lipids followed by an inflammatory insult (Day and James, 1998). In this model, the accumulation of intrahepatic triglycerides is believed to predispose the liver to injury by a subsequent insult. The second model proposes that NASH is a sequelae of systemic inflammation similar to atherosclerosis (Bieghs et al., 2012). In this model, the accumulation of lipids and immune cell activation occur simultaneously rather than as separate events. Elevations in cholesterol are thought to result in aggravated liver injury in NASH. Results from the regression analysis performed in our study are in agreement with the model of systemic inflammation-induced NASH. Both serum and hepatic total cholesterol levels were identified to have strong, positive, linear correlations to ALT. Only a weak correlation was found when comparing hepatic triglyceride content to ALT and no correlation was found between ALT and serum triglyceride levels. We believe these correlations, though not a novel concept, help provide further supporting evidence for a role of cholesterol in the progression of NASH.
In our HFD induced NASH model, deficiency of FGF15 appeared to be protective against the development of fibrosis; it also decreased basal levels of liver collagen. The induction of two fibrotic genes, collagen 1α1 and Timp1, was not evident in Fgf15−/− mice. FGF15 may also affect the proliferation of HSCs as the percent of the liver cell population that was positive for desmin increased in WT mice fed the HFD but not in KO mice. The expression of Tgfβ1 was not altered in Fgf15−/− mice. It is possible that the long study duration allows for the expression levels of Tgfβ1 to normalize after fibrotic development. A future time course study may provide valuable insight into mechanisms underlying the protective effects of FGF15 deficiency on liver fibrosis. Overall, the findings in these studies indicate that FGF15 plays a significant role in the development of fibrosis during HFD-induced NASH.
Mechanisms underlying the protective effect of FGF15 deficiency on the development of liver fibrosis do not appear to be mediated via reduction of hepatic inflammation. No differences were noted in hepatic expression of the inflammatory mediators, Tnfα or Icam1, or in inflammation assessed by histopathological examination. However, hepatic inflammation involves numerous cell types and mediators. Therefore, our initial assessment of the effects of FGF15 on hepatic inflammation is basic and further more in-depth studies are of interest. A recent study reported that deletion of Fgf15 in mice mitigated carbon tetrachloride (CCl4) induced liver fibrosis (Uriarte et al., 2015). Expression of Fgfr4 and β-Klotho were relative low in HSCs compared to hepatocytes. Treatment of multiple hepatocyte cell lines resulted in up-regulation of Ctgf, suggesting that the mechanism by which FGF15 may enhance the development of fibrosis is indirect through induction of CTGF production in hepatocytes followed by a subsequent activation of HSCs via CTGF (Uriarte et al., 2015). Interestingly in our study, we found no differences in the expression of Ctgf between WT and KO mice, indicating another mechanism may be at play.
Although FGFR4 is the primary receptor of FGF15, FGFR1 can also be activated by FGF15 (Uriarte et al., 2015). Despite HSCs have a lower expression of Fgfr4 than hepatocytes, HSCs have a higher levels of Fgfr1 compared to hepatocytes. Additionally, another study found that hypoxia induced transdifferentiation of LX-2 cells, a human HSC cell line, and increased the expression of Fgfr4 by 2.47 fold (Shi et al., 2007). Combined, these observations suggest that FGF15 may have direct effects on HSCs which warrants further studies to test this possibility. It is also possible that FGF15 affects the development of fibrosis through both indirect and direct mechanisms; indirect activation of HSCs via inducing hepatocyte derived CTGF and direct activation of FGFR4 and FGFR1 on HSCs.
In conclusion, the 6 month HFD study model was able to induce the key features of NASH, including steatosis, inflammation, fibrosis, and metabolic syndrome, in our WT mice. Deficiency of FGF15 had both beneficial and detrimental effects on these characteristics of NASH. Fgf15−/− mice fed the HFD had increased insulin resistance, higher levels of serum triglycerides, and abnormal bile acid homeostasis. Additionally, the FGF15 deficient mice did not have altered severity of steatosis or inflammation but were protected against the development of liver fibrosis. Based on our findings and those of a previous study (Uriarte et al., 2013), we speculate that FGF15 promotes liver fibrosis through both direct and indirect mechanisms; activation of FGFR on HSCs and indirectly through induction of hepatocyte derived CTGF.
Supplementary Material
Acknowledgments
This study was supported by National Institutes of Health grants DK081343, DK090036, GM104037, ES-05022, and 5T32ES007148.
Abbreviations
- Acss2
Acyl-CoA synthetase short-chain 2
- Akt
Protein kinase B
- ALP
Alkaline phosphatase
- ALT
Alanine aminotransferase
- Bsep
Bile salt export pump
- Creb-Pgc-1α
cAMP regulator element binding-peroxisome proliferator-activated receptor γ coactivator 1α
- Ctgf
Connective tissue growth factor
- Cyp4a10
Cytochrome p450 4a10
- Cyp7a1
Cytochrome p450 7a1
- Cyp8b1
Cytochrome p450 8b1
- Fas
Fatty acid synthase
- Fgf15
Fibroblast growth factor 15
- Fgf19
Fibroblast growth factor 19
- Fgf21
Fibroblast growth factor 21
- Fgfr4
Fibroblast growth factor receptor 4
- Fgfr1c
Fibroblast growth factor receptor 1c
- HCC
Hepatocellularcarcinoma
- HE
Hematoxylin and Eosin
- Ibabp
Intestinal bile acid binding protein
- Icam1
Intercellular adhesion molecule 1
- HFD
High fat diet, HSCshepatic stellate cells
- MAPK
Mitogen-activated protein kinases
- MCDD
Methionine choline deficient diet
- Mtp
microsomal triglyceride transfer protein
- NASH
Non-alcoholic steatohepatitis
- NF-κB
Nuclear factor kappa-light-chain-enhancer of activated B cells
- PI3K
Phosphoinositide 3-kinase
- PLC
Phospholipase C-γ
- RAS
Rat sarcoma viral oncogene homolog
- STAT
Signal transducer and activator of transcription
- Tgfβ1
Transforming growth factor β1
- Tnfα
Tumor necrosis factor α
- WT
Wild type
Appendix A. Supplementary data
Supplementary data to this article can be found online at http://dx.doi.org/10.1016/j.taap.2017.06.023.
Footnotes
Conflict of interest
None.
References
- Baillie AG, Coburn CT, Abumrad NA. Reversible binding of long-chain fatty acids to purified FAT, the adipose CD36 homolog. J Membr Biol. 1996;153:75–81. doi: 10.1007/s002329900111. [DOI] [PubMed] [Google Scholar]
- Bieghs V, Rensen PC, Hofker MH, Shiri-Sverdlov R. NASH and atherosclerosis are two aspects of a shared disease: central role for macrophages. Atherosclerosis. 2012;220:287–293. doi: 10.1016/j.atherosclerosis.2011.08.041. [DOI] [PubMed] [Google Scholar]
- Calvo D, Gomez-Coronado D, Suarez Y, Lasuncion MA, Vega MA. Human CD36 is a high affinity receptor for the native lipoproteins HDL, LDL, and VLDL. J Lipid Res. 1998;39:777–788. [PubMed] [Google Scholar]
- Csanaky IL, Aleksunes LM, Tanaka Y, Klaassen CD. Role of hepatic transporters in prevention of bile acid toxicity after partial hepatectomy in mice. Am J Physiol Gastrointest Liver Physiol. 2009;297:G419–G433. doi: 10.1152/ajpgi.90728.2008. [DOI] [PMC free article] [PubMed] [Google Scholar]
- Day CP, James OF. Steatohepatitis: a tale of two “hits”? Gastroenterology. 1998;114:842–845. doi: 10.1016/s0016-5085(98)70599-2. [DOI] [PubMed] [Google Scholar]
- Drafahl KA, McAndrew CW, Meyer AN, Haas M, Donoghue DJ. The receptor tyrosine kinase FGFR4 negatively regulates NF-kappaB signaling. PloS One. 2010;5:e14412. doi: 10.1371/journal.pone.0014412. [DOI] [PMC free article] [PubMed] [Google Scholar]
- Fu L, John LM, Adams SH, Yu XX, Tomlinson E, Renz M, Williams PM, Soriano R, Corpuz R, Moffat B, Vandlen R, Simmons L, Foster J, Stephan JP, Tsai SP, Stewart TA. Fibroblast growth factor 19 increases metabolic rate and reverses dietary and leptin-deficient diabetes. Endocrinology. 2004;145:2594–2603. doi: 10.1210/en.2003-1671. [DOI] [PubMed] [Google Scholar]
- Inagaki T, Choi M, Moschetta A, Peng L, Cummins CL, McDonald JG, Luo G, Jones SA, Goodwin B, Richardson JA, Gerard RD, Repa JJ, Mangelsdorf DJ, Kliewer SA. Fibroblast growth factor 15 functions as an enterohepatic signal to regulate bile acid homeostasis. Cell Metab. 2005;2:217–225. doi: 10.1016/j.cmet.2005.09.001. [DOI] [PubMed] [Google Scholar]
- Kir S, Beddow SA, Samuel VT, Miller P, Previs SF, Suino-Powell K, Xu HE, Shulman GI, Kliewer SA, Mangelsdorf DJ. FGF19 as a postprandial, insulin-independent activator of hepatic protein and glycogen synthesis. Science (New York, N.Y) 2011;331:1621–1624. doi: 10.1126/science.1198363. [DOI] [PMC free article] [PubMed] [Google Scholar]
- Kong B, Luyendyk JP, Tawfik O, Guo GL. Farnesoid X receptor deficiency induces nonalcoholic steatohepatitis in low-density lipoprotein receptor-knockout mice fed a high-fat diet. J Pharmacol Exp Ther. 2009;328:116–122. doi: 10.1124/jpet.108.144600. [DOI] [PMC free article] [PubMed] [Google Scholar]
- Kong B, Wang L, Chiang JY, Zhang Y, Klaassen CD, Guo GL. Mechanism of tissue-specific farnesoid X receptor in suppressing the expression of genes in bile-acid synthesis in mice. Hepatology (Baltimore, Md) 2012;56:1034–1043. doi: 10.1002/hep.25740. [DOI] [PMC free article] [PubMed] [Google Scholar]
- Kong B, Huang J, Zhu Y, Li G, Williams J, Shen S, Aleksunes LM, Richardson JR, Apte U, Rudnick DA, Guo GL. Fibroblast growth factor 15 deficiency impairs liver regeneration in mice. Am J Physiol Gastrointest Liver Physiol. 2014;306:G893–G902. doi: 10.1152/ajpgi.00337.2013. [DOI] [PMC free article] [PubMed] [Google Scholar]
- Kurosu H, Choi M, Ogawa Y, Dickson AS, Goetz R, Eliseenkova AV, Mohammadi M, Rosenblatt KP, Kliewer SA, Kuro-o M. Tissue-specific expression of betaKlotho and fibroblast growth factor (FGF) receptor isoforms determines metabolic activity of FGF19 and FGF21. J Biol Chem. 2007;282:26687–26695. doi: 10.1074/jbc.M704165200. [DOI] [PMC free article] [PubMed] [Google Scholar]
- Li T, Jahan A, Chiang JYL. Bile acids and cytokines inhibit the human cholesterol 7α-hydroxylase gene via the JNK/c-Jun pathway. Hepatology (Baltimore, Md) 2006;43:1202–1210. doi: 10.1002/hep.21183. [DOI] [PMC free article] [PubMed] [Google Scholar]
- Li G, Thomas AM, Williams JA, Kong B, Liu J, Inaba Y, Xie W, Guo GL. Farnesoid X Receptor Induces Murine Scavenger Receptor Class B Type I via Intron Binding. PloS One. 2012;7 doi: 10.1371/journal.pone.0035895. [DOI] [PMC free article] [PubMed] [Google Scholar]
- Li S, Hsu DDF, Li B, Luo X, Alderson N, Qiao L, Ma L, Zhu HH, He Z, Suino-Powell K, Ji K, Li J, Shao J, Xu HE, Li T, Feng GS. Cytoplasmic Tyrosine Phosphatase Shp2 Coordinates Hepatic Regulation of Bile Acid and FGF15/19 Signaling to Repress Bile Acid Synthesis. Cell Metab. 2014;20:320–332. doi: 10.1016/j.cmet.2014.05.020. [DOI] [PMC free article] [PubMed] [Google Scholar]
- Lin BC, Wang M, Blackmore C, Desnoyers LR. Liver-specific activities of FGF19 require Klotho beta. J Biol Chem. 2007;282:27277–27284. doi: 10.1074/jbc.M704244200. [DOI] [PubMed] [Google Scholar]
- Nishimura T, Utsunomiya Y, Hoshikawa M, Ohuchi H, Itoh N. Structure and expression of a novel human FGF, FGF-19, expressed in the fetal brain. Biochimica et biophysica acta. 1999;1444:148–151. doi: 10.1016/s0167-4781(98)00255-3. [DOI] [PubMed] [Google Scholar]
- Ornitz DM, Itoh N. The Fibroblast Growth Factor signaling pathway. Wiley Interdiscip Rev Dev Biology. 2015;4:215–266. doi: 10.1002/wdev.176. [DOI] [PMC free article] [PubMed] [Google Scholar]
- Potthoff MJ, Boney-Montoya J, Choi M, He T, Sunny NE, Satapati S, Suino-Powell K, Xu HE, Gerard RD, Finck BN, Burgess SC, Mangelsdorf DJ, Kliewer SA. FGF15/19 regulates hepatic glucose metabolism by inhibiting the CREB-PGC-1alpha pathway. Cell Metab. 2011;13:729–738. doi: 10.1016/j.cmet.2011.03.019. [DOI] [PMC free article] [PubMed] [Google Scholar]
- Schneider CA, Rasband WS, Eliceiri KW. NIH Image to ImageJ: 25 years of image analysis. Nat Methods. 2012;9:671–675. doi: 10.1038/nmeth.2089. [DOI] [PMC free article] [PubMed] [Google Scholar]
- Shi YF, Fong CC, Zhang Q, Cheung PY, Tzang CH, Wu RS, Yang M. Hypoxia induces the activation of human hepatic stellate cells LX-2 through TGF-beta signaling pathway. FEBS Lett. 2007;581:203–210. doi: 10.1016/j.febslet.2006.12.010. [DOI] [PubMed] [Google Scholar]
- Song KH, Li T, Owsley E, Strom S, Chiang JY. Bile acids activate fibroblast growth factor 19 signaling in human hepatocytes to inhibit cholesterol 7alpha-hydroxylase gene expression. Hepatology (Baltimore, Md) 2009;49:297–305. doi: 10.1002/hep.22627. [DOI] [PMC free article] [PubMed] [Google Scholar]
- Tomlinson E, Fu L, John L, Hultgren B, Huang X, Renz M, Stephan JP, Tsai SP, Powell-Braxton L, French D, Stewart TA. Transgenic mice expressing human fibroblast growth factor-19 display increased metabolic rate and decreased adiposity. Endocrinology. 2002;143:1741–1747. doi: 10.1210/endo.143.5.8850. [DOI] [PubMed] [Google Scholar]
- Uriarte I, Fernandez-Barrena MG, Monte MJ, Latasa MU, Chang HC, Carotti S, Vespasiani-Gentilucci U, Morini S, Vicente E, Concepcion AR, Medina JF, Marin JJ, Berasain C, Prieto J, Avila MA. Identification of fibroblast growth factor 15 as a novel mediator of liver regeneration and its application in the prevention of post-resection liver failure in mice. Gut. 2013;62:899–910. doi: 10.1136/gutjnl-2012-302945. [DOI] [PubMed] [Google Scholar]
- Uriarte I, Latasa MU, Carotti S, Fernandez-Barrena MG, Garcia-Irigoyen O, Elizalde M, Urtasun R, Vespasiani-Gentilucci U, Morini S, de Mingo A, Mari M, Corrales FJ, Prieto J, Berasain C, Avila MA. Ileal FGF15 contributes to fibrosis-associated hepatocellular carcinoma development. Int J Cancer. 2015;136:2469–2475. doi: 10.1002/ijc.29287. [DOI] [PubMed] [Google Scholar]
- Vernon G, Baranova A, Younossi ZM. Systematic review: the epidemiology and natural history of non-alcoholic fatty liver disease and non-alcoholic steatohepatitis in adults. Aliment Pharmacol Ther. 2011;34:274–285. doi: 10.1111/j.1365-2036.2011.04724.x. [DOI] [PubMed] [Google Scholar]
- Xie MH, Holcomb I, Deuel B, Dowd P, Huang A, Vagts A, Foster J, Liang J, Brush J, Gu Q, Hillan K, Goddard A, Gurney AL. FGF-19, a novel fibroblast growth factor with unique specificity for FGFR4. Cytokine. 1999;11:729–735. doi: 10.1006/cyto.1999.0485. [DOI] [PubMed] [Google Scholar]
Associated Data
This section collects any data citations, data availability statements, or supplementary materials included in this article.