

Abstract
Aureochrome1 is a blue-light-receptor protein identified in a stramenopile alga, Vaucheria frigida. Photozipper (PZ) is an N-terminally truncated, monomeric, V. frigida aureochrome1 fragment containing a basic leucine zipper (bZIP) domain and a light–oxygen–voltage (LOV)-sensing domain. PZ dimerizes upon photoexcitation and consequently increases its affinity for the target sequence. In the present study, to understand the equilibria among DNA complexes of PZ, DNA binding by PZ and mutational variants was quantitatively investigated by electrophoretic-mobility-shift assay and fluorescence-correlation spectroscopy in the dark and light states. DNA binding by PZ was sequence-specific and light-dependent. The half-maximal effective concentration of PZ for binding to the target DNA sequence was ~40 nM in the light, which was >10-fold less than the value in the dark. By contrast, the dimeric PZ-S2C variant (with intermolecular disulfide bonds) had higher affinity for the target sequence, with dissociation constants of ~4 nM, irrespective of the light conditions. Substitutions of Glu159 and Lys164 in the leucine zipper region decreased the affinity of PZ for the target sequence, especially in the light, suggesting that these residues form inter-helical salt bridges between leucine zipper regions, stabilizing the dimer–DNA complex. Our quantitative analyses of the equilibria in PZ–DNA-complex formation suggest that the blue-light-induced dimerization of LOV domains and coiled-coil formation by leucine zipper regions are the primary determinants of the affinity of PZ for the target sequence.
Keywords: transcription factor, DNA-binding, aureochrome, LOV domain, optogenetics
Significance.
Photozipper (PZ) is a light-regulated dimerizing module containing bZIP domain and a LOV domain of V. frigida aureochrome1. Here, we quantitatively investigated DNA-binding of PZ and proposed a quantitative model for the equilibria in PZ–DNA-complex formation. PZ exhibited about 10 times increase in its affinity for binding to the target sequence in a light-dependent manner. The blue-light-induced dimerization of LOV domains and coiled-coil formation by leucine zipper regions stabilize dimeric complex with the target DNA sequence. This work suggested that PZ could be a powerful module to light-control interactions with substrates for optogenetics.
Formation of complexes between transcription factors and DNA is essential for transcriptional regulation. Many transcription factors form dimeric complexes with DNA, including proteins in the basic leucine zipper (bZIP) [1–3], basic helix-loop-helix [4] and homeodomain families [5]. These transcription factors frequently possess PAS domains that provide dimerization interfaces [6–9]. The light–oxygen–voltage (LOV)-sensing domain, which belongs to the PAS-domain superfamily, has a role in blue-light (BL) recognition [10]. The LOV domain accommodates a flavin mononucleotide as a chromophore that forms a covalent adduct with a highly conserved cysteine residue upon photoactivation [10–12]. This photochemical reaction triggers conformational change of the LOV domain, modulating intramolecular and intermolecular interactions [13]. LOV domains have therefore been utilized for optogenetic applications for light-inducible control of genetic regulation and protein activity [14–17].
A family of LOV-domain-containing proteins, the aureochrome family, was first identified by characterization of a BL receptor in a stramenopile alga, Vaucheria frigida [18]. The V. frigida proteins aureochrome1 (VfAUREO1) and aureochrome2 (VfAUREO2) are thought to have roles in BL-induced branching and development of sex organs, respectively [18]. Aureochrome orthologs have only been identified in photosynthetic stramenopiles [19–22]. Aureochrome proteins possess a bZIP domain to the N-terminal side of the LOV domain. Recombinant VfAUREO1 binds to the target sequence TGACGT in a light-dependent manner, implying that VfAUREO1 functions as a BL-regulated transcription factor [18].
VfAUREO1 possibly senses not only light, but also redox potential [23]. Under oxidative conditions, an N-terminally truncated variant VfAUREO1 (ZL) containing the bZIP and LOV domains dimerizes through intermolecular disulfide linkages at Cys162 and Cys182, and binds strongly to the target sequence [23]. Dynamic light scattering and size-exclusion chromatography (SEC) analyses showed that recombinant VfAUREO1 is monomeric in reducing conditions in the dark state [23]. BL induces non-covalent dimerization, which increases its affinity for the target DNA sequence [23,24]. These results suggest that dimerization has an important role in DNA binding by VfAUREO1. However, an N-terminal truncation of aureochrome1a from the diatom Phaeodactylum tricornutum (PtAUREO1a) containing bZIP and LOV domains has been shown to predominantly exist as a dimer even in the dark state, even though PtAUREO1a does not possess cysteine residues outside its LOV domain [25,26].
LOV domains of both VfAUREO1 and PtAUREO1a exist in monomer–dimer equilibria in the dark and dimerize upon photoexcitation [27,28]. Crystal structures of the LOV domains without light activation show that, in each, the N-terminal A′α helix covers a hydrophobic area of the β sheet in the LOV core [25,29,30]. Fourier-transform infrared spectroscopic studies and a crystal structure of a light-adapted LOV dimer suggest that structural changes in the A′α helices and C-terminal Jα helices expose the hydrophobic surfaces in the LOV cores [25,28,31]. Dimerization of LOV domains through interactions between these hydrophobic surfaces is likely to increase the affinity of aureochromes for their target sequences.
We previously showed that an N-terminally truncated VfAUREO1 variant (ZLC2S) in which Cys162 and Cys182 are substituted with serine, mimics the monomeric form of VfAUREO1, even in acidic conditions [23]. To elucidate the mechanism of action of this BL-regulated transcription factor, and to develop it as an optogenetic tool, we synthesized a gene (opZL) encoding ZLC2S with a histidine hexamer at the C-terminus, which we designated the Photozipper (PZ) protein. Quantitative analyses of the monomer–dimer equilibria for PZ constructs suggested that the intramolecular LOV–ZIP interaction stabilizes the monomeric form in the dark, and the intermolecular LOV–LOV and ZIP–ZIP interactions stabilize the dimeric form in the light [32]. The results of hydrogen–deuterium-exchange mass spectroscopic analyses of PtAUREO1a support this model [25].
Our present study was conducted to investigate DNA binding by PZ and several PZ variants, using spectroscopic, chromatographic and electrophoretic assays. Our data demonstrated that monomeric PZ interacted with DNA only weakly in the dark state, and suggested that the BL-induced dimerization of the LOV domain and coiled-coil formation of ZIP regions stabilized the complex between PZ and target DNA.
Materials and Methods
Construction of expression vectors
An opZL gene encoding G113–K348 of VfAUREO1, in which C162 and C182 were substituted with serine, and codons were optimized for bacterial and mammalian expression, was synthesized (GenScript) and inserted into an expression vector (pET16), as described previously [23,33]. To prepare variants with the amino acid substitutions S162C/S182C, E159K, K164E, and E159R/K164R, the expression vector containing opZL was mutated with a PrimeSTAR mutagenesis kit (Takara Bio) and primer sets indicated in Supplementary Table S1. Sequences of all constructs were confirmed using the Thermo Sequenase™Dye Primer Manual Cycle Sequencing Kit (GE Healthcare), with an SQ-5500 DNA sequencer (Hitachi Hitech), and expression vectors for each of the PZ variants were then introduced into BL21(DE3) cells (Invitrogen).
Purification of recombinant proteins
Recombinant PZ variants were prepared as described previously [23,33]. In brief, E. coli cells expressing recombinant proteins were harvested by centrifugation and disrupted by sonication. After the cell debris was removed by centrifugation, recombinant proteins were purified twice by binding to and elution from a Ni Sepharose 6 Fast Flow column (GE Healthcare) and a HiTrap Heparin HP column (GE Healthcare), according to the manufacturer’s instructions. The recombinant proteins were stored at 4°C in loading buffer (400 mM NaCl, 20 mM Tris-HCl, pH 7.0) containing 1 mM dithiothreitol (DTT). An aliquot of each purified recombinant protein was denatured by heating at 85°C in sodium dodecylsulfate polyacrylamide-gel electrophoresis (SDS-PAGE) sample buffer for 5 min in the presence of 20 mM DTT, and subsequently analyzed by SDS-PAGE. Concentrations of the recombinant proteins were determined from absorbance at 447 nm using an extinction coefficient of 13,000 M−1cm−1 [23,33].
Electrophoretic-mobility-shift assays
Alexa Fluor 647-labeled AUREO1-specific oligonucleotide containing the target sequence TGACGT (Apo) and Alexa Fluor 647-labeled negative control oligonucleotide without the target sequence (Cpo) were prepared (Supplementary Table S2), and each oligonucleotide was annealed to form the Alexa Fluor 647-labeled Apo and Cpo double-stranded DNA (dsDNA). Various concentrations of recombinant proteins were incubated with 2 nM 647-Apo or 647-Cpo in 30 μL reaction mixtures (140 mM KCl, 5% glycerol, 0.1 mg/mL BSA, 2 mM DTT, 50 mM Tris-HCl, pH 7.0) in the presence or absence of 2.5 mM MgCl2 at 25±1°C for 20 min in the dark. An aliquot (9 μL) of each reaction mixture was loaded onto a 5% polyacrylamide gel containing 1.6×TBE buffer or 0.5×TBE buffer [1×TBE buffer (90 mM Tris, 90 mM boric acid, 2.4 mM EDTA)] in the presence or absence of 2.5 mM MgCl2, and separated in the same running buffer at a constant voltage of 100 V for 60–70 min at 25±1°C. To investigate DNA binding by PZ variants in the light-activated state, each reaction mixture was illuminated for 2 min with an LED light (λmax at 470 nm), then separated by electrophoresis with gel illumination with BL (5 W/m2). To confirm the reversibility of light activation, illuminated reaction mixtures were placed in the dark for 1 h at 25±1°C, then separated by gel electrophoresis in the dark. This sequence of light activation followed by incubation in the dark is referred to as the light–dark state.
The fluorescence signals from Alexa Fluor 647 in the gels were recorded on a Fluor-S MAX image analyzer (Bio-Rad) equipped with a band-pass filter (676 nm×29 nm; Edmund optics) under illumination by laser diodes (DL-3148-234A; λmax at 635 nm; Sanyo). The fluorescence intensity of each DNA band was quantified with ImageJ software, with subtraction of the background intensity in each lane. The fractions of dsDNA bound to PZ variants were determined from the ratio of free dsDNA to total dsDNA, normalized by the amount of free ssDNA, and plotted against the concentrations of monomeric PZ variants. In each case, the half-maximal effective concentration (EC50) was estimated from curve fitting by the Hill equation:
where Bmax is the maximum of the bound dsDNA fraction, [monomer]0 is the total concentration of monomeric protein, and n is the Hill coefficient. In our fitting, the Hill coefficients varied from 0.9 to 2.5.
Fluorescence-correlation spectroscopic measurements
Fluorescence-correlation spectroscopy (FCS) was carried out with an FCS Compact GR system (Wako Pure Chemical Industries) at 25±1°C. PZ or PZ-S2C (at final concentrations of 2.5–800 nM) were included in a total volume of 20 μL FCS buffer (140 mM KCl, 4% glycerol, 3 mM EDTA, 2 mM DTT, 0.04% BSA, 50 mM Tris-HCl, pH 7.0) containing 2 nM Cy3-labeled Apo or Cpo dsDNA, and photons resulting from fluorescence in a confocal region were counted for each 200 ns. Autocorrelation of fluorescence intensities in 10 s intervals were calculated and fit from 10 μs to 1 s, assuming an exponential decay of the correlation. Only data sets in which fluctuations of fluorescence intensities were less than six times their standard deviations were used for further calculations. Diffusion times were estimated from ≥10 cycles of measurements, and the average diffusion times and standard deviations were calculated from more than six estimations. EC50 values were estimated from fitting FCS data by the Hill equation:
where Dobs is the observed diffusion time of Cy3-labeled DNA, Dmin is the diffusion time of free Cy3-labeled DNA, Dmax is the maximum diffusion time, [monomer]0 is the total concentration of monomeric protein, and n is the Hill coefficient. In our fitting, the Hill coefficients varied from 0.9 to 1.8.
Spectroscopic measurements
Recombinant proteins were diluted to 4 μM in loading buffer containing 1 mM DTT. Ultraviolet–visible (UV–visible) absorption spectra were measured using a V550 spectrophotometer (JASCO). Spectral changes accompanying regeneration of the dark state (D450 state) were monitored at intervals during incubation in the dark after initial BL illumination (30 W/m2, λmax at 470 nm for 1 min) at 25°C. Regeneration curves were produced from the measured values of absorbance at 450 nm. Each regeneration curve was fitted to a single exponential formula, ΔAmax(1-e−kt), where ΔAmax was the maximum absorbance difference and k was the rate constant of regeneration. Fluorescence-emission spectra were measured at 25°C with excitation at 450 nm using an F-7000 fluorescence spectrophotometer (Hitachi HiTech).
Size-exclusion chromatography
SEC was performed using an ÄKTA purifier column-chromatography system (GE Healthcare) with a Superdex 75 30/10 column (GE Healthcare) and SEC buffer (300 mM NaCl, 20 mM Tris-HCl, pH 7.0) at 25±1°C, with a flow rate of 0.5 mL/min. To analyze proteins in the dark state, reaction mixtures (containing 4 μM protein) were incubated for 20 min at 25°C in the dark, and 150 μL aliquots were subjected to SEC. To analyze proteins in the light state, reaction mixtures were illuminated for 2 min with BL, and applied to the column under continuous illumination with an LED light (FJ1460; Fuji Corp.). To analyze proteins in the light–dark state, BL-illuminated samples were kept in the dark for 1 h prior to SEC. To investigate the binding of recombinant proteins to the target sequence, solutions containing 4 μM protein and 30 nM Cy3-labeled Apo dsDNA were incubated for 20 min at 25°C in the dark, then analyzed as described above. The state of the samples was checked by measuring the absorption spectra of the eluted samples or by monitoring the absorbance at 390 and 450 nm. For molecular-mass calibration of recombinant PZ variants, standard spherical proteins from a gel-filtration low-molecular-weight calibration kit (GE Healthcare) were used as size markers; these proteins were ribonuclease A (13.7 kDa), carbonic anhydrase (29.0 kDa), ovalbumin (43.0 kDa) and conalbumin (75.0 kDa). A column volume of 23.6 mL and a void volume of 6.7 mL were applied.
Results
Sequence specificity and light dependency of DNA binding by Photozipper
To investigate DNA binding by PZ, we performed electrophoretic-mobility-shift assays (EMSAs) in the presence of 140 mM KCl and Alexa Fluor 647-labeled oligonucleotides, Apo containing the target sequence TGACGT of VfAUREO1 or Cpo without the target sequence (Supplementary Table S2) [23,33]. With 0.5×TBE as the gel solution and running buffer, PZ binding to DNA was sequence specific, but the light dependency of DNA binding was negligible (Supplementary Fig. S1A and B). In order to prevent irreversible DNA binding of PZ during electrophoresis, ionic strength of EMSA buffer was increased. With 1.6×TBE as the buffer, DNA binding by PZ was light dependent (Supplementary Fig. S1C). However, this BL-induced change was irreversible because the electrostatic shielding for DNA may not be enough. In EMSAs, the presence of MgCl2 has previously been shown to be essential for sequence specificity and light dependency of DNA binding by PtAUREO1a [25]. Magnesium has also been shown to prevent nonspecific DNA binding by other bZIP proteins [34,35]. We therefore performed EMSAs with 2.5 mM MgCl2 in the reaction buffer, gels and running buffer (Fig. 1). Two bands at the bottom of the gels resulted from free single-strand DNA (ssDNA) and double-strand DNA (dsDNA). The ssDNA bands were detected irrespective of protein concentration and light conditions. In the dark state, low levels of binding occurred between PZ and the Apo dsDNA, whereas much higher levels of band shifting were observed in the light state (Fig. 1A). These data were consistent with our previous results [23].
Figure 1.

Electrophoretic-mobility-shift assay (EMSA) of Photozipper (PZ) protein in the presence of 2.5 mM MgCl2. (A) EMSA of PZ with 2 nM Alexa Fluor 647-labeled Apo (target sequence) DNA in the dark and light states. (B) The fractions of bound Apo dsDNA plotted against PZ concentrations, with curve fitting of data obtained in the dark state (black solid line), light state (blue solid line) and light–dark state (dashed line). (C) EMSA of PZ with 2 nM Alexa Fluor 647-labeled Cpo (nonspecific) DNA in the dark and light states. (D) The fractions of bound Cpo dsDNA plotted against PZ concentrations, with curve fitting as in panel (B). In each panel, the concentrations of monomeric PZ are 0, 3, 6, 13, 25, 50, 100, 200, 400, 800, 1,600 and 3,200 nM.
To quantify the affinities of PZ variants for DNA, the dsDNA fractions bound to the proteins were estimated from the reduction in fluorescence intensity of free dsDNA compared with the protein-free sample, because protein–DNA complexes might dissociate during electrophoresis, affecting the levels of shifted bands. The fractions were plotted against the monomeric protein concentrations in each reaction, and the EC50 values were estimated by fitting to Hill equations (Table 1). The EC50 value of PZ for binding to Apo dsDNA was 420 nM in the dark state, and decreased to 39 nM with BL illumination (Fig. 1A and 1B). The EC50 value in the light–dark state (~410 nM) was almost the same as that in the dark state, indicating that BL-induced binding of PZ to the target sequence was quantitatively reversible. By contrast, the EC50 values of PZ for Cpo dsDNA in the dark and light states were 1,500 nM and 660 nM, respectively (Fig. 1C and 1D), which were ~3.6-fold and ~17-fold greater than for Apo dsDNA in the dark and light states, respectively. The EC50 of another bZIP transcription factor (GCN4) for its target DNA sequence has been reported to be ~20 nM, which was about eightfold lower than the EC50 for nonspecific DNA, in the presence of 150 mM NaCl [36]. Under our conditions, PZ in the light state selectively bound to the target sequence with similar affinity to other bZIP transcription factors.
Table 1.
Half-maximal effective concentration (EC50) values of Photozipper (PZ) and the PZ variants, estimated from electrophoretic-mobility-shift assays with target sequence (Apo) and nonspecific (Cpo) double-stranded DNA
| Protein | Oligonucleotide | EC50 (nM) | ||
|---|---|---|---|---|
|
| ||||
| Dark | Light | Light-Dark | ||
| PZ | Apo | 420±50 | 39±1 | 410±40 |
| Cpo | 1,500±100 | 660±60 | 1,800±100 | |
|
| ||||
| PZ-S2C | Apo | 7.6±0.3 | 7.5±0.3 | ND |
| Cpo | 73±1 | 66±1 | ND | |
|
| ||||
| E159K | Apo | 490±40 | 61±2 | 410±40 |
|
| ||||
| E159R/K164R | Apo | 1,900±100 | 690±100 | 2,200±100 |
|
| ||||
| K164E | Apo | 1,200±100 | 850±60 | 1,200±100 |
Formation of the complex between dimeric PZ and DNA
To investigate the effect of dimerization on DNA binding, we prepared PZ-S2C (corresponding to ZLwt2 in our previous report [23]) that is constitutively dimeric through intermolecular disulfide bonds. PZ-S2C strongly bound to Apo dsDNA in both the dark and light states (Fig. 2A, Supplementary Fig. S2A and S2B). The shifted band corresponding to the (PZ-S2C)2·Apo complex had the same mobility as the bands with PZ and Apo dsDNA (Fig. 2A), indicating that a (PZ)2·Apo complex was formed in the light state. The EC50 (corresponding to the monomeric concentration) of the (PZ-S2C)2·Apo complex was ~8 nM in the dark state, and its light-dependency was negligible (Fig. 2B). We performed EMSA with PZ-S2C and Apo dsDNA at higher MgCl2 concentrations, but did not detect any light-dependent DNA binding (data not shown). The affinity of PZ-S2C for Cpo dsDNA (EC50 ~70 nM) was lower than that for Apo dsDNA (Supplementary Fig. S2B and Fig. 2C), indicating that binding of dimeric PZ-S2C to dsDNA was sequence specific.
Figure 2.

EMSA of dimeric PZ-S2C in the presence of 2.5 mM MgCl2. (A) EMSA patterns of 50 nM PZ and PZ-S2C with 2 nM Alexa Fluor 647-labeled Apo DNA in the dark and light states. The fractions of bound Alexa Fluor 647-labeled Apo dsDNA (B) and Alexa Fluor 647-labeled Cpo dsDNA (C) plotted against PZ-S2C concentrations, with curve fitting in the dark (black solid line), light (blue solid line) and light–dark (dashed line) states. The concentrations correspond to PZ-S2C monomer (0, 0.5, 1, 2, 4, 8, 16, 32, 64, 128, 256 and 512 nM).
Fluorescence-correlation spectroscopic measurements
EMSA measurement has a difficulty to control the equilibria during electrophoresis. To verify the nature of the protein–DNA equilibria in solution, we performed FCS in the presence of 140 mM KCl, to measure diffusion times of Cy3-labeled dsDNA, which are increased by interactions with proteins. Figure 3 shows the diffusion times of Cy3-labeled Apo and Cpo dsDNA plotted against monomeric PZ concentrations. The diffusion times of free Cy3-labeled dsDNA were measured as ~0.14 ms. PZ weakly interacted with Apo dsDNA in the dark state (EC50 >500 nM), and BL illumination elevated the diffusion time and reduced the EC50 to ~37 nM (Fig. 3A). The EC50 of PZ to Cpo dsDNA in the light state was 560 nM (Fig. 3B). The diffusion times of Apo dsDNA increased with increasing concentrations of PZ, and reached a maximum in the light state of ~0.22 ms, similar to the maximum diffusion time for Apo dsDNA in the presence of PZ-S2C (~0.23 ms), indicating that a (PZ)2·Apo complex was formed in the light state. By contrast, PZ-S2C bound strongly to the target sequence (EC50 ~10 nM) irrespective of the light conditions (Fig. 3C). Binding of PZ-S2C was specific to the target sequence (Fig. 3D). The EC50 values estimated from the FCS data are summarized in Table 2. These values were consistent with the EC50 values obtained from our EMSA data.
Figure 3.

Fluorescence-correlation spectroscopy analyses of Photozipper (PZ) and PZ-S2C. The diffusion times of Alexa Fluor 647-labeled Apo dsDNA (A) and Alexa Fluor 647-labeled Cpo dsDNA (B) plotted against PZ concentrations, with curve fitting in the dark (black solid line) and light (blue solid line) states. The diffusion times of Alexa Fluor 647-labeled Apo dsDNA (C) and Alexa Fluor 647-labeled Cpo dsDNA (D) plotted against PZ-S2C monomer concentrations, with curve fitting as in panels (A) and (B).
Table 2.
Half-maximal effective concentration (EC50) values of Photozipper (PZ) and the constitutive-dimer variant PZ-S2C in the light and dark states, estimated from fluorescence-correlation spectroscopy analyses with target sequence (Apo) and nonspecific (Cpo) double-stranded DNA
| Protein | Oligonucleotide | EC50 (nM) | |
|---|---|---|---|
|
| |||
| Dark | Light | ||
| PZ | Apo | > 500 | 37±11 |
| Cpo | > 1,000 | 560±70 | |
|
| |||
| PZ-S2C | Apo | 9±2 | 12±1 |
| Cpo | 110±10 | 110±10 | |
Amino acid substitutions in the leucine zipper region
The leucine zipper (ZIP) region of PZ has characteristics of a typical heptad repeat motif (abcdefg)n [36]. Supplementary Figure S3 presents an end view of the ZIP regions of a PZ dimer. In a coiled-coil structure of standard ZIP regions, the polar amino acids at the g and e positions frequently form inter-helical salt bridges, which regulate dimerization specificity and stability [37–39]. In the ZIP region of PZ, Glu159 and Lys164 are located at g and e positions, respectively. To assess the role of these residues in DNA binding, PZ variants (E159K, E159R/K164R and K164E) were prepared by site-directed mutation.
Purified PZ variants had the same mobility as PZ on SDS-PAGE (Supplementary Fig. S4A). The absorption spectra of the variants in the visible region (Supplementary Fig. S4B, inset) were almost identical to that of PZ, with λmax at 447±1 nm [23,32]. Figure 4A–C show that the spectral changes of the variants during dark regeneration are very similar. The regeneration time courses of the PZ variants, which had half-life times (τ1/2) of 8.0–8.2 min, were also very similar (Supplementary Fig. S4C). The results suggested that these amino acid substitutions in the ZIP region had little effect on the photochemical properties of the LOV domain.
Figure 4.

Spectral changes during dark regeneration for the Photozipper variants E159K (A), E159R/K164R (B) and K164E (C) at 25°C. The spectra were measured in the initial dark state (solid line), and immediately (dashed line), 2, 4, 8, 16 and 32 min (thin solid lines) and 48 min (thick dotted line) after termination of blue-light illumination.
To verify the oligomeric structures of the recombinant proteins, SEC analyses of 4 μM PZ and its variants were performed. Figure 5 shows the elution profiles in the dark, light and light–dark states. In the dark state (and the light–dark state), all PZ variants eluted at the same peak volume as PZ (9.9 ml, corresponding to 41 kDa). In the light state, the elution peak of each PZ mutant shifted to a higher molecular weight (peak volumes 8.8–8.9 ml, corresponding to 66–68 kDa) similar to that of PZ (8.8 ml, 68 kDa). These data suggested that, in the same way as PZ, the variants all underwent reversible dimerization upon illumination. The elution peaks of the PZ variants were slightly broader than that of PZ, probably reflecting destabilization of dimeric form by mutation. The Kd for the monomer–dimer equilibrium of the LOV domain in the light state has been estimated to be ~600 nM [32], so the intermolecular interaction between LOV domains probably contributes to their dimerization.
Figure 5.
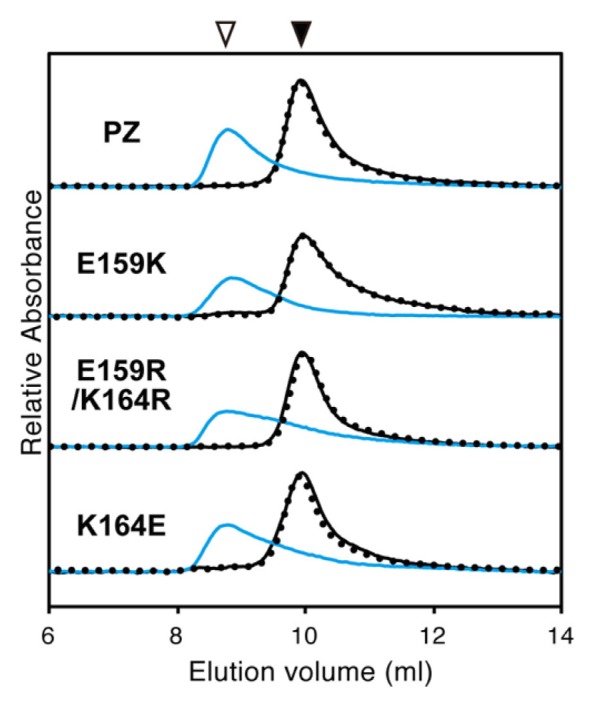
Elution profiles of Photozipper (PZ) and its variants, monitored at 280 nm. Elution profiles of PZ, E159K, E159R/K164R and K164E in the dark state (black lines), the light state (blue lines), and the light–dark state (black dotted lines).
DNA binding by PZ variants
The binding of PZ variants to Cy3-labeled Apo was investigated by SEC in the presence of 300 mM NaCl (Fig. 6A–C). Elution profiles were monitored at 260 nm (for detection of DNA and protein), 390 nm (for detection of the LOV domain), and 550 nm (for detection of Cy3-labeled Apo). In the dark state, E159K eluted with a peak volume at 9.9–10.0 ml (Fig. 6A), which was identical to the peak volumes for the DNA-free proteins in the dark state. The Apo dsDNA eluted separately from E159K, with a peak elution volume at 10.8 ml. In the light state, the peaks corresponding to elution of both E159K and Apo dsDNA shifted to the left, indicating interaction between E159K dimer and the DNA. However, this elution peak of Apo dsDNA was broader than that with PZ dimer in the light state [23]. The complex of E159K dimer and Apo was considered to be more unstable than the (PZ)2·Apo complex, and dissociate during chromatography process. When a mixture of E159K and Apo was kept in the dark for 1 h, the peaks returned to their initial positions, suggesting that the E159K variant weakly interacted with the target sequence in a light-dependent manner. With E159R/K164R and K164E mutants, the elution peaks of Apo were almost identical in both the dark and light conditions (Fig. 6B and 6C), suggesting that their complexes with Apo were unstable in these conditions.
Figure 6.

Size-exclusion chromatography profiles and electrophoretic-mobility-shift assay (EMSA) results of Photozipper (PZ) variants with Cy3-labeled Apo (Cy3-Apo). Elution profiles of (A) E159K, (B) E159R/K164R and (C) K164R PZ variants incubated with Cy3-Apo dsDNA in the presence of 300 mM NaCl, in the dark (D, upper), in the light (L, middle), and in the light–dark (LD, lower) states. Monitoring wavelengths were 260 nm (gray solid lines), 390 nm (green lines), and 550 nm (red lines). Inverted triangles indicate the peak elution volumes of the PZ variants in the dark (closed) and light (open) states, and asterisks designate the peak elution volume of Cy3-Apo dsDNA. EMSA patterns of (D) E159K, (E) E159R/K164R and (F) K164R in the presence of 2.5 mM MgCl2. The fractions of bound double-stranded Alexa Fluor 647-labeled Apo dsDNA plotted against concentrations of each PZ variant, with curve fitting in the dark (black solid line), light (blue solid line) and light–dark (dashed line) states.
To quantify the affinities of the PZ variants for the target sequence, EMSA was performed in the presence of 140 mM KCl and 2.5 mM MgCl2 (Supplementary Fig. S5). The E159K variant exhibited about eightfold decrease in the EC50 value (from 490 nM to 61 nM) upon BL illumination, which was restored in the light–dark state (Fig. 6D). The E159K substitution slightly decreased the affinities for Apo dsDNA and the BL-induced change in the affinity, compared with PZ. The E159R/K164R and K164E variants had low affinities for Apo dsDNA in the dark state, with EC50 values greater than 1 μM (Fig. 6E and 6F). In the light state, the EC50 values of the E159R/K164R and K164E variants were 690 nM and 850 nM, respectively, compared with 39 nM for PZ in the light state. In addition, the BL-induced reductions in EC50 for E159R/K164R and K164E variants were only ~2.8 and ~1.4 times, respectively. Although E159R/K164R and K164E underwent dimerization through their LOV domains, the repulsive interactions possibly destabilized the complexes with DNA, especially in the light state.
These results showed that PZ had higher affinity for the target sequence than E159K, E159R/K164R and K164E variants. Each homodimer of PZ, E159K, E159R/K164R and K164E variants forms inter-helical E–, K–K, R–R, and E–E pair, respectively, at e and g positions. Previous studies of other bZIP proteins reported that the inter-helical E–K pair is more stable, followed by K–K, R–R, (A–A), and E–E pairs in this order [38,39], which were comparable with our SEC and EMSA results. Therefore, Glu159 and Lys164 could form inter-helical salt bridges, which stabilize the coiled-coil of ZIP regions and thus the (PZ)2·Apo complex.
Discussion
In this study, we performed EMSA and FCS analyses in physiological concentrations of salt and quantified the affinity of PZ for DNA. PZ selectively bound to the target sequence in a light-dependent manner, and the reaction was quantitatively reversible. Recently, Banerjee et al. have reported that BL induces a further oligomerization of PtAUREO1a dimer, leading to a shift in the SEC profile (in the absence of DNA) and to a supershifted band in EMSAs [26]. However, further oligomerization of PZ and the PZ-S2C dimer were not detected in our EMSA and FCS experiments, or in our previous SEC analyses, either in the presence or absence of DNA [23].
The bZIP transcription factors form dimeric (2:1) complexes with DNA [1–3], which can proceed by two mechanisms. Either two monomers dimerize and then bind to DNA (a dimer pathway), or two monomers sequentially bind to DNA and dimerize while interacting DNA (a monomer pathway). These pathways form a thermodynamic cycle and the equilibria are represented by four dissociation constants (Kd1, Kd2, Kd3, Kd4) (Fig. 7A). The Kd1 values have already been estimated from the monomer–dimer equilibria of PZ in the absence of DNA in the dark and light states to be ~130 μM and ~120 nM, respectively [32]. We attempted to evaluate through EMSA the Kd2, Kd3 and Kd4 values of PZ with Apo dsDNA in the dark and light states.
Figure 7.

(A) Schematic diagram of the equilibria for Photozipper (PZ) and Apo target double-stranded DNA in the dark and light states. (B) The calculated fraction of bound Apo in the dark (black solid line) and light (blue solid line) states with the electrophoretic-mobility-shift assay (EMSA) data shown in Figure 1(B).
Dimeric PZ-S2C had a high affinity (EC50 ~8 nM) for Apo irrespective of the light conditions. Our previous circular dichroism spectroscopic measurements indicated that BL-induced change in the LOV domains possibly causes conformational change in the bZIP domains and/or the linkers of dimeric PZ-S2C [33], which may have minor effects on binding affinity for the target sequence. The EC50 value corresponded to the dissociation constant of ~4 nM, because the (PZ-S2C)2·Apo complex dissociates into (PZ-S2C)2 and Apo. We, therefore, assumed the Kd2 of PZ to be ~4 nM in both the dark and light states. Dragan et al. have reported that the Kd2 values of crosslinked GCN4-bZIP for the AP-1 and ATF/CREB sites in 100 mM NaCl were 1.5 nM and 6.4 nM, respectively [40], which are comparable to that of dimeric PZ for Apo.
The substitutions in E159R/K164R and K164E caused repulsive interactions between ZIP regions, and strongly inhibited the formation of the (PZ)2·Apo complex even in the light state. The EC50 values of the E159R/K164R and K164E variants in the dark state were ~1.9 μM and ~1.2 μM, respectively, and were only twice as large as those in the light state, even though the LOV domains in these variants underwent dimerization in the light state (Kd ~590 nM). We postulated Kd3 to be ~1.5 μM in both the dark and the light states. The calorimetric titration of the AP-1 site with a basic-region peptide of GCN4 gave a Kd3 of 2 μM in 100 mM NaCl [40], which was close to our Kd3 value. Kd4 follows from the thermodynamic cycle and is expressed by following equation: Kd4 = Kd1Kd2/Kd3. Kd4 values of PZ in the dark and light states were calculated to be ~350 nM and ~0.32 nM, respectively, as shown in Figure 7A.
In order to validate our model, we calculated the Apo dsDNA fraction bound to PZ, in the presence of total concentrations of PZ from 1 nM to 2 μM (Supplementary Text S1). The concentration of Apo dsDNA was 1.4 nM, which was same concentration as in the EMSA measurements of PZ. Figure 7B shows the calculated concentration dependencies of bound Apo fractions in the dark and light states. The EC50 values were estimated to be 570 nM and 31 nM in the dark and light states, respectively, which were comparable with those estimated from EMSA data (~420 nM and ~39 nM, respectively).
Our previous work suggested that monomeric VfAUREO1 should be present in vivo, with dimerization playing a key role in its role as a BL-regulated transcription factor [23]. PZ mimics reduced monomeric form of VfAUREO1. In this study, we quantitatively elucidated the molecular mechanism of a BL-regulated transcription factor. Our model indicated that monomeric VfAUREO1 weakly interacts with DNA in the dark state. In the light state, the Kd1 and Kd4 values are about three orders of magnitude smaller than those in the dark state, although the changes of Kd2 and Kd3 values may be relativity small. The degree of cooperativity can be quantified as Kd3/Kd4 or (Kd3)2/(Kd1Kd2) [41]. VfAUREO1 had the higher cooperativity with its target sequence in the light state, which means that the BL-induced dimerization of LOV domains and the coiled-coil formation of ZIP regions stabilized the dimeric complex with its target DNA sequence.
Conclusion
To understand the complex formation of PZ with DNA, we performed EMSA and FCS analyses in physiological concentrations of salt and quantified the affinity of PZ for DNA. These quantitative analyses showed that PZ selectively binds to the target sequence in a light-dependent manner. The mutational analysis indicated that Glu159 and Lys164 form inter-helical salt bridges between leucine zipper regions, stabilizing the dimer–DNA complex in the light state. In addition, a model of the equilibria between PZ and DNA was proposed. The BL-induced dimerization of LOV domains and the coiled-coil formation of ZIP regions greatly increase DNA binding cooperativity of PZ.
Supplementary Information
Acknowledgments
This work was partly supported by a Grant-in-Aid for Scientific Research (C) to O. H. (No. 26440077). Y. N. was supported by a Japan Society for the Promotion of Science Research Fellowship for Young Scientists (17J00538). The authors thank Mr. Susumu Kato (Hamamatsu Photonics K.K.) for FCS measurements, and Prof. Satoru Nakashima, Dr. Norio Hamada and Dr. Ryosuke Nakamura (Osaka University) for helpful discussions.
Footnotes
Conflict of Interest
The authors declare that they have no conflict of interest.
Author Contributions
Y. N. expressed and purified proteins, performed the EMSA and UV/vis spectral measurements and analyses, prepared the figures, and wrote the manuscript. O. H. performed the FCS measurements, and wrote and revised the manuscript.
References
- 1.Ellenberger TE, Brandl CJ, Struhl K, Harrison SC. The GCN4 basic region leucine zipper binds DNA as a dimer of uninterrupted alpha helices: crystal structure of the protein-DNA complex. Cell. 1992;71:1223–1237. doi: 10.1016/s0092-8674(05)80070-4. [DOI] [PubMed] [Google Scholar]
- 2.Glover JN, Harrison SC. Crystal structure of the heterodimeric bZIP transcription factor c-Fos-c-Jun bound to DNA. Nature. 1995;373:257–261. doi: 10.1038/373257a0. [DOI] [PubMed] [Google Scholar]
- 3.Schumacher MA, Goodman RH, Brennan RG. The structure of a CREB bZIP·somatostatin CRE complex reveals the basis for selective dimerization and divalent cation-enhanced DNA binding. J Biol Chem. 2000;275:35242–35247. doi: 10.1074/jbc.M007293200. [DOI] [PubMed] [Google Scholar]
- 4.Jones S. An overview of the basic helix-loop-helix proteins. Genome Biol. 2004;5:226. doi: 10.1186/gb-2004-5-6-226. [DOI] [PMC free article] [PubMed] [Google Scholar]
- 5.Wolberger C. Homeodomain interactions. Curr Opin Struct Biol. 1996;6:62–68. doi: 10.1016/s0959-440x(96)80096-0. [DOI] [PubMed] [Google Scholar]
- 6.Huang N, Chelliah Y, Shan Y, Taylor CA, Yoo SH, Partch C, et al. Crystal structure of the heterodimeric CLOCK:BMAL1 transcriptional activator complex. Science. 2012;337:189–194. doi: 10.1126/science.1222804. [DOI] [PMC free article] [PubMed] [Google Scholar]
- 7.Zoltowski BD, Motta-Mena LB, Gardner KH. Blue light-induced dimerization of a bacterial LOV-HTH DNA-binding protein. Biochemistry. 2013;52:6653–6661. doi: 10.1021/bi401040m. [DOI] [PMC free article] [PubMed] [Google Scholar]
- 8.Winkler A, Heintz U, Lindner R, Reinstein J, Shoeman RL, Schlichting I. A ternary AppA-PpsR-DNA complex mediates light regulation of photosynthesis-related gene expression. Nat Struct Mol Biol. 2013;20:859–867. doi: 10.1038/nsmb.2597. [DOI] [PMC free article] [PubMed] [Google Scholar]
- 9.Wu D, Potluri N, Lu J, Kim Y, Rastinejad F. Structural integration in hypoxia-inducible factors. Nature. 2015;524:303–308. doi: 10.1038/nature14883. [DOI] [PubMed] [Google Scholar]
- 10.Christie JM. Phototropin blue-light receptors. Annu Rev Plant Biol. 2007;58:21–45. doi: 10.1146/annurev.arplant.58.032806.103951. [DOI] [PubMed] [Google Scholar]
- 11.Swartz TE, Corchnoy SB, Christie JM, Lewis JW, Szundi I, Briggs WR, et al. The photocycle of a flavin-binding domain of the blue light photoreceptor phototropin. J Biol Chem. 2001;276:36493–36500. doi: 10.1074/jbc.M103114200. [DOI] [PubMed] [Google Scholar]
- 12.Iwata T, Tokutomi S, Kandori H. Photoreaction of the cysteine S-H group in the LOV2 domain of Adiantum phytochrome 3. J Am Chem Soc. 2002;124:11840–11841. doi: 10.1021/ja020834c. [DOI] [PubMed] [Google Scholar]
- 13.Herrou J, Crosson S. Function, structure and mechanism of bacterial photosensory LOV proteins. Nat Rev Microbiol. 2011;9:713–723. doi: 10.1038/nrmicro2622. [DOI] [PMC free article] [PubMed] [Google Scholar]
- 14.Wu YI, Frey D, Lungu OI, Jaehrig A, Schlichting I, Kuhlman B, et al. A genetically encoded photoactivatable Rac controls the motility of living cells. Nature. 2009;461:104–108. doi: 10.1038/nature08241. [DOI] [PMC free article] [PubMed] [Google Scholar]
- 15.Wang X, Chen X, Yang Y. Spatiotemporal control of gene expression by a light-switchable transgene system. Nat Methods. 2012;9:266–269. doi: 10.1038/nmeth.1892. [DOI] [PubMed] [Google Scholar]
- 16.Motta-Mena LB, Reade A, Mallory MJ, Glantz S, Weiner OD, Lynch KW, et al. An optogenetic gene expression system with rapid activation and deactivation kinetics. Nat Chem Biol. 2014;10:196–202. doi: 10.1038/nchembio.1430. [DOI] [PMC free article] [PubMed] [Google Scholar]
- 17.Grusch M, Schelch K, Riedler R, Reichhart E, Differ C, Berger W, et al. Spatio-temporally precise activation of engineered receptor tyrosine kinases by light. EMBO J. 2014;33:1713–1726. doi: 10.15252/embj.201387695. [DOI] [PMC free article] [PubMed] [Google Scholar]
- 18.Takahashi F, Yamagata D, Ishikawa M, Fukamatsu Y, Ogura Y, Kasahara M, et al. AUREOCHROME, a photoreceptor required for photomorphogenesis in stramenopiles. Proc Natl Acad Sci USA. 2007;104:19625–19630. doi: 10.1073/pnas.0707692104. [DOI] [PMC free article] [PubMed] [Google Scholar]
- 19.Ishikawa M, Takahashi F, Nozaki H, Nagasato C, Motomura T, Kataoka H. Distribution and phylogeny of the blue light receptors aureochromes in eukaryotes. Planta. 2009;230:543–552. doi: 10.1007/s00425-009-0967-6. [DOI] [PubMed] [Google Scholar]
- 20.Schellenberger Costa B, Sachse M, Jungandreas A, Bartulos CR, Gruber A, Jakob T, et al. Correction: Aureochrome 1a Is Involved in the Photoacclimation of the Diatom Phaeodactylum tricornutum. PLoS ONE. 2013;8:e74451. doi: 10.1371/journal.pone.0074451. [DOI] [PMC free article] [PubMed] [Google Scholar]
- 21.Deng Y, Yao J, Fu G, Guo H, Duan D. Isolation, expression, and characterization of blue light receptor AUREOCHROME gene from Saccharina japonica (Laminariales, Phaeophyceae) Mar Biotechnol. 2014;16:135–143. doi: 10.1007/s10126-013-9539-7. [DOI] [PubMed] [Google Scholar]
- 22.Takahashi F. Blue-light-regulated transcription factor, Aureochrome, in photosynthetic stramenopiles. J Plant Res. 2016;129:189–197. doi: 10.1007/s10265-016-0784-5. [DOI] [PubMed] [Google Scholar]
- 23.Hisatomi O, Nakatani Y, Takeuchi K, Takahashi F, Kataoka H. Blue light-induced dimerization of monomeric aureochrome-1 enhances its affinity for the target sequence. J Biol Chem. 2014;289:17379–17391. doi: 10.1074/jbc.M114.554618. [DOI] [PMC free article] [PubMed] [Google Scholar]
- 24.Akiyama Y, Nakasone Y, Nakatani Y, Hisatomi O, Terazima M. Time-resolved Detection of Light-induced Dimerization of Monomeric Aureochrome-1 and Change in Affinity for DNA. J Phys Chem B. 2016;120:7360–7370. doi: 10.1021/acs.jpcb.6b05760. [DOI] [PubMed] [Google Scholar]
- 25.Heintz U, Schlichting I.Blue light-induced LOV domain dimerization enhances the affinity of Aureochrome 1a for its target DNA sequence Elife 5e118602016 [DOI] [PMC free article] [PubMed] [Google Scholar]
- 26.Banerjee A, Herman E, Serif M, Maestre-Reyna M, Hepp S, Pokorny R, et al. Allosteric communication between DNA-binding and light-responsive domains of diatom class I aureochromes. Nucleic Acids Res. 2016;44:5957–5970. doi: 10.1093/nar/gkw420. [DOI] [PMC free article] [PubMed] [Google Scholar]
- 27.Toyooka T, Hisatomi O, Takahashi F, Kataoka H, Terazima M. Photoreactions of Aureochrome-1. Biophys J. 2011;100:2801–2809. doi: 10.1016/j.bpj.2011.02.043. [DOI] [PMC free article] [PubMed] [Google Scholar]
- 28.Herman E, Sachse M, Kroth PG, Kottke T. Blue-light-induced unfolding of the Jα helix allows for the dimerization of aureochrome-LOV from the diatom Phaeodactylum tricornutum. Biochemistry. 2013;52:3094–3101. doi: 10.1021/bi400197u. [DOI] [PubMed] [Google Scholar]
- 29.Mitra D, Yang X, Moffat K. Crystal structures of Aureochrome1 LOV suggest new design strategies for optogenetics. Structure. 2012;20:698–706. doi: 10.1016/j.str.2012.02.016. [DOI] [PMC free article] [PubMed] [Google Scholar]
- 30.Banerjee A, Herman E, Kottke T, Essen LO. Structure of a Native-like Aureochrome 1a LOV Domain Dimer from Phaeodactylum tricornutum. Structure. 2016;24:171–178. doi: 10.1016/j.str.2015.10.022. [DOI] [PubMed] [Google Scholar]
- 31.Herman E, Kottke T. Allosterically Regulated Unfolding of the A′α Helix Exposes the Dimerization Site of the Blue-Light-Sensing Aureochrome-LOV Domain. Biochemistry. 2015;54:1484–1492. doi: 10.1021/bi501509z. [DOI] [PubMed] [Google Scholar]
- 32.Nakatani Y, Hisatomi O. Molecular Mechanism of Photozipper, a Light-Regulated Dimerizing Module Consisting of the bZIP and LOV Domains of Aureochrome-1. Biochemistry. 2015;54:3302–3313. doi: 10.1021/acs.biochem.5b00320. [DOI] [PubMed] [Google Scholar]
- 33.Hisatomi O, Takeuchi K, Zikihara K, Ookubo Y, Nakatani Y, Takahashi F, et al. Blue light-induced conformational changes in a light-regulated transcription factor, aureochrome-1. Plant Cell Physiol. 2013;54:93–106. doi: 10.1093/pcp/pcs160. [DOI] [PubMed] [Google Scholar]
- 34.Moll JR, Acharya A, Gal J, Mir AA, Vinson C. Magnesium is required for specific DNA binding of the CREB B-ZIP domain. Nucleic Acids Res. 2002;30:1240–1246. doi: 10.1093/nar/30.5.1240. [DOI] [PMC free article] [PubMed] [Google Scholar]
- 35.Flammer JR, Popova KN, Pflum MK. Cyclic AMP response element-binding protein (CREB) and CAAT/enhancer-binding protein beta (C/EBPbeta) bind chimeric DNA sites with high affinity. Biochemistry. 2006;45:9615–9623. doi: 10.1021/bi052521a. [DOI] [PubMed] [Google Scholar]
- 36.Hollenbeck JJ, Oakley MG. GCN4 binds with high affinity to DNA sequences containing a single consensus half-site. Biochemistry. 2000;39:6380–6389. doi: 10.1021/bi992705n. [DOI] [PubMed] [Google Scholar]
- 37.Vinson C, Acharya A, Taparowsky EJ. Deciphering B-ZIP transcription factor interactions in vitro and in vivo. Biochim Biophys Acta. 2006;1759:4–12. doi: 10.1016/j.bbaexp.2005.12.005. [DOI] [PubMed] [Google Scholar]
- 38.Zhou NE, Kay CM, Hodges RS. The role of interhelical ionic interactions in controlling protein folding and stability. De novo designed synthetic two-stranded alpha-helical coiled-coils. J Mol Biol. 1994;237:500–512. doi: 10.1006/jmbi.1994.1250. [DOI] [PubMed] [Google Scholar]
- 39.Krylov D, Mikhailenko I, Vison C. A thermodynamic scale for leucine zipper stability and dimerization specificity: e and g interhelical interactions. EMBO J. 1994;13:2849–2861. doi: 10.1002/j.1460-2075.1994.tb06579.x. [DOI] [PMC free article] [PubMed] [Google Scholar]
- 40.Dragan AI, Frank L, Liu YY, Makeyeva EN, Crane-Robinson C, Privalov PL. Thermodynamic signature of GCN4-bZIP binding to DNA indicates the role of water in discriminating between the AP-1 and ATF/CREB sites. J Mol Biol. 2004;343:865–878. doi: 10.1016/j.jmb.2004.08.101. [DOI] [PubMed] [Google Scholar]
- 41.Cranz S, Berger C, Baici A, Jelesarov I, Bosshard HR. Monomeric and dimeric bZIP transcription factor GCN4 bind at the same rate to their target DNA site. Biochemistry. 2004;43:718–727. doi: 10.1021/bi0355793. [DOI] [PubMed] [Google Scholar]
Associated Data
This section collects any data citations, data availability statements, or supplementary materials included in this article.