

Abstract
Multiple-site concerted proton electron transfer (MS-CPET) reactions were studied in a three-component system. 1-hydroxy-2,2,6,6-tetramethylpiperidine (TEMPOH) was oxidized to the stable radical TEMPO by electron transfer to ferrocenium oxidants coupled to proton transfer to various pyridine bases. These MS-CPET reactions contrast with the usual reactivity of TEMPOH by hydrogen atom transfer to a single e−/H+ acceptor. The three-component reactions proceed by pre-equilibrium formation of a hydrogen-bonded adduct between TEMPOH and the pyridine base, which is then oxidized by the ferrocenium in a bimolecular MS-CPET step. The second order rate constants, measured using stopped-flow kinetic techniques, spanned four orders of magnitude. An advantage of this system is that the MS-CPET driving force could be independently varied by changing either the pKa of the base or the reduction potential (E°) of the oxidant. Changes in ΔG°MS-CPET from either source had the same effect on the MS-CPET rate constants, and a combined Brønsted plot of ln(kMS-CPET) vs. ln(Keq) was linear with a slope of 0.46. These results imply a synchronous concerted mechanism, in which the proton and electron transfer components of the CPET process make equal contributions to the rate constants. The only outlier to the Brønsted correlation are the reactions with sterically hindered pyridines, which apparently hinder the close approach of proton donor and acceptor that facilitates MS-CPET. These three-component reactions are compared with a related hydrogen atom transfer reaction of TEMPOH, with the 2,4,6-tri-tert-butylphenoxyl radical. The MS-CPET and HAT oxidations of TEMPOH at the same driving force occurred with similar rate constants. While this is an imperfect comparison, the data suggest that the separation of the proton and electron to different reagents does not significantly inhibit the PCET process.
Graphical abstract

Introduction
Proton-coupled electron transfer (PCET) reactions are key to a wide range of processes from chemical energy conversions to biochemistry.1-4 The simplest and most common examples involve the transfer of one electron and one proton. These reactions can proceed by stepwise proton transfer (PT) and electron transfer (ET) steps, or in the same kinetic step by concerted proton electron transfer (CPET or EPT). One large class of CPET reactions are hydrogen atom transfers, in which the e− and H+ move ‘together’.5 At the other extreme, the proton and electron can move to or come from separated locations or completely different reagents, termed multiple site-CPET (MS-CPET, or sometimes bidirectional PCET or orthogonal EPT).6-8 MS-CPET reactions are key to many biological processes where nature uses protons to balance charges during oxidation and reduction reactions.1,9 Recently a number of catalytic processes utilizing MS-CPET have been developed for organic synthetic applications.10-14
Small model systems have been key to developing understanding of MS-CPET reactions. Many laboratories, including ours, have studied two-component systems in which intermolecular electron transfer is coupled to an intramolecular proton transfer across a hydrogen bond to a covalently tethered base.15-23 The covalent tether promotes formation of the hydrogen bond and can probe the effects of different hydrogen bond distances.18,19,23
Three-component MS-CPET systems allow independent modulation of the proton and electron components. Pioneering work by Linschitz et al. showed that phenols could be oxidized by electron transfer to photo-excited triplet C60 coupled to proton transfer to various pyridine bases.24,25 The mechanism was shown to involve electron removal from a phenol…pyridine hydrogen-bonded pair, and the rate constants were dependent on the pKa of the base. Fecenko, Thorp and Meyer studied electrocatalytic MS-CPET oxidations of tyrosine in basic buffers with metal tris-diimine complexes, and reported the free energy dependence of these reactions upon varying both the oxidant and the base.26,27 More recently, Wenger and co-workers have observed similar rates for bimolecular and termolecular photochemical MS-CPET reactions in the presence of added pyridine using para-substituted phenols as donors.8 Bourrez, Hammarström, et al. have reported MS-CPET from a tungsten hydride complex with a series of bases and oxidants.28
The study reported here examines how three-component MS-CPET rate constants respond to systematic and independent variations of the oxidant, the base, the hydrogen bond, and the overall driving force (ΔG°CPET) of the process (Scheme 1). TEMPOH (1-hydroxy-2,2,6,6-tetramethylpiperidine) was selected as the hydrogen atom donor because its properties favor the concerted release of e− and H+ over the competing stepwise PT-ET or ET-PT mechanisms.6 Various commercially available pyridine bases were used as proton acceptors because the basicity (and driving force for proton transfer) and sterics around the nitrogen can be systematically modulated. Substitution on the para position changes the pKa of the base without affecting the hydrogen bond geometry, whereas substitution at the ortho position probes the sensitivity of MS-CPET reaction to the hydrogen bond structure. The effect of electron transfer driving force was probed with different ferrocenium oxidants. These systematic changes show that the MS-CPET process involves equal contributions from the proton and electron transfer components, implying a synchronous transfer of the two particles. This study also provides additional evidence against the intuition that MS-CPET reactions are less facile than related hydrogen atom transfer processes, following Wenger’s related study with excited state ruthenium oxidants.8
Scheme 1.

MS-PCET from TEMPOH to pyridine bases and ferrocenium oxidants
Results
The results reported here are all consistent with pre-equilibrium formation of a hydrogen-bonded adduct followed by a bimolecular reaction with the oxidant (Scheme 2), consistent with prior studies.8,24,25 The following sections present studies of the hydrogen-bond equilibria, then kinetic measurements and thermochemical analyses.
Scheme 2.

Equilibrium formation of hydrogen-bonded adduct (top), followed by oxidation with an outer sphere oxidant (bottom), and the rate law for this mechanism.a
aEquation (1) applies when [py] ≫ [TEMPOH].
I. Hydrogen bond equilibria
The rates of hydrogen-bond formation and dissociation between TEMPOH and the pyridine base are fast relative to the MS-CPET reaction so this is a rapid pre-equilibrium process. To determine the second order MS-CPET rate constant (k2) in Scheme 2, the hydrogen bond KHB values are needed. Initial experiments to measure KHB in acetonitrile (MeCN) solvent showed very little hydrogen bond formation, likely because MeCN competes with pyridine. Therefore, our studies were done predominantly with CH2Cl2 as the solvent.
The hydrogen-bond equilibrium constant (KHB) for formation of the TEMPOH…R-py hydrogen bond was determined using IR spectroscopy. Solutions of TEMPOH in CH2Cl2 show a characteristic sharp O-H stretch at 3582 cm−1 (Figure 1a). Addition of pyridine to such solutions causes a decrease in this absorption and the appearance of a broad absorption centered at 3240 cm−1, corresponding to the O-H stretch of the TEMPOH…py adduct. These absorbances were converted to concentrations using a mass-balance equation, and KHB was derived as the slope of the plot of [adduct]/[free TEMPOH] vs. [R-py] (Figure 1b; Supplementary Information [SI] Section 3). The adduct formation equilibrium constants for TEMPOH with all pyridine bases studied are given in Table 1. Hydrogen-bond formation was also examined by 1H NMR spectroscopy and appeared similar, but quantitative analysis was not possible due to significant variations in chemical shifts at the high pyridine concentrations required (SI Section 4).
Figure 1.

(a) IR spectra of TEMPOH in CH2Cl2 with increasing concentrations of py, showing decreasing absorbance at 3582 cm−1 due to free TEMPOH and increasing intensity in the broad band at 3237 cm−1 due to the TEMPOH…py hydrogen bonded adduct. The sharp feature at 3150 cm−1 is from the pyridine aromatic C-H stretches. (b) Plot of [Adduct]/[TEMPOH] vs. [R-py] for various substituted pyridines. Linear fits to the data are shown; the slope corresponds to the hydrogen bond equilibrium constant (KHB). 2,6-Lutidine = 2,6-dimethylpyridine; DMAP = 4-dimethylaminopyridine.
Table 1.
Rate constants, equilibrium constants and free energies for TEMPOH(D) oxidations with ferrocenium oxidants and pyridine bases.a
| Entry | Oxidant | Base | Solvent |
k3(H)b (×103 M−2s−1) |
k3(D)b (×103 M−2s−1) |
k3(H)/k3(D)b |
KHB
c (M−1) |
k2
d (×103 M−1s−1) |
ΔG° (kcal mol−1) |
|---|---|---|---|---|---|---|---|---|---|
| 1 | [Cp2Fe]BF4 | py | CH2Cl2 | 7.2 | 1.6 | 4.5 | 1.08 | 7.4 | −6.1 |
| 2 | [Cp2Fe]BF4 | 4-Me-py | CH2Cl2 | 19 | 4.3 | 4.4 | 1.76 | 12 | −7.1 |
| 3 | [Cp2Fe]BF4 | 4-MeO-py | CH2Cl2 | 26 | 7.2 | 3.6 | 1.04 | 29 | −8.1 |
| 4 | [Cp2Fe]BF4 | 2-Me-py | CH2Cl2 | 7.1 | 3.5 | 2.0 | 1.12 | 7.5 | −6.8 |
| 5 | [Cp2Fe]BF4 | 2,6-lutidine | CH2Cl2 | 3.9 | 1.8 | 2.2 | 0.49 | 8.3 | −8.2 |
| 6 | [Cp2Fe]BF4 | 4-Me2N-py | CH2Cl2 | 570 | 130 | 4.4 | 2.66 | 280 | −11.6 |
| 7 | [(MeCp)2Fe]PF6 | py | CH2Cl2 | 13 | 1.08 | 1.3 | −3.7 | ||
| 8 | [Cp(Cp*)Fe]PF6 | py | CH2Cl2 | 0.035 | 1.08 | 0.036 | −0.1 | ||
| 9 | [Cp(Cp*)Fe]PF6 | 4-Me-py | CH2Cl2 | 0.11 | 1.76 | 0.077 | −1.0 | ||
| 10 | [Cp(Cp*)Fe]PF6 | 4-MeO-py | CH2Cl2 | 0.23 | 1.04 | 0.26 | −2.0 | ||
| 11 | [Cp(Cp*)Fe]PF6 | 4-Me2N-py | CH2Cl2 | 16 | 2.66 | 7.4 | −5.5 | ||
| 12 | [Cp2Fe]BF4 | py | CH3CN | 0.093 | −5.6 | ||||
| 13 | [Cp2Fe]BF4 | 4-Me-py | CH3CN | 0.276 | −7.0 | ||||
| 14 | [Cp2Fe]BF4 | 4-MeO-py | CH3CN | 0.693 | −7.9 |
Values measured at 298 K in CH2Cl2 or CH3CN as noted.
Estimated uncertainties on k3 = 10%.
KHB from IR; uncertainties are estimated as ±15% based on reproducibility (see text).
Estimated uncertainty ±18% based on uncertainties in k3 and KHB.
| (1) |
II. Kinetic measurements
Termolecular rate constants for MS-CPET were measured for reactions of TEMPOH with ferrocenium oxidants (Fc+) and pyridine bases in either CH2Cl2 or MeCN. The kinetics were monitored primarily in CH2Cl2 because of the more favorable TEMPOH…R-py hydrogen bond in this solvent. These were typically performed under conditions of excess TEMPOH and excess base (R-py), using a stopped-flow kinetics apparatus. Figure 2a is a representative data set showing the loss of the ferrocenium absorbance (λmax = 618 nm) concurrent with the appearance of the characteristic ferrocene absorbance (λmax = 437 nm). Pseudo-first order rate constants were extracted using a global fit over all measured wavelengths; the absorbances for a single-wavelength and a single-exponential fit are shown in Figure 1b. The exponential fit over more than three half-lives shows the first-order dependence on the oxidant.
Figure 2.

(a) Optical absorption spectra showing the loss of the Cp2Fe+ absorbance (over 1 second) at 618 nm. (b) Single wavelength trace at 618 nm and fit to single exponential.
Most experiments were done under conditions where only a small amount of the hydrogen bonded adduct was formed, where KHB[R-py] ≤ 0.1. Under these conditions the measured kobs varied linearly with the concentration of TEMPOH and pyridine, demonstrating the termolecular rate law: −d[Fc+]/dt = k3[TEMPOH][R-py][Fc+]. Hydrogen-bond equilibrium constants (from IR studies) combined with the measured rate constants kobs using equation 1 give the bimolecular MS-CPET rate constants k2 (Table 1).
The mechanism in Scheme 2 predicts that the kobs should show saturation behavior at high enough pyridine concentration (eq 1). Experiments at very high [R-py], > 1 M showed such predicted saturation kinetics. However, fitting a curved kobs vs. [py] plot such as SI Fig. S6 gave apparent KHB values that were typically significantly higher than those from the IR and NMR measurements. We attribute this discrepancy to the rate and equilibrium constants changing at high R-py concentrations (1 M py in CH2Cl2 is 6.5 mol% and 8.1 volume% pyridine).
Values of k3 were determined for Cp2Fe+ with six different pyridine bases, 2-methyl-pyridine, 4-methyl-pyridine, 2,6-dimethyl-pyridine, 4-dimethylamino-pyridine, and 4-methoxy-pyridine. In addition, reactions were studied with [(MeCp)2Fe]PF6, [Cp(Cp*)Fe]PF6, and [Cp2Fe]BF4 [MeCp = η5-C5H4Me, Cp = η5-C5H5, Cp* = η5-C5Me5]. The results are given in Table 1, along with the hydrogen bond equilibrium constants. Kinetic isotope effects were measured using an excess of TEMPO-D. The values of k3H/k3D varied from 2.0 to 4.5, for 2-methylpyridine and pyridine, respectively.
III. Thermochemical Measurements
One of the MS-CPET reactions was also studied in the reverse direction, the reduction of TEMPO with Cp(Cp*)Fe and excess 4-methyl-pyridinium hexafluorophosphate ([4-Me-py]PF6) eq 2): k-3 = 22 M−2s−1.29 The ratio of k4 and k–4 is the equilibrium constant K4, a direct measurement of the thermodynamics of the reaction: ΔG° = –1.0 kcal mol−1. This provides an anchor point for the measurements of relative thermochemistry in the next paragraphs.
 |
(2) |
Reduction potentials in CH2Cl2 for the ferrocenes used here were determined by cyclic voltammetry, yielding relative E1/2 values (ΔE1/2, SI p. S2). The relative pKa values for the pyridine/pyridinum compounds were determined by equilibration under conditions similar to the MS-CPET reactions, since a pKa scale is not well established in CH2Cl2 solvent.30 The position of the equilibrium in eq 3 was easily monitored by 1H NMR spectroscopy. Pyridine bases and their conjugate acids are in rapid equilibrium on the NMR timescale, so the averaged chemical shift of the 1H NMR resonances in CD2Cl2 indicates the extent of protonation of each base. The relative pKa values in CH2Cl2 were confirmed with overlapping measurements (SI Section 5). Together, the reduction potentials and relative pKa values directly translate to differences in free energies of reaction with eq 4.31
| (3) |
| (4) |
In CPET processes, the driving force is typically most easily described as the difference in the two bond dissociation free energies (BDFEs). This is evident for a hydrogen atom transfer process X–H + Y → X + Y–H, for which ΔG°HAT = BDFE(Y–H) – BDFE(X–H). As we have discussed elsewhere,31 this approach is also valuable for MS-CPET reactions, even though the e− and H+ do not transfer to make a single Y–H bond. In the reactions presented here, the product combination Cp2Fe + R-pyH+ can be considered to have an “effective BDFE” (BDFEeff) which is its thermodynamic ability to form H• (eq 5). By analogy with a single reagent X–H, the BDFEeff can be determined from the redox potential of the oxidant, the pKa of the base used, and a constant (CG) which is specific for the solvent being used (eq 6). Then the free energy of the reactions is the difference between the TEMPOH BDFE and the BDFEeff of the oxidation/base pair (eq 7).
| (5) |
| (6) |
| (7) |
In the current study, the BDFEeff values were obtained via equilibration rather than via eq 6, because CG is not available in CH2Cl2 (due to the lack of an absolute pKa scale). The use of relative pKas for structurally similar acids and the same PF6− counterion should minimize differential contributions from the tight ion pairing in CH2Cl2. The conclusion is that in CH2Cl2, the BDFEeff for Cp(Cp*)Fe + [4-Me-pyH]PF6 is 66 kcal mol−1, 1.0 kcal mol−1 larger than the BDFE of TEMPOH (estimated from values in C6H6 and MeCN6,32). The BDFEeff for all of the combinations in Table 1 are given by 65 kcal mol−1 (the BDFE of TEMPO–H)6 minus the ΔG°reaction given in the last column of the Table.
Discussion
I. Mechanism
The results obtained are all consistent with the mechanism in Scheme 2 of rapid pre-equilibrium formation of a TEMPOH…R-py hydrogen bonded adduct which then undergoes rate limiting MS-CPET. This is indicated by the termolecular kinetics under typical conditions and by saturation behavior at very high [R-py] (≥ 1 M). The observation of primary H/D kinetic isotope effects indicates the involvement of proton transfer in the rate determining step.
The hydrogen-bonding pre-association of TEMPOH and R-py is quite weak, with equilibrium constants, KHB, of only 0.5 to 2.66 M–1. In general, the hydrogen bonds are slightly stronger for the more basic pyridines, but the KHB vary less than a factor of 6 for the set of pyridines whose basicity varies by 107 in CH2Cl2 (See SI). 2,6-Lutidine is an exception to the trend, being more basic than py but having a roughly two-fold smaller KHB, presumably because of its steric bulk inhibiting hydrogen bond formation.
Within the hydrogen-bonded adduct, the PCET processes can occur by stepwise paths (PT-ET or ET-PT) or by concerted transfer of the e− and H+. TEMPOH has a strong bias for the concerted path because it is a very poor acid (pKa = 41 in MeCN) and a very poor reductant [E(TEMPOH•+/0) = +0.71 V vs. Cp2Fe in MeCN].6 Using these values and the pyridine pKa values in MeCN,33 initial PT and ET from TEMPOH to the oxidants or bases are very endoergic. This is illustrated in the top and left sides of Scheme 3 for the most basic pyridine and most oxidizing ferrocenium used (4-Me2Npy and Cp2Fe+). Initial ET and PT mechanism are ruled out by the ground state ΔG°ET and ΔG°PT being much larger than the ΔG‡ calculated from the bimolecular k2 values via the Eyring equation, by ≥16 kcal mol−1. While these calculations are for MeCN solutions, for which the thermochemical values are available, the argument for the concerted mechanism is even stronger in the less polar CH2Cl2, where the ionic intermediates of Scheme 3 are even less favorable. The thermochemical analysis thus shows that the k2 step in the reactions presented here must involve the transfer of the e− to the oxidant and the H+ to the pyridine in a single kinetic step, MS-CPET.
Scheme 3.
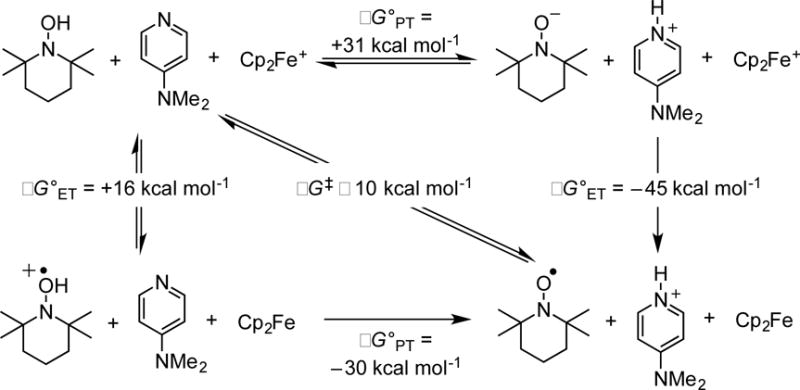
Square scheme showing free energies of proton transfers (horizontal axis) and electron transfers (vertical axis) for the termolecular MS-CPET TEMPOH oxidation with Cp2Fe+ and 4-Me2Npy in MeCN.6,33 The diagonal gives the ΔG‡ from the measured k2 and the Eyring equation.
This analysis should, strictly speaking, use the ΔG°′ values for reactions between the hydrogen-bonded precursor and successor complexes. In this case, however, we were unable to measure the KHB,succ for the successor complexes.29 Still, with the measured values of KHB being close to 1, and KHB,succ likely being close to 1,34 make ΔG°′ very close to the ΔG° for the separated reagents, and we use those values here and below.
II. MS-CPET rate constants: dependence on driving force
The rate constants for the MS-CPET step (k2) are sensitive to both the base and the oxidant. Electron donating groups on the para position of the pyridine resulted in larger rate constants, with 4-dimethylaminopyridine reaction occurring almost 40 times faster than the pyridine one. The oxidation of TEMPOH…py is 200 times faster with [Cp2Fe]+ than with [Cp(Cp*)Fe]+.
The MS-CPET rate constants correlate very closely with the free energy of the reactions, the ΔG° values determined in Results Section III above. A Brønsted plot of ln(k2) vs. ln(KMS-CPET), equivalent to δΔG‡/δΔG°, is shown in Figure 3. All the data points except the one for 2,6-lutidine (point 5, see below) fit well on a straight line, with a slope of 0.46(2) (called the Brønsted α).
Figure 3.

Plot of ln (k2) vs ln (Keq) for TEMPOH oxidations by the combination of a pyridine base with [Cp2Fe]BF4 (blue squares,
 ), [(MeCp)2Fe]PF6 (red circle,
 ), and [Cp(Cp*)Fe]PF6 (green triangles,
 ) in CH2Cl2, with the numbers corresponding to the entries in Table 1. The purple diamond (
 ) represents the oxidation with [Cp2Fe]BF4 and 2,6-lutidine. The orange inverted triangle (
 ) marks the HAT reaction between TEMPOH and tBu3PhO· (in CCl4).
The linear fit in Figure 3 shows that the k2 values respond equally to changes in ΔG°MS-CPET regardless of whether the driving force is changed with the E° of the oxidant or pKa of the pyridine base. The slope of 0.46 means that changes in either the proton or electron components that make a reaction more favorable by1 kcal mol−1 lower the Eyring barrier by 0.46 kcal mol−1. Looking at subsets of the data, the slope for the low driving force half of the plot, ln(Keq) < 11, is a bit higher, 0.55. Essentially this same slope is seen for reactions using [Cp(Cp*)Fe]+ and four different bases, 0.59(2), and reactions using pyridine and three different oxidants, 0.53(4) (the single values in parentheses are the standard errors of the linear fits). These very similar slopes in this region further show that the rate constants are insensitive to varying the ΔG°MS-CPET through the proton component (the nature of the base) versus variation in the electron component (varying the oxidant). In the higher driving force region, 11 > ln(Keq), there is a shallower slope of 0.41(3) for the reactions using [Cp2Fe]+ and five different bases (excluding lutidine).
A few prior studies of three-component MS-PCET reactions have shown a linear dependence of ln(kMS-CPET) on ln(Keq) [ΔG°MS-CPET]. Linschitz’s pioneering study varied the base with the same oxidant, photoexcited C60.24,25 Thorp and Meyer showed that ln(k) varied with ΔG°MS-CPET, both upon varying the base with a single oxidant and upon varying the oxidant with a single base.27 While both individual correlations presented had a Brønsted slope of 0.6, the combined plot with all the data was non-linear, perhaps due to a quantum beat or perhaps a result of the diversity of acids and bases used. For the oxidations of phenols by an excited ruthenium oxidant and pyridine bases, Nomrowski and Wenger reported a slope of 0.52 ± 0.05.8 For MS-CPET oxidation of a tungsten hydride complex, Bourrez, Hammarström et al. reported a slope for ∂ln(kPCET)/∂ΔG°PCET of (68 meV)–1,28 which is equivalent to a Brønsted α of 0.66. With one series of tethered phenol-CH2-pyridine compounds, MS-CPET oxidations showed a linear Brønsted plot (α = 0.54) with variation of both the oxidant and internal base,21 while a related series containing conjugated phenol-pyridines showed a poorer correlation, likely due to communication between the phenol and the base.21
III. Synchronous e− and H+ transfer. The result that the MS-CPET rate constants respond equivalently to the energetics of the ET and PT components means that the transfers of e− and H+ in this MS-CPET process are synchronous
There are a couple of different ways to think about synchronous e−/H+ transfer. If the e− and H+ are considered as classical particles, this would mean that they have transferred the same amount at the transition state. In the more realistic treatments of Marcus Theory and in Hammes-Schiffer’s Multistate Continuum Theory, the e− or the e− and H+ are treated as quantum particles, whose transfers are made possible by solvent and inner sphere reorganization of heavier nuclei.35,36 In these models, synchronous transfer means that the reorganizations and the transition structure(s) that lead to e− and H+ transfer are halfway along the reaction coordinate. This is also the conclusion based on the traditional interpretation of the Brønsted α being close to 0.5 and the reversibility of the reactions. If electron transfer were occurring at a transition structure in which the reorganization for proton transfer had mostly occurred, then the MS-CPET rates would have been much more sensitive to changes in the proton transfer energetics. Similarly, if electron transfer were occurring at a transition structure in which the proton was little perturbed from the hydrogen-bonded precursor complex, then the rate constants would have been relatively insensitive to the proton transfer energetics.
Grunwald has presented a quantitative analysis of concerted reactions that can be described by two progress variables, determining the “disparity of progress of the two reaction events.”37 He applied a two-dimensional Marcus-theory analysis to a More O’Farrell plot (Figure 4), defining a disparity axis from y = 0 to 1 connecting the two intermediates in the stepwise mechanisms. The deviation of y from 0.5 is a measure of the disparity. A key parameter is the difference in energy between the two intermediates (here called ΔG°disp), which in MS-CPET is the difference between ΔG°ET and ΔG°PT. Grunwald analyzed experimental data for degenerate double-proton transfer reactions involving methanol and a benzoic acid (Figure 4c), finding that the concerted transfer was significantly displaced toward more deprotonation of the benzoic acid and protonation of the methanol. This displacement is due to the higher acidity of the benzoic acids, making the ArCO2−/MeOH2+ intermediate at the bottom right of Figure 4c more stable than the alternative intermediate. The reaction was found to be quite displaced from the symmetrical y = 0.5, with y varying from 0.15 to 0.22, depending on the acidity of the benzoic acid. ΔG°disp was varied by 4 kcal mol−1 by changes in the acid, causing a factor of 14 change in the rate constants for the degenerate processes (a change in ln(k) of 2.3).
Figure 4.

Grunwald analysis37 of the disparity of a two-component concerted reaction. In (b), a hyperbolic paraboloid E(x,y) represents the free energy surface. The mean reaction progress is given by the parameter x (from 0 to 1), shown as the solid arrow in (a), the More O’Farrell diagram for MS-CPET and as r → p in (c). The perpendicular ‘disparity’ axis, 0 < y < 1 in shown in (a) as a double-headed dotted arrow. The disparity is indicated by the displacement of the transition state along y, as the curvature of the reaction progress arrow toward one of the corners. Figures b) and c) reproduced from37 with permission.
For the reactions presented here in the low driving force regime (lnKeq < 11), the ΔG°disp was varied by 6.2 kcal mol−1 by changing the oxidant and 5.5 kcal mol−1 by changing the base. These changes in the separate coordinates are larger than the changes examined by Grunwald. Still, these changes do not cause any significant deviation of the rate constants from the expected ln(k) vs. ln(Keq) line, as evidenced by very similar slopes for changes in the base [0.59(2)] or changes in the oxidant [0.53(4)]. While it is clear that the Grunwald y must be quite close to ½, deriving a specific y value does not seem possible for the non-degenerate MS-CPET reactions based on this dataset. Using this analysis, the observed equal dependence of kMS-CPET on changes in the ΔG°ET and ΔG°PT components is a good definition of synchronous transfer of the two particles.
IV. Steric inhibition of MS-CPET
The k2 values for the 2,6-lutidine and 2-Mepy reactions are lower than predicted, as they lie below the fit line in Figure 3. The lutidine reaction has a ΔG°MS-CPET very similar to the 4-MeO-py reaction, yet its k2 is a factor of 3.5 slower. The slower rate constants for lutidine and 2-Mepy are very likely due to the ortho-methyl substituents sterically inhibiting proton transfer. We emphasize that these k2 values are for reactions starting from the hydrogen-bonded adducts TEMPOH…2-Menpy, and in fact this kinetic effect is larger than the effect of the methyl groups on the KHB to form the adducts. The KHB is only a factor of 2.1 smaller for lutidine than for 4-MeO-py. The lower rate constants for the sterically encumbered bases is very likely due to the favored transition state structure involving a compression of the proton donor-acceptor distance from the initial adduct, as indicated by theoretical descriptions of CPET.20,36,38 Thus, the deviations of the 2,6-lutidine and 2-Mepy reactions from the Brønsted correlation show the modest sensitivity of the MS-CPET reactions to changes in the hydrogen bond and proton-transfer coordinate.
In principle, one marker of a change in hydrogen-bond distance could be the kinetic isotope effects (KIEs) for TEMPOH versus TEMPOD. However, these do not show any clear correlation with hydrogen bond strength (KHB) or driving force (ΔG°MS-CPET). Surprisingly, the 2,6-lutidine and 2-Me-py reactions have the lowest KIE values. While a simple tunneling model would predict a higher KIE for a longer OH…N hydrogen bond, Multistate Continuum Theory suggests that this is not a good approximation.39 In tethered phenol-base compounds, Hammarström et al. have reported larger KIEs for longer distances,19,23 while we have observed the opposite in one case.18 The results reported in the current study are consistent with the conclusion that the KIE is not a simple reflection of the proton-acceptor distance.
V. Marcus Theory analysis of the reactions
Marcus Theory (eq 8), which has been widely used to interpret PCET reactions,1-4,7,17 predicts that the Brønsted α for a series of similar reactions is given by eq 9 (ΔG* being similar to the Eyring ΔG‡ for adiabatic reactions).35 In the low driving
| (8) |
| (9) |
force limit with |ΔG°|/λ ≪ 1, α is predicted to be 0.5, as observed for the reactions examined here (α = 0.46). Over a wider range of ΔG°, Marcus theory predicts a quadratic dependence of ln(k) on ΔG°, and the data in Figure 3 provide a hint of that predicted curvature. The points at either end are below the best-fit line and those in the middle are on or above the line, except for the lutidine and 2-MePy points that were discussed above. As noted above, the slope of the line in the low-driving force regime is 0.55(2) while the value at higher driving forces (ln(Keq) > 11) is 0.41(3), illustrating the slight curvature. Fitting all of the points except 4 and 5 to the Marcus equation (eq 8) gives a very rough estimate of the intrinsic barrier, λ ≅ 2.2 eV, and κν ≅ 1011 M−1 s−1. This estimated λ is larger than those found for MS-CPET where the base is covalently tethered to a phenol, which typically have λ ≤1.3 eV.17,8,40,41 A recent study of phenol oxidations by a ruthenium photooxidant in a termolecular MS-CPET system showed λ > 0.8 eV.8 The apparently larger intrinsic barrier in the three-component systems reported here is likely due to TEMPOH having an inherently large intrinsic barrier for PCETreactions42,43 and could perhaps be due to the extra degrees of freedom associated with the intermolecular TEMPOH-py hydrogen bond, compared with tethered analogs. Still, these comparisons of intrinsic barriers must be considered tentative, as they involve our very approximate λ value and others often derived in different ways.
VI. Comparing MS-CPET and HAT
This study can also address how the rate of CPET is affected by completely separating the proton and electron. We compare the rate constants for the three-component TEMPOH oxidations to the rate of a simpler hydrogen atom transfer (HAT) reaction where the proton and electron move together from a single donor to a single acceptor, at the same overall driving force (ΔG°CPET).6 The orange inverted triangle (▼) in Figure 3 represents the HAT reaction from TEMPOH to 2,4,6-tri-tert-butylphenoxyl radical (tBu3PhO•).32,44 This TEMPOH HAT reaction is a bit slower than the bimolecular rate constants for the TEMPOH…(R-py) + oxidant reactions at similar driving forces. We emphasize that this comparison is by nature approximate, and in this case, it is difficult to account for the steric crowding about the oxyl radical in tBu3PhO•. Still, the steric crowding in the 2,6-lutidine reaction is not so different and slows the reaction by only a factor of ~3.5. The TEMPOH + tBu3PhO• HAT reaction is below the correlation line by about the same amount as the 2,6-lutidine reaction. Thus, the Marcus intrinsic barrier λ appears to be similar for e− and H+ removal by the Cp2Fe+/2,6-lutidine pair and by tBu3PhO•. Therefore, despite the attendant uncertainties, it seems clear that complete separation of the donor and acceptor does not substantially slow the MS-CPET oxidation of TEMPOH reaction compared to a related HAT reaction. This supports the conclusion of Wenger et al. based on phenol oxidations by photoexcited ruthenium complexes, comparing reactions in which the proton transfer occurs either to an external pyridine or to a ruthenium bipyrazine ligand.8
The TEMPOH + pyridine + Ox+ three-component reactions are, however, ca. 104 slower than related reactions of tethered phenol-pyridines, . The rate constant for the three-component TEMPOH reactions at zero driving force (the intrinsic k°) is about 50 M−1s−1 (Figure 3), while those for the tethered phenol-pyridines plus NAr3•+ and [Fe(diimine)3]3+ oxidants are between 4×10⁴ and 5×10⁶ M−1s−1.21 The faster reactions of the phenol compounds is likely due to the two effects: (i) the much stronger hydrogen bond in the tethered systems,21 and (ii) the apparently much lower intrinsic barrier for e− and H+ removal from phenol than from TEMPOH. We estimate the relative intrinsic barriers from their HAT self-exchange rate constants (X + HX → HX + X): 5×10⁶ M−1 s−1 for PhO• + PhOH; 20 M−−1 s−1 for tBu3PhO• + tBu3PhOH; and 5 M−1 s−1 for TEMPO + TEMPOH.32 Future studies in our laboratory will probe whether such relative intrinsic barriers are similar for HAT and MS-CPET reactions.
Conclusions
The studies of three-component multiple-site concerted proton electron transfer (MS-CPET) reactions reported here show how the PCET reactions depend on independent variation of the proton transfer and electron transfer components. The change in the rate constant for removal of e− and H+ from the hydroxylamine TEMPOH is the same whether the driving force (ΔG°MS-CPET) is changed with the identity of the ferrocenium oxidant or the pyridine base. The combined Brønsted plot shows a linear correlation of ln(kMS-CPET) with ln(Keq), with a slope α = 0.46. The transition state thus responds equivalently to energetic changes in the proton and electron transfer portions of the PCET reactions. This behavior, with α close to ½, has been seen in a few other MS-CPET systems.8,26,27,28 These reactions are therefore synchronous, with the reorganizations that enable the e− and H+ transfers proceeding equally along the reaction coordinate. Synchronicity is a fundamental aspect of a PCET processes that is possible to address experimentally because of the three-component nature of these reactions. The sterically encumbered 2,6-lutidene base (2,6-Me2py) forms a weaker hydrogen bond with TEMPOH and the rate constant for MS-CPET from this weak hydrogen-bonded adduct is slower than for other pyridines. This suggests that the proton donor-acceptor distance typically must be compressed in the MS-CPET transition state, consistent with PCET theory. A rough comparison of these three-component e−/H+ transfer reactions with a related hydrogen atom transfer from TEMPOH suggests that the rate constants and intrinsic barriers are similar, despite the complete separation of the e− and H+ to different acceptors in the three-component case.
Experimental
All compounds were obtained from SigmaAldrich and used as received unless otherwise indicated. TEMPO was purified by sublimation under vacuum prior to use. Solvents were purchased from Fisher and deuterated solvents were purchased from Cambridge Isotope Labs. Methylene chloride was dried by running through a column of activated alumina, degassed, and stored over 4 Å molecular sieves before use. TEMPOH was synthesized following the literature reported anhydrous synthesis.45 Methanol-D (CH3OD) was dried over 4 Å molecular sieves and stored under inert atmosphere. Anhydrous TEMPOD was synthesized by stirring TEMPOH with CH3OD for 1h then removing volatiles under vacuum. Pyridine bases were distilled and dried over 4 Å molecular sieves. 1,2,3,4,5-pentamethylferrocene46 was synthesized from iron(II)bis(acetylacetonate)47 according to literature procedures. Ferrocene and 1,2,3,4,5-pentamethylferrocne were oxidized with AgPF6 according to literature procedures.48 1H NMR spectra were recorded at ambient temperature on either an A400 or A500 DD2 Agilent spectrometer operating at 400 MHz or 500 MHz, respectively. Spectra were referenced to the residual solvent signal (5.32 ppm) for CHDCl2. UV-vis spectra were recorded on an Agilent Cary 60 spectrophotometer. IR spectra were recorded inside a Nitrogen filled glovebox with a Bruker Alpha FT-IR spectrometer using a CsF liquid cell with a 1 mm pathlength. Kinetic measurements were recorded on an OLIS-RSM 1000 single mixing stopped flow spectrophotometer in anaerobic methylene chloride solvent. Full details of these and other measurements are given in the Supplementary Information.
Supplementary Material
Acknowledgments
We gratefully acknowledge the financial support from the US National Institutes of Health, 2R01GM50422. The authors are also grateful to valuable comments on the manuscript by Brian Koronkiewicz and Dr. Giovanni Parada.
Footnotes
Supporting Information.
Experimental details, derivations and data analysis for cyclic voltammetry, kinetics, IR and 1H NMR spectroscopy, and relative pKa measurements.
References
- 1.Weinberg DR, Gagliardi CJ, Hull JF, Murphy CF, Kent CA, Westlake BC, Paul A, Ess DH, McCafferty DG, Meyer TJ. Chem Rev. 2012;112:4016–4093. doi: 10.1021/cr200177j. [DOI] [PubMed] [Google Scholar]
- 2.Costentin C, Robert M, Savéant JM. Chem Rev. 2010;110:PR1–PR40. doi: 10.1021/cr100038y. [DOI] [PubMed] [Google Scholar]
- 3.Dempsey JL, Winkler JR, Gray HB. Chem Rev. 2010;110:7024–7039. doi: 10.1021/cr100182b. [DOI] [PMC free article] [PubMed] [Google Scholar]
- 4.Huynh MHV, Meyer TJ. Chem Rev. 2007;107:5004–5064. doi: 10.1021/cr0500030. [DOI] [PMC free article] [PubMed] [Google Scholar]
- 5.Mayer JM. Acc Chem Res. 2011;44:36–46. doi: 10.1021/ar100093z. [DOI] [PMC free article] [PubMed] [Google Scholar]
- 6.Warren JJ, Tronic TA, Mayer JM. Chem Rev. 2010;110:6961–7001. doi: 10.1021/cr100085k. [DOI] [PMC free article] [PubMed] [Google Scholar]
- 7.Reece SY, Hodgkiss JM, Stubbe J, Nocera DG. Philos Trans R Soc London, Ser B. 2006;361:1351–1364. doi: 10.1098/rstb.2006.1874. [DOI] [PMC free article] [PubMed] [Google Scholar]
- 8.Nomrowski J, Wenger OS. Inorg Chem. 2015;54:3680–3687. doi: 10.1021/acs.inorgchem.5b00318. [DOI] [PubMed] [Google Scholar]
- 9.Nagel ZD, Klinman JP. Chem Rev. 2010;110:PR41–PR67. doi: 10.1021/cr1001035. [DOI] [PMC free article] [PubMed] [Google Scholar]
- 10.Yayla HG, Knowles RR. Synlett. 2014;25:2819–2826. [Google Scholar]
- 11.Shaw MH, Twilton J, MacMillan DWC. J Org Chem. 2016;81:6898–6926. doi: 10.1021/acs.joc.6b01449. [DOI] [PMC free article] [PubMed] [Google Scholar]
- 12.Choi GJ, Zhu Q, Miller DC, Gu CJ, Knowles RR. Nature. 2016;539:268–271. doi: 10.1038/nature19811. [DOI] [PMC free article] [PubMed] [Google Scholar]
- 13.Yayla HG, Wang H, Tarantino KT, Orbe HS, Knowles RR. J Am Chem Soc. 2016;138:10794–10797. doi: 10.1021/jacs.6b06517. [DOI] [PMC free article] [PubMed] [Google Scholar]
- 14.Hoffmann N. Eur J Org Chem. 2017;2017:1982–1992. [Google Scholar]
- 15.Rhile IJ, Markle TF, Nagao H, DiPasquale AG, Lam OP, Lockwood MA, Rotter K, Mayer JM. J Am Chem Soc. 2006;128:6075–6088. doi: 10.1021/ja054167+. [DOI] [PMC free article] [PubMed] [Google Scholar]
- 16.Costentin C, Robert M, Savéant J-M. J Am Chem Soc. 2007;129:9953–9963. doi: 10.1021/ja071150d. [DOI] [PubMed] [Google Scholar]
- 17.Costentin C, Robert M, Saveant J-M. Phys Chem Chem Phys. 2010;12:13061–13069. doi: 10.1039/c0cp00017e. [DOI] [PubMed] [Google Scholar]
- 18.Markle TF, Rhile IJ, Mayer JM. J Am Chem Soc. 2011;133:17341–17352. doi: 10.1021/ja2056853. [DOI] [PMC free article] [PubMed] [Google Scholar]
- 19.Zhang M-T, Irebo T, Johansson O, Hammarström L. J Am Chem Soc. 2011;133:13224–13227. doi: 10.1021/ja203483j. [DOI] [PubMed] [Google Scholar]
- 20.Markle TF, Tenderholt AL, Mayer JM. J Phys Chem B. 2012;116:571–584. doi: 10.1021/jp2091736. [DOI] [PMC free article] [PubMed] [Google Scholar]
- 21.Markle TF, Tronic TA, DiPasquale AG, Kaminsky W, Mayer JM. J Phys Chem A. 2012;116:12249–12259. doi: 10.1021/jp311388n. [DOI] [PMC free article] [PubMed] [Google Scholar]
- 22.Herzog W, Bronner C, Löffler S, He B, Kratzert D, Stalke D, Hauser A, Wenger OS. ChemPhysChem. 2013;14:1168–1176. doi: 10.1002/cphc.201201069. [DOI] [PubMed] [Google Scholar]
- 23.Glover SD, Parada GA, Markle TF, Ott S, Hammarström L. J Am Chem Soc. 2017;139:2090–2101. doi: 10.1021/jacs.6b12531. [DOI] [PubMed] [Google Scholar]
- 24.Biczók L, Gupta N, Linschitz H. J Am Chem Soc. 1997;119:12601–12609. [Google Scholar]
- 25.Biczok L, Linschitz H. J Phys Chem. 1995;99:1843–1845. [Google Scholar]
- 26.Fecenko CJ, Meyer TJ, Thorp HH. J Am Chem Soc. 2006;128:11020–11021. doi: 10.1021/ja061931z. [DOI] [PubMed] [Google Scholar]
- 27.Fecenko CJ, Thorp HH, Meyer TJ. J Am Chem Soc. 2007;129:15098–15099. doi: 10.1021/ja072558d. [DOI] [PubMed] [Google Scholar]
- 28.Bourrez M, Steinmetz R, Ott S, Gloaguen F, Hammarström L. Nat Chem. 2015;7:140–145. doi: 10.1038/nchem.2157. [DOI] [PubMed] [Google Scholar]
- 29.The TEMPO reduction is reported only as termolecular rate constants. No hydrogen bond formation was observed between TEMPO and 4-Me-pyridinium hexafluorophosphate by IR spectroscopy. This is likely due to strong ion pairing between the 4-MepyH+ cation and the PF6− anion in CH2Cl2 and the limited solubility of 4-MepyH+PF6−.
- 30.A relative pKa scale is available in dichloroethane:; Kütt A, Rodima T, Saame J, Raamat E, Mäemets V, Kaljurand I, Koppel IA, Garlyauskayte RY, Yagupolskii YL, Yagupolskii LM, Bernhardt E, Willner H, Leito I. J Org Chem. 2011;76:391–395. doi: 10.1021/jo101409p. [DOI] [PubMed] [Google Scholar]
- 31.Waidmann CR, Miller AJM, Ng C-WA, Scheuermann ML, Porter TR, Tronic TA, Mayer JM. Energy Environ Sci. 2012;5:7771–7780. [Google Scholar]
- 32.Warren JJ, Mayer JM. Proc Natl Acad Sci. 2010;107:5282–5287. doi: 10.1073/pnas.0910347107. [DOI] [PMC free article] [PubMed] [Google Scholar]
- 33.Kaljurand I, Kütt A, Sooväli L, Rodima T, Mäemets V, Leito I, Koppel IA. J Org Chem. 2005;70:1019–1028. doi: 10.1021/jo048252w. [DOI] [PubMed] [Google Scholar]
- 34.Eberson L. Adv Phys Org Chem. 1982;18:79–185. [Google Scholar]
- 35.Marcus RA, Sutin N. Biochim Biophys Acta (BBA) - Bioenergetics. 1985;811:265–322. [Google Scholar]
- 36.Hammes-Schiffer S, Stuchebrukhov AA. Chem Rev. 2010;110:6939–6960. doi: 10.1021/cr1001436. [DOI] [PMC free article] [PubMed] [Google Scholar]
- 37.Grunwald E. J Am Chem Soc. 1985;107:125–133. [Google Scholar]
- 38.Hatcher E, Soudackov A, Hammes-Schiffer S. J Phys Chem B. 2005;109:18565–18574. doi: 10.1021/jp052909f. [DOI] [PubMed] [Google Scholar]
- 39.Edwards SJ, Soudackov AV, Hammes-Schiffer S. J Phys Chem A. 2009;113:2117–2126. doi: 10.1021/jp809122y. [DOI] [PMC free article] [PubMed] [Google Scholar]
- 40.Schrauben JN, Cattaneo M, Day TC, Tenderholt AL, Mayer JM. J Am Chem Soc. 2012;134:16635–16645. doi: 10.1021/ja305668h. [DOI] [PMC free article] [PubMed] [Google Scholar]
- 41.Costentin C, Hajj V, Louault C, Robert M, Saveant JM. J Am Chem Soc. 2011;133:19160–19167. doi: 10.1021/ja206561n. [DOI] [PubMed] [Google Scholar]
- 42.Wu A, Mayer JM. J Am Chem Soc. 2008;130:14745–14754. doi: 10.1021/ja805067h. [DOI] [PMC free article] [PubMed] [Google Scholar]
- 43.Wu A, Mader EA, Datta A, Hrovat DA, Borden WT, Mayer JM. J Am Chem Soc. 2009;131:11985–11997. doi: 10.1021/ja904400d. [DOI] [PMC free article] [PubMed] [Google Scholar]
- 44.The rate constant is for a reaction in carbon tetrachloride solvent but the conditions should be quite similar to the reactions studied here in methylene chloride.
- 45.Giffin NA, Makramalla M, Hendsbee AD, Robertson KN, Sherren C, Pye CC, Masuda JD, Clyburne JAC. Org Biomol Chem. 2011;9:3672–3680. doi: 10.1039/c0ob00999g. [DOI] [PubMed] [Google Scholar]
- 46.Manriquez JM, Bunel EE, Oelckers B. Inorg Synth. 1997;31:214–217. [Google Scholar]
- 47.Manriquez JM, Bunel EE, Oelckers B, Roman E. Inorg Synth. 1997;31:267–269. [Google Scholar]
- 48.Connelly NG, Geiger WE. Chem Rev. 1996;96:877–910. doi: 10.1021/cr940053x. [DOI] [PubMed] [Google Scholar]
Associated Data
This section collects any data citations, data availability statements, or supplementary materials included in this article.