Abstract
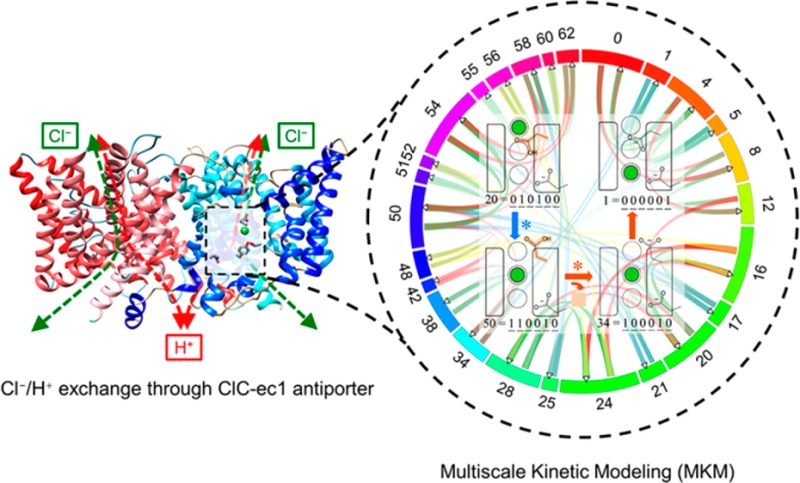
Despite several years of research, the ion exchange mechanisms in chloride/proton antiporters and many other coupled transporters are not yet understood at the molecular level. Here, we present a novel approach to kinetic modeling and apply it to ion exchange in ClC-ec1. Our multiscale kinetic model is developed by (1) calculating the state-to-state rate coefficients with reactive and polarizable molecular dynamics simulations, (2) optimizing these rates in a global kinetic network, and (3) predicting new electrophysiological results. The model shows that the robust Cl:H exchange ratio (2.2:1) can indeed arise from kinetic coupling without large protein conformational changes, indicating a possible facile evolutionary connection to chloride channels. The E148 amino acid residue is shown to couple chloride and proton transport through protonation-dependent blockage of the central anion binding site and an anion-dependent pKa value, which influences proton transport. The results demonstrate how an ensemble of different exchange pathways, as opposed to a single series of transitions, culminates in the macroscopic observables of the antiporter, such as transport rates, chloride/proton stoichiometry, and pH dependence.
Introduction
Chloride channel (ClC) proteins are members of a large family of passive chloride channels and secondary active transporters that can be found in a wide range of organisms from bacteria to plants, invertebrates, and humans.1 In mammalian cells, some of the isoforms (ClC-0, ClC-1, ClC-2, Ka, and Kb) function as Cl– channels, which passively transport Cl– across the membrane when there is a concentration gradient. Other isoforms (ClC-3, ClC-4, ClC-5, ClC-6, and ClC-7) function as Cl–/H+ exchangers (also called antiporters), which pump protons thermodynamically uphill driven by a Cl– gradient in the opposite direction, and vice versa.2,3 Each isoform is involved in various biological functions, such as the regulation of membrane potentials, transepithelial Cl– transport, extracellular ion homeostasis, endocytosis, and lysosomal acidification.2 Mutations in at least five out of the nine human ClC genes are known to cause genetic diseases in various tissues, including muscle, kidney, brain, ear, and bone.2 Understanding this family of proteins thus has great implications for both health and fundamental biology.
Numerous mechanistic studies have focused on ClC-ec1, a bacterial Cl–/H+ exchanger from Escherichia coli and a model ClC antiporter (Figure 1). Despite significant progress, fundamental questions remain, including how the protein transports ions, and how proteins in the same family and with such similar structures act either as passive channels or as active transporters. Given that most active secondary transporters, such as LacY and NapA,4 involve large protein conformational changes, while channels rarely employ such conformational changes, the two processes seem quite different. Nevertheless, ClC channels and antiporters share very similar structures.1 A recent cryo-EM study5 showed a difference between the ClC-K channel and ClC-ec1 in the αC-D loop in Cl– transport pathway; however, the displacement was much smaller than the typical conformational changes of other transporters. Several recent experimental6−10 and computational studies9,11 have also suggested that conformational changes occur in residues or helical structures further away from the transport pathways that are also coupled to the transport of both ions. Intriguingly, the key proton transporting residue E148, which lies close to the center of the membrane, is the N-terminus of a displaced transmembrane helix, a structure often associated with sites where some flexibility is required.12,13 However, no crystal structure of ClC-ec1 or other homologous proteins has shown large structural changes, and the experimental data are unclear on the magnitude and impact of these structural rearrangements.
Figure 1.
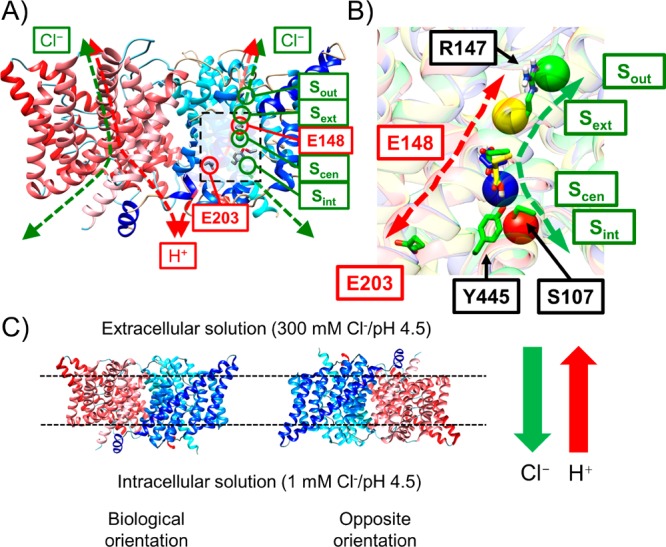
(A) Overview of the ClC-ec1 antiporter structure and transport pathways for Cl– (green dashed) and H+ (red dashed) based on PDB ID: 1OTS.14 ClC-ec1 is a homodimer (monomer A shown in blue and monomer B in red). The central region of monomer A is highlighted by the dashed black box. Flux in either direction is possible; this figure illustrates the direction of flux we consider the “biological” direction in our models. The positions of four binding sites for Cl– (Sout, Sext, Scen, and Sint) are shown as green circles, and the H+-transporting E148 and E203 residues are in red circles. (B) Representative configurations of important side chains on the Cl– and H+ pathways. Each configuration was obtained by averaging the system coordinates in the MD trajectories from corresponding windows in the 2D PMF, as described in the Methods. Sout, Sext, Scen, and Sint are represented by green, yellow, blue, and red spheres, respectively. E148, protonated in all configurations, occupies Scen when it is in the down conformation (colored in yellow), but rotates up when Cl– occupies Scen. (C) The absolute rate of the ionic flux per one protein monomer was measured by in vitro Cl– efflux assays,6,15−17 with 300 mM/1 mM Cl– gradient from the extra- to the intracellular solution, and symmetric pH (4.5) on both sides. Half of proteins associate with the membrane (indicated by dotted lines) in a biologically relevant orientation, and the other half in the opposite orientation. The green and red arrows represent the direction of the net ionic flux of Cl– and H+, respectively.
Figure 1A shows the homodimer structure of ClC-ec1. Biologically, the protein is believed to be consistently oriented in the membrane with extracellular bulk above and intracellular bulk below the protein as depicted in Figure 1. Many electrophysiological experiments with wild-type (WT) and single-point mutants15,18−23 have been performed to help elucidate protein function. Notably, these studies could not be performed with the protein only in one orientation, as is believed to occur in vivo, because consistent protein orientation is not currently possible in vitro when the protein is isolated in constituted liposome membranes for activity studies. It is believed that approximately half of the proteins are orientated as they would be biologically with “Sint” closest to the intracellular (or micellar) bulk, and the other half in the opposite orientation24 (see Figure 1C). The absolute rate of the ionic flux per one protein monomer was therefore measured with mixed orientation of protein. A few studies have attempted to selectively measure properties of proteins oriented in only one orientation by adding an inhibitor that selectively blocked the opposite orientation.25,26 Although the inhibition was not complete, the results indicate that the flux and 2.2:1 Cl–/H+ exchange ratio are similar in both orientations. Significant effort was made in these studies to obtain biologically relevant data, which is nontrivial, as it has been found that the protein can transport ions in either direction.18,19
Collectively, these activity studies have measured net ionic fluxes of Cl– and H+ as influenced by the ionic concentration gradients in solution, mutations of residues participating in ion transport, the external electric field across the membrane, and binding of other ligands.23,25,26 It has consistently been shown that Cl– and H+ fluxes are coupled with a robust exchange ratio (2.2:1 for Cl–:H+) over a wide range of relevant pH and Cl– gradients.6,18,24,27 The transport direction is determined by the sum of the membrane potentials for Cl– and H+ across the membrane, weighted by their exchange ratio. Each protein monomer has two separate pathways for ion transport, with the Cl– and H+ pathways overlapping from E148 to the extracellular solution, and diverging below E148 (Figure 1A,B).14,19 Our simulations show that the protonation of E148 opens the extracellular gate and allows Cl– transport, which is in agreement with previous experimental studies using the E148Q mutant to mimic a permanently protonated Glu.14,28 Additionally, the Cl– flux rate in WT ClC-ec1 is pH dependent, but becomes independent in the E148A mutant.19
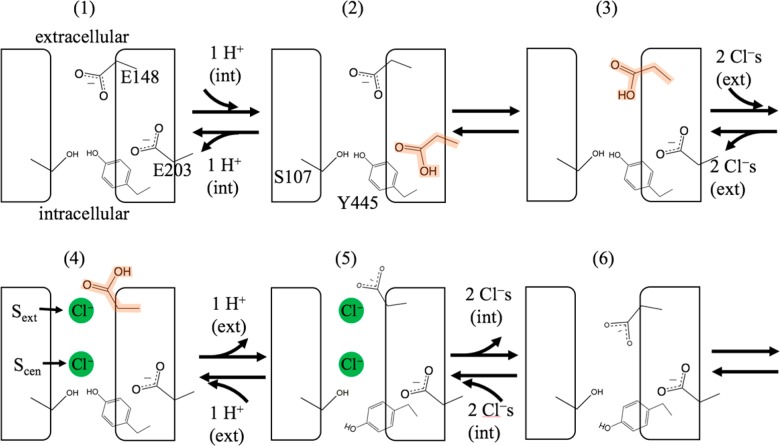
In search of the underlying steps that generate these observed experimental results, several groups have proposed mechanistic cycles for Cl–/H+ antiport.1,6,9,23,24,29 Generally, these postulated mechanisms involve a series of discretized transitions occurring between intermediate states; one such cycle proposed by Basilio et al. is shown in Figure 2.1,6 The proposed models differ in details such as how many Cl– ions occupy the channel at once, the order in which Cl– and H+ ions enter and leave the pore, and whether Y445 and/or S107 act as gates.23,24,29 They are consistent, however, on several features, including the postulation of key states based on X-ray crystal structures of the WT, E148A mutant, E148Q mutant,14 and eukaryotic homologue,22 as well as the identification of three Cl– binding sites (Sext, Scen, and Sint), as shown in Figure 1B. The participation of E148 and E203 in proton transport is hypothesized based on site-directed mutagenesis experiments18,19 that showed that the substitution of E148 or E203 for hydrophobic residues effectively blocks proton transport, although E203 is less essential than E148 in ClC-ec115 and other ClC proteins.22,30 Additional proposed key movements include rotation of the E148 side chain between the “up” and “down” conformations, based on crystal structures of the WT, the E148Q mutant, and a eukaryotic homologue, which showed three different conformational states for the side chain of E148 (E210 in the eukaryotic ClC).6,9,23,31 A recent computational study32 has proposed another Cl–/H+ antiport cycle based on thermodynamic analysis of binding affinities. Although the proton affinity of E148 and Cl– binding affinity were calculated for many different states in this study, the interaction energy is calculated using an implicit solvent model, and, significantly, the role of kinetics was not considered.
Figure 2.
Schematic of the Cl–/H+ antiport mechanism proposed by Basilio et al.,1,6 with numbered conformation of the protein representing a distinct “state”. Double-arrows indicate that both transport directions are possible. In this work, we define a “positive” transport direction as Cl– transport from extracellular to intracellular bulk (with H+ transport in the opposite direction). In the postulated mechanism above, the “positive” direction corresponds to moving between states in the following order: from an initial state (1) with both E148 and E203 deprotonated, E203 is protonated by a proton from the intracellular solution moving to state 2. To create state 3, a proton is transferred from E203 to E148. While E148 is protonated (highlighted orange), two Cl– ions enter the protein from the extracellular solution and bind to Sext and Scen to create state 4. With these chloride ions present, E148 is deprotonated and H+ is released to the extracellular solution to create state 5, which also involves the opening of the internal gate at Y445 (also called Tyrcen) by the conformational change of helix O (not shown here). State 6 is reached after two Cl– ions at Sext and Scen are released to the intracellular solution. To return to the initial state and complete the cycle, the internal gate at Y445 closes.
While previous models of antiport differ in the order of steps and/or intermediate states, they share one significant commonality: all assume that one path is followed, leading to observables such as the consistent Cl–/H+ exchange ratio (2.2:1) across a range of pH values. The idea of multiple pathways (i.e., sequences of transitions) contributing to the mechanism has not been widely embraced in the community, partially because of the belief that this would allow passive leakage of either ion depending on conditions, which would perturb Cl–/H+ coupling and stoichiometry.24 In this work, we take a different approach: rather than a “top-down” proposal of a single mechanism based on the macroscopic observables, we start with the atomistic movements that can stochastically occur with probabilities depending on their energy barriers and the system’s ability to surmount them at finite temperatures. This approach is a “bottom-up” approach based on the theory of coupled kinetics in stochastic systems, as dictated by statistical mechanics.
The work presented here provides a novel multiscale synthesis of the results of three computational methods to yield a complete kinetic model of the ClC-ec1 exchange process. We have integrated experimental evidence6,14−18,21−23,33,34 and simulations by our group35,36 and others.37−39 Additionally, we have performed atomistic molecular dynamics (MD) simulations and Brownian dynamics (BD) simulations to fill in remaining gaps in understanding how chloride ions traverse the protein. All of the calculated individual transition rate coefficients are combined in the resulting multiscale kinetic model (MKM), which is constructed using concepts of a Markov state model (MSM) in which rate coefficients and calculated steady-state populations determine overall rates. While Markov and other discrete state models have been used to describe ion transport in proteins and even ClC family members,37,40,41 these models considered the movement of only one ion type, focusing on single-ion channels or proteins functioning as single-ion channels due to an applied current.41−44 Thus, to the best of our knowledge, this is the first discrete-state microkinetic model to address the high complexity of coupled ion exchange in a protein.
Our MKM uniquely combines computational and experimental data to optimize rate coefficients calculated from simulations. Each state in the MSM is defined by six system descriptors, which we found to be the minimal number required to capture transitions observed during simulations: chloride binding at three specific sites (Sout, Scen, and Sint), protonation of key “gating” residues (E148 and E203), and the orientation of the gating residue E148. Two positions were allowed for each descriptor (occupied or unoccupied; protonated or deprotonated; and “up” or “down”, respectively), leading to a total of 26 = 64 states, as described further in Methods. Whereas modeling an entire antiport cycle in one simulation is not feasible, MD and BD simulations coupled with enhanced free energy sampling and transition state theory, can provide estimates of transition rate coefficients for each possible discrete ion and protein transition. There is growing recognition that key biomolecular processes in living organisms are determined by kinetic selection,45 and it is the combination of many stochastic steps that contribute to the overall macroscopically observable values. By using an MSM to combine the kinetics for the possible transitions between states, we can study the overall protein dynamics unbiased by a priori selection of an overall transport cycle. Importantly, this also allows determination of rates, which are functions of both the rate coefficients and populations of the “reactant” states; thus, the largest transitions are not necessarily those with the largest rate coefficients, as is often assumed in studies that focus on a limited set of transitions, and the rates are a function of the external concentrations. Fitting within uncertainty was performed, as described herein. To validate the results, our MKM was then used to interpolate, extrapolate, and/or predict system properties including pH dependence of the net Cl– flux rate, the Cl–/H+ exchange ratio, and the pKa of E148. These results are found to be consistent with experimental findings, and this validation allows us to use the model to gain insight into the elementary mechanism of Cl–/H+ antiport, and to consider the results in the context of ClC-ec1 evolution, thus providing clues to the puzzle of out how passive channels and secondary active antiporters evolved within the same family.
Methods
Molecular Dynamics
Transition rate coefficients between different ClC-ec1 “states” (as described in the Introduction) were determined primarily through atomistic MD simulations. The simulation setup is similar to that performed in previous efforts36 and detailed in the Supporting Information (SI). A key difference is that in modeling transport of these charged species, we found it necessary to use a polarizable force field, specifically the Drude polarizable force field,46−52 to capture the polarization effect that was observed in density functional theory-level studies.53,54
Kinetic rate coefficients for Cl– transitions within the pore were estimated using transition state theory based on potentials of mean force (PMFs) created with the weighted histogram analysis method (WHAM)55,56 from data from 2D replica exchange umbrella sampling (REUS) simulations, as described in detail in the SI. To account for coupling between Cl– anions, 2D PMFs were calculated using the positions of two chloride ions in the protein pore as collective variables. For all REUS simulations, initial configurations for each window were generated using metadynamics, as also described in the SI.
Brownian Dynamics/Unbiased MD simulations
While MD simulations with enhanced sampling were used to determine kinetics of ion movement (and E148 rotation) within the pore, the longer time scale of transitions in the less constrained space outside the pore made this approach computationally inaccessible. Thus, BD simulations were performed to estimate rate coefficients for Cl– diffusion from the solution into the pore on both sides of the transmembrane protein, while Cl– diffusion from the pore to the solution was calculated with unbiased MD simulations using the CHARMM/Drude force field, as described in the SI.
Kinetic Modeling with the MKM
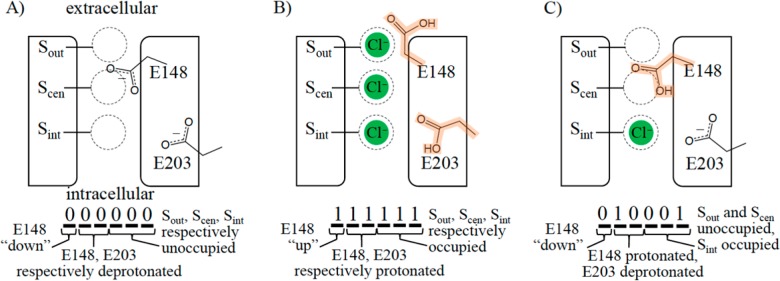
As noted in the Introduction and illustrated in Figure 3, the MKM represents the possible system states in terms of six key descriptors: (1) E148 is in either a “down” or “up” conformation; (2) E148 is deprotonated (−1 charge) or protonated (neutral); (3) E203 is deprotonated (−1 charge) or protonated (neutral); (4) the chloride ion binding site Sout is unoccupied or occupied; (5) Scen is unoccupied or occupied; and (6) Sint is unoccupied or occupied. This set represented the minimal numbers of descriptors we found necessary to reflect the main metastable conformations found in the MD and BD simulations, and is described in more detail in the SI. A consequence of allowing two options for each descriptor is that the states could be conveniently represented as binary numbers, allowing numerical designations of states to have physical meaning. For example, state “0” in decimal numbers corresponds to the binary representation in Figure 3 panel A, “63” to panel B, and “17” to panel C.
Figure 3.
MKM presented here comprises six system descriptors, each with two possible cases, which can be represented in binary notation. A “0” or “1” in the leftmost position corresponds to E148 in the “down” or “up” conformation, respectively. The next two positions correspond to E148 and E203 being deprotonated (“0”) or protonated (highlighted orange; “1”). The last three positions correspond to the three chloride ion binding locations (Sout, Scen, and Sint, respectively) with “0” and “1” corresponding to unoccupied and occupied, respectively. Panels A, B, and C illustrate three of the 64 possible states. Converting the binary numbers to decimal, these panels show states 0, 63, and 17, respectively.
This set of six descriptors results in 26 (64) possible states, and a 64×64 (4096) transition matrix. However, the matrix is very sparse, requiring only 68 rate coefficients, due to many disallowed transitions that result in part from the three different types of transitions. For example, a proton is not allowed to move to a Cl– binding site; neither could the E148 side chain occupy any site except “up” or “down.” Furthermore, a Cl– was disallowed from moving directly between Sout and Sint without first transitioning to and from Scen. The rates for the 68 physically meaningful, allowable transitions were determined from simulations with varying uncertainty depending on the method employed (as detailed in SI). The eigenvector of the transition matrix with an eigenvalue of zero determines the steady-state populations of each protein state. The MKM was written in Python 2.7 using readily available libraries including NumPy57 and DEAP.58 A key feature of our model is that it allows simulating a variety of experimental variables, such as user-specified internal and external pH and chloride ion concentrations. The transition matrix allowed the model to obey detailed balance. A central feature is the option to simulate the protein only in the biological orientation (as shown in Figure 1, with E148 closer to the external bulk and E203 closer to the internal), or randomized to approximately half in the biological orientation and half in the opposite orientation. This feature is key when comparing model results to data from experimental systems in which protein orientation could not be controlled.
The uncertainty of the MKM solution is a function of the uncertainty of all the individual rate coefficients; the combined uncertainty results in a large solution space that can include many unphysical solutions. To overcome this challenge, we optimized the 68 estimated rate coefficients within their uncertainties to six experimental data points (Cl– transport rates and Cl–:H+ transport ratios at pH 4.5, 6.0, and 7.5) using a particle swarm optimization procedure.59 During this procedure, the results from each of the two orientations were separately evaluated, based on the assumption that the flux and ratio results should be similar regardless of flux direction. We then filtered the solutions to those within a specified tolerance for the Cl– flux rate and Cl–:H+ transport ratio at these conditions, as well as rates in the absence of ion concentration gradients at pH 4.5 and Cl– concentrations of either 1 or 300 mM, as described in the SI. This limited number of data points still leaves the system of equations underspecified, and thus multiple solutions are possible. We present results from 10 solution sets meeting the above criteria, and also discuss variation in the complete set of solutions. It is important to note that there is one solution set which best represents the protein activity in nature, which itself includes a small ensemble of pathways that cumulatively result in the macroscopic observables. That solution is expected to have high overlap with one or more of the solutions we discuss below. As the rate coefficients for the various steps are determined more precisely (i.e., the error bars and tolerable variance is decreased), the MKM solution space will decrease to reveal the “correct” solution.
Results
Chloride Ion Transport
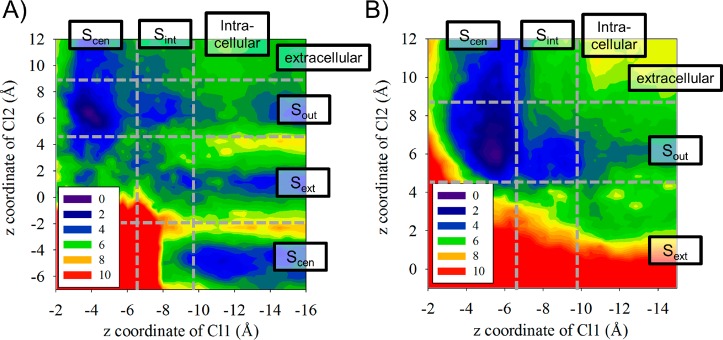
As described in the Methods, atomistic MD simulations with a polarizable force field were performed to estimate rate coefficients for chloride ion transitions between binding sites within the protein pore. These transitions are likely to depend on whether the gating residue E148 is protonated or not, but less likely to depend on the protonation state of E203, which does not reside within the chloride ion transport pathway (Figure 1). Thus, separate simulations were performed with and without E148 protonated, as described in further detail in the SI. Chloride transition rates within the protein are also likely to depend on the presence and proximity of other chloride ions. Thus, to obtain rate coefficients for Cl– transport within the protein pore, two-dimensional potentials of mean force (2D PMFs) were calculated, using a collective variable to track each of two chloride ions in the protein. The simulation system was aligned in a periodic box such that the z-coordinate was oriented perpendicular to the membrane surface. Within the protein, the channel shape constrains ions movement in the x- and y-coordinates, allowing us to use the z-coordinate to track ion location within the protein. Figure 4 shows the resulting PMFs for transport with E148 protonated (A) or deprotonated (B). In each panel, the horizontal plot axis tracks the z-coordinate of the lower chloride ion (“Cl1”) and the vertical axis tracks the z-coordinate of the higher chloride ion (“Cl2”). The plots are labeled with how the specified z-coordinate location maps to the designated chloride ion binding sites. Table S2 in the SI lists the free energy change for Cl– migrating through the pathway in the protein, depending on the position of the second Cl– migrating in the same pathway.
Figure 4.
2D PMFs of the lower Cl– (Cl1) and higher Cl– (Cl2) migrating through the Cl– pathway, with E148 protonated (A) and deprotonated (B). The positions for the Cl– binding sites are labeled. The color scale corresponds to the PMF change from 0 to 10 kcal/mol.
Interestingly, analysis of the free energy barriers indicates that transport of two chloride ions are not strongly coupled to each other, with the exception of avoiding physical overlap. For example, with E148 protonated the free energy barriers for Cl1 moving from Scen to Sint in the PMF differs only by 0.2 kcal/mol if Cl2 is position at Sout versus Sext. In general, we found that the presence of a second Cl– marginally decreases the free energy barrier of Cl– transport. A previous MD study of the eukaryotic homologue CmCLC reported that two chloride ions could simultaneously occupy Scen.60 However, this study included an applied electric field to mimic a transmembrane potential driving Cl– transport. In our studies without such an applied external force, two chloride ions were never observed in the same binding site.
Discretizing the continuous ion transport pathways is essential to develop a kinetic model such as this MKM. Since the number of rate coefficients needed grows exponentially with the number of states, it is beneficial to use the minimum number of kinetically essential chloride binding sites. We found it possible to reduce the four designated binding sites in Figure 4 to three sites in the MKM (Sout, Scen, and Sint) because the intermediate position Sext was only required to transition between Sout and Scen, and thus a combined rate coefficient could be determined. Moreover, we did not observe two chloride ions binding at Sext and Sout simultaneously, which would be another cause to explicitly track the Sout position. In contrast, we did find it necessary to explicitly track the Sint position. While Sint is a less energetically favorable binding site than the others, we found it to be a useful intermediate for connecting the full chloride transit pathway; as an outermost binding site before the pore opens to bulk, it provided a useful starting point for BD simulations for Cl– transit between the protein the bulk liquid, as described below.
E148 Rotation
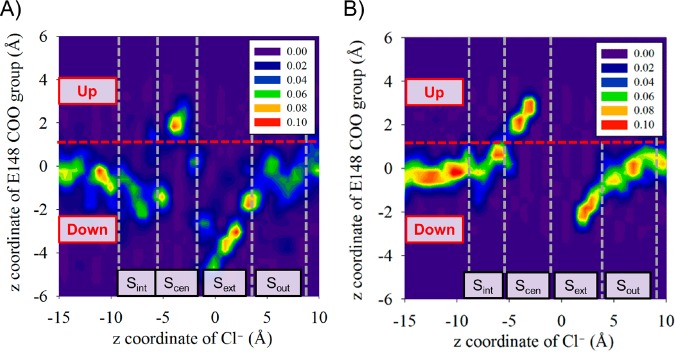
Figure 5 presents the conformational distributions of E148 (tracking the “down” vs “up” orientation on the vertical axis) as a function of the position of Cl– in the channel (horizontal axis). The orientation of E148 is determined by the z-distance between the center of mass of the whole protein and the center of mass of the E148 carboxyl group. The conformational distributions were calculated from the 2D Cl– PMFs (Figure 4) with either E148 protonated (A) or deprotonated (B). For the latter, there is a gap between Sext and Scen where very little data was collected since Cl– ions are effectively blocked from moving between these two sites when E148 is deprotonated. According to our previous multiscale reactive molecular dynamics (MS-RMD) simulations,35,36 when E148 is protonated the “down” conformation is favored by ∼6 kcal/mol and there is a ∼ 11 kcal/mol barrier for its rotation from “down” to “up”. In contrast, when E148 is deprotonated, the “down” conformation is more stable by ∼9 kcal/mol and there is no barrier from “up” to “down”, since the “up” conformation is no longer a metastable state. Figure 5 confirms that the “down” orientation is preferred regardless of protonation state, and further shows that only when Scen is occupied by a chloride ion, does E148 rotate up. We used these PMFs to define “up” and “down” positions of E148, as indicated in Figure 5. We note that this definition is slightly different than used in our previous work.35 In that work, we defined a “down” state with a Cl– at Scen for when E148 was rotated to interact with water molecules leading into the pore region, noting that the side chain could not reach as far into the pore as when Scen was not occupied by a chloride ion. That position in the pore corresponds to the lower basin in the region here defined as “up” in panel Figure 5B. Figure 5 also shows that transit of Cl– to and from Scen from either Sint or Sout is strictly coupled to E148 rotation. The converse is not true; as previously reported,35 E148 can rotate “up” and “down” without Cl– transit as long as Scen is not occupied by a chloride ion. The rate coefficients for all of the transitions were used to populate the MKM transition matrix, and all rate coefficients are listed in Table S3.
Figure 5.
Probability distribution of the rotation state of the carboxyl group of E148 as a function of the position of Cl–, with E148 protonated (A), and deprotonated (B). The distance along the z axis from the center of mass of alpha carbons of protein (the same origin for the Cl– position) to the center of mass of the carboxyl group of E148 is calculated from the trajectories of 2D umbrella sampling windows. E148 is in the “up” state in both protonated and deprotonated states when Cl– is present at Scen. The red lines at the middle of both plots represent a boundary between our definitions of the “up” and “down” positions of E148 in the MKM.
Additional Individual Transitions
In addition to the MD results shown above, we also analyzed the 2D PMFs to observe other protein movements associated with ion transport in ClC-ec1, such as movements of the Y445 gate. We observed some localized conformational changes at the external (E148) and the internal (Y445) gates, where the pore sizes are enlarged by ∼2 Å, when Cl– passes through the narrow region at each gate (Figure S1 in the SI). As previously noted, these movements were found to be coupled to chloride ion movement, and thus the transition coefficients determined for ion movement include the protein conformational changes, obviating the need to explicitly include additional protein movements in the MKM. Additionally, BD simulations were used to determine rate coefficients for chloride ion transitions between bulk fluid and the outermost binding sites in the protein. These results are provided in Table S3 in the SI.
MKM Results
The MKM was designed to allow comparison of measured properties from multiple experimental conditions. The transition matrix between the 64 discrete states was initially populated with 68 rate coefficients, as described in the Methods. In independently run fitting procedures, these rate coefficients were adjusted within their estimated error to match experimentally determined Cl–/H+ exchange ratio and Cl– rate at pH 4.5, 6.0, and 7.5 (equal on both sides of the vesicle during separate calculations), with a chloride ion concentration of 300 mM in the external bulk and 1 mM within the vesicle. To match experimental conditions, half of the proteins were oriented as they would be in vivo, and half in the opposite orientation. As noted in the SI, Accardi and co-workers have determined that, using such an experimental system, the Cl– transport rate is 2.337 ions/ms when the pH is 4.5 on both sides of the membrane bilayer,6 consistent with previous results by Miller and co-workers.16 We combined this result with a formula Accardi and co-workers fit to experimental data21 to calculate absolute rates from the reported relative Cl– transport rates at the same Cl– gradient and different pH values. Since six data points were used to adjust 68 parameters, the system of equations was under defined and fitting yielded multiple solution sets. We filtered the results based on another 4 data points, as discussed in the Methods, leaving 10 solution sets, which are discussed below. Importantly, the “correct” solution is expected to have high overlap with one or more of the solutions described below, and will be identified when the transition rate coefficients can be determined with more precision as more data is available on the activity of this protein.
We then used these solutions (each a set of elementary transition coefficients) in the MKM to predict Cl– transport rates at other physiologically relevant pH values, as shown in Figure 6 and Table 1. Figure 6 shows the chloride ion transport rate at the pH values used for fitting (pH 4.5, 6.0, and 7.5) and purely predicted values at pH 4.0, 5.0, 6.5, and 7.0, plotted alongside the formula from Accardi and co-workers (K = A/(1 + Ka/[H+]), where A is the maximal rate and Ka is the proton binding constant for E148), which they determined to be 6.2.21 We set the value for A = 2.38 Cl– ions/ms to reproduce the group’s measured transport rate of 2.337 Cl– ions/ms at pH 4.5. The average values and ranges of results are also shown in Table 1, as are additional results, many of them pure predictions from the model. For example, the values for the pKa of E148 and E203 were not fit, but were determined using the steady-state populations of each state in the Henderson–Hasselbalch equation, and thus determined by combining the individual rate coefficients. The predicted pKa of E148 (see Table 1) agrees with the experimentally determined value of 6.2 ± 0.1 within the uncertainty of the methods.21 While there is not an experimental value for the pKa for E203, the lower value is consistent with expectations; the E203 of monomer A can form a salt bridge with R28 of monomer B approximately 4 Å away, which stabilizes E203 in a negatively charged (deprotonated) state. As noted in the Methods, our solution sets were also tested to ensure that they did not permit ion transport in the absence of a gradient under two conditions. Specifically, with pH 4.5 and 1 mM Cl– on both sides of the bilayer and the protein in the biologically relevant orientation, Cl– transit was −0.01 ± 0.04 ions/ms and H+ transit was 0.11 ± 0.07 ions/ms. With the same conditions except for 300 mM Cl–, Cl– transit was 0.0 ± 0.1 ions/ms and H+ transit was −0.02 ± 0.08 ions/ms.
Figure 6.
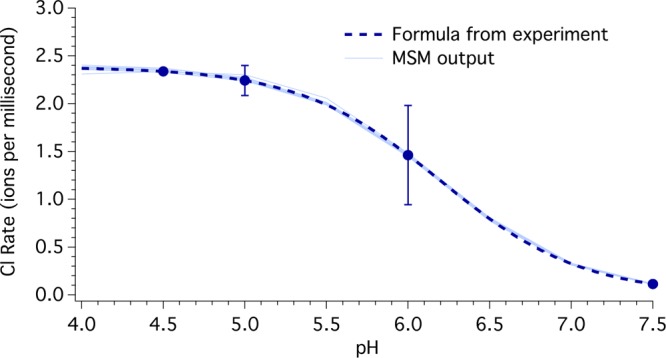
Chloride ion transport rates for external and internal chloride ion concentrations of 300 mM and 1 mM, respectively, for a range of pH values, with equal proton concentrations on both sides of a membrane bilayer. The dashed line and error bars represent the expected values from experiment, as described in the SI, and the 10 light blue lines connect MKM output values at pH 4.0 through 7.5 at intervals of 0.5. The chloride transport rates at pH 4.5, 6.0, and 7.5 were fit; all other values are model predictions.
Table 1. Average Values and Standard Deviations for Key Results from 10 MKM Solutionsa.
| Cl– rate (ions/ms) |
Cl:H ratio |
E148 pKa |
E203 pKa |
||||||
|---|---|---|---|---|---|---|---|---|---|
| pH | exp | avg | SD | avg | SD | avg | SD | avg | SD |
| 4.0 | 2.37 | 2.37 | 0.03 | 2.3 | 0.1 | 6.1 | 0.2 | 3.5 | 0.8 |
| 4.5 | 2.34* | 2.35 | 0.01 | 2.2* | 0.0* | 6.2 | 0.1 | 3.6 | 0.9 |
| 5.0 | 2.24 | 2.26 | 0.02 | 2.2 | 0.0 | 6.2 | 0.0 | 3.7 | 0.9 |
| 5.5 | 1.99 | 2.00 | 0.02 | 2.2 | 0.0 | 6.2 | 0.0 | 3.7 | 0.9 |
| 6.0 | 1.46* | 1.46 | 0.01 | 2.2* | 0.0* | 6.2 | 0.0 | 3.7 | 0.9 |
| 6.5 | 0.80 | 0.79 | 0.01 | 2.2 | 0.0 | 6.2 | 0.0 | 3.6 | 0.8 |
| 7.0 | 0.33 | 0.32 | 0.01 | 2.2 | 0.0 | 6.2 | 0.0 | 3.5 | 0.7 |
| 7.5 | 0.11* | 0.11 | 0.00 | 2.2* | 0.0* | 6.2 | 0.0 | 3.4 | 0.6 |
Asterisks indicate points used to adjust the MKM parameters (rate coefficients); all other values are pure model predictions.
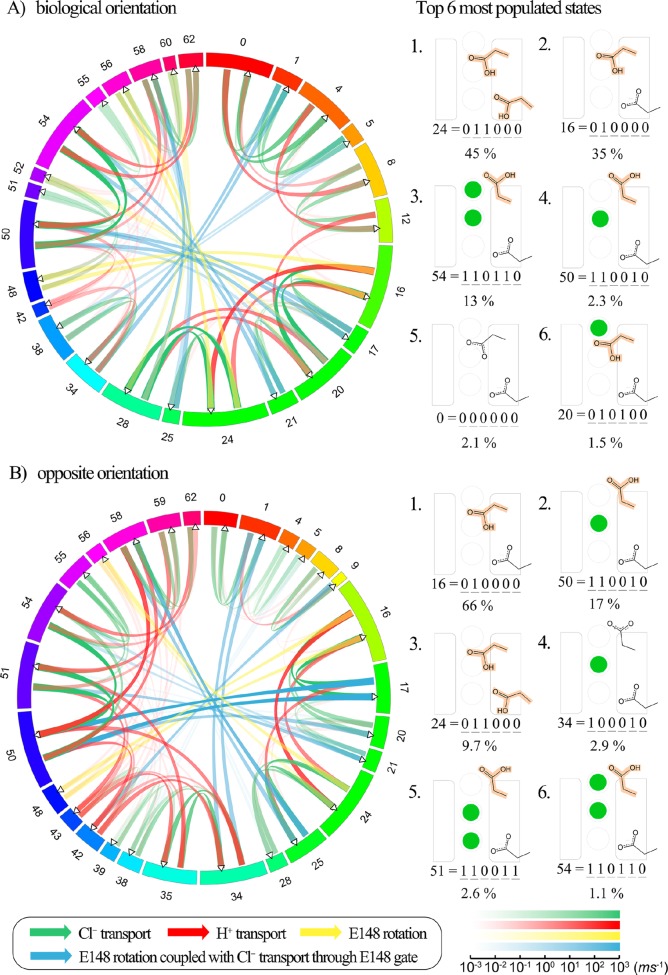
In addition to the results shown above, the MKM output can be interrogated to determine the ions’ pathways through the protein (i.e., the sequence of transitions that lead to a complete Cl– and/or H+ translocation across the membrane). Although each of the 10 solutions is unique, as further explored below, there are many common pathways and it is useful to consider the statistics they collectively represent. Importantly, the MKM allows determination of rates, which is a function both of the rate coefficients as well as the population of the “reactant” states; thus, the largest transitions are not necessarily those with the largest rate coefficients, as is often assumed in studies that focus on a limited set of transitions, and the rates are a function of the external concentrations. Here, we focus on the rates and paths for pH 4.5 on both sides of the membrane bilayer, 300 mM Cl– in the external bulk, 1 mM Cl– in the internal bulk, and equal fractions of the protein in each of the two possible orientations. A network diagram of the median rates for transition between each pair of states for all 10 solution sets is shown in Figure 7. The numbers on the outer circle indicate the state number, with larger sections indicating more populated states. The lines connecting the different states show possible transitions, with the width and the color scaled by the rate of the transition during steady state. Transitions are not possible between all states, as discussed in the SI, and not all states are populated. Specifically, with the definition used in this work of “up” and “down” for the E148 position, it is not possible to have both E148 down and Scen occupied, preventing states 2, 3, 6, 7, 10, 11, 14, 15, 18, 19, 22, 23, 26, 27, 30, and 31 from being occupied, which are thus excluded in the circular network graph in Figure 7. At these conditions, the two most populated states are 16 (E148 protonated and down, E203 deprotonated, and no chloride ions in the pore), 24 (like 16 except E203 is protonated), and 54 (E148 protonated and up, with both Scen and Sext occupied), which is consistent with the dynamic movement of the chloride ions, key rotation of E148, and the higher pKa of E148 (which is protonated in both of these states) compared to E203 (not protonated in states 16 or 54).
Figure 7.
Circular network graph created using Circos61 displaying median overall transition rates for the final 10 solution sets. The system is under symmetric pH 4.5 on both sides, and 300 mM/1 mM Cl– gradient through the membrane. Protein is placed in the biological orientation in (A), and in the opposite orientation in (B). The states are shown sequentially in the clockwise direction, with the numbers corresponding to states as shown in Figure 3; the colors are added only to distinguish between states. The fraction of the circumference corresponds to the relative population of each state during state to state ion exchange, scaled by logarithm. For simplicity, the states with a very low population (less than 10–6) are not shown. The lines in the center of the circle represent incoming flux (left) and outgoing flux (right), indicated by the arrow directions. The thickness and the transparency of the color of the flux correspond to the flux rate, logarithmically scaled. The color scale bar for the flux rate (in the unit of ms–1) is shown on the bottom right corner. For each orientation, the top six most populated states and the probability of each state are shown on the right.
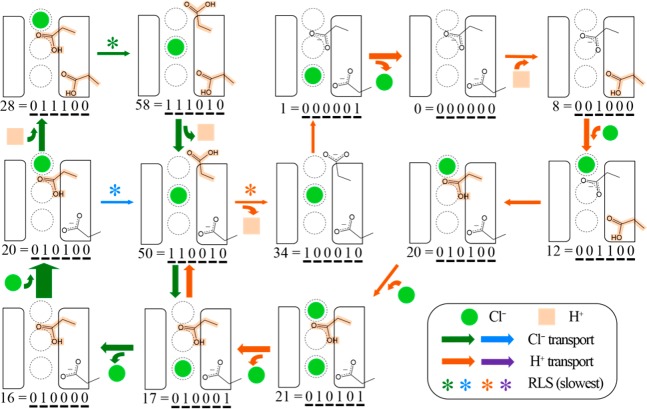
Sequences of individual steps that result in the transport of a chloride ion and/or proton were evaluated to determine which of the possible pathways contribute to flux through the protein. Notably, none of the identified solutions had just one mechanistic cycle that results in exchanging two chloride ions for one proton, as in Figure 2. Instead, each solution included multiple cycles that, combined, lead to the overall transport rates. To illustrate this point, Figure 8 shows all pathways that contributed at least 0.12 ions/ms to the overall rate in the biological orientation (as shown in Figure 1) for one of the 10 solution sets. Figure 9 shows such pathways for the protein oriented in the opposite orientation. Most of the pathways identified by the other 9 solution sets overlap with the ones shown here—some are the same and some are slightly different, as expected from the underspecified solution space. While the pathways shown in Figures 8 and 9 are not definitive, due to the uncertainties resulting from the underspecified problem, they are instructive and consistent with the experimental data for ClC-ec1 activity. In Figure 8, the five pathways are overlaid to highlight the states and steps that they have in common. There is one pathway that transports one H+ (orange), contributing 0.53 ions/ms to the total proton flux, and two pathways that transport one Cl– (green and green/blue), contributing 0.90 and 0.38 ions/ms to the chloride flux, respectively. When combined there are two cycles which exchange one proton and one chloride ion. It is instructive to notice the rate-limiting steps (RLS) in each pathway. For this solution, deprotonation of E148 in the presence of Clcen is rate limiting for the dominant H+ pathway,35 while the transition from Sout to Scen is rate limiting for Cl– transport. In both Cl– pathways, E148 is of course protonated, while E203 is protonated in the dominant pathway and deprotonated in the minor pathway.
Figure 8.
The five pathways (1 H+ in orange, 2 Cl– in green and green/blue, and 2 combined H+/ Cl–) that contribute most to ion transport for the biological orientation from one of solution set to the MKM, as described in the main text. The images and numbers represent the protein state (see Figure 3). The width of each arrow is proportional to the rate of transition with the RLS highlighted by an asterisk. The pH (4.5) and Cl– gradient (300 mM external and 1 mM internal) of the system are the same as in Figure 7.
Figure 9.
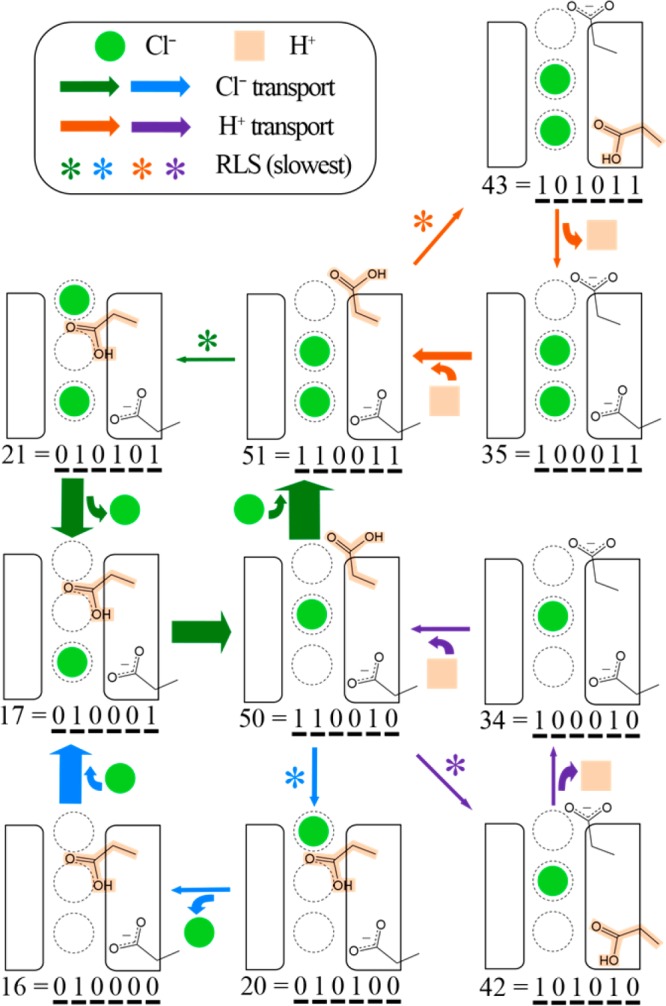
The eight pathways (2 H+ in orange and purple, 2 Cl– in green and green/blue, and 4 combined H+/Cl–) that contribute most to ion transport for the “opposite” orientation, from the same solution set represented in Figure 8.
While each individual transition is reversible, the rates for the forward and backward directions are not equal, and thus the primary ion transport paths differ for the two orientations. Figure 9 shows the eight pathways that dominate flux in the opposite orientation. Here, two pathways (orange and purple) transport one H+, contributing 0.39 and 0.20 ion/ms to the total proton flux, respectively. There are again two pathways that transport one Cl– (green and green/blue), contributing 0.95 and 0.22 ion/ms to the chloride flux, respectively. When combined there are four cycles which exchange one proton and one chloride ion. In both of the proton pathways, a chloride ion consistently resides at Scen, highlighting the key role this Cl– plays in aiding proton transport. The rate limiting step in both pathways is proton transport between E148 and E203, as discussed in our previous work.35 For the Cl– pathways, the rate limiting step is the transition from Scen to Sout. In both paths, E148 is protonated. In this orientation, they differ in the presence or absence of a Cl– at Sint.
Several aspects of the mechanism were consistent in all ten solution sets. In all cases, chloride ion transport was regulated by E148 protonation, which coupled it to pH, and proton transport was aided by the presence of chloride ions. Consistent with mechanisms shown in Figures 8 and 9, E148 was consistently protonated during the rate limiting steps of chloride ion transport from Sout to Scen in the biological orientation, and from Scen to Sout in the opposite orientation. Variation in the Cl– pathways was found in the protonation of E203 and presence of the chloride at Sint. For proton transport for the “opposite” orientation, all 9 solution sets featured Cl– presence at Scen aiding in the rate limiting movement from E148 to E203, which is consistent with our previous work.35 However, for the biological orientation, there was more diversity in the rate limiting step and the role of chloride. Some pathways are consistent and others inconsistent with our previous work, which suggested that proton release from E148 to bulk was rate limiting and aided by the presence of Cl–cen,35 and that transport from E203 to E148 was not rate limiting regardless of the presence or absence of Cl–cen.36 In some solutions, the chloride ion indeed aided in the rate limiting deprotonation of E148 by binding at Scen, while in others it aided in proton transport from E203 to E148 binding at Sout. In a few examples, the rate limiting step was E148 deprotonation in the absence of the central chloride, again emphasizing the range of solutions from the underspecified solution space. As the rate coefficients are determined with more precision and more experimental data is available (e.g., rates and stoichiometries for the two orientations independently), the “correct” solution will be determined—including which of the possible proton transport pathways operate in the biological orientation, and what proportions each pathway contributes to the overall flux.
While no cycle was identified that exchanges exactly two chloride ions for one proton, there is a clear dependence for each ion’s transport on the presence of the opposite ion, controlled by E148 protonation and resulting in “kinetic coupling”. The ease of E148 rotation, required for Cl– transport, is influenced by its protonation state, and the ease of deprotonation is influenced by the presence or absence of Cl– at Scen and Sout. Since the protonation is of course a function of the bulk pH, this kinetic coupling predicts a constant Cl:H exchange ratio across the tested pH range of 4.0 to 7.5. This also explains why the Cl– transport rate so closely matches the equation by Accardi et al. that posited dependence on the pKa of E148.21
Discussion and Conclusions
In this work, we present an MKM based on 68 calculated individual transition rate coefficients from atomistic simulations, optimized within their calculated error based on experimental data, which correctly predicts experimentally measured Cl– transport rates and Cl:H exchange ratios at pH values that were not used in the fitting. In addition to capturing the robust ion exchange ratio across the pH range, the MKM results match the measured chloride ion transport driven by a chloride concentration gradient and also the lack of ion transport in the absence of the concentration gradient. The MKM also predicts properties that have not yet been measured experimentally, and reveals ion pathways (sequences of transitions that define the overall mechanism) through the protein. While researchers have hypothesized that a single, multistep mechanism is followed to produce the consistent Cl:H ratio across a range of pH values,1,6,9,23,24,29 our results show that this robust exchange rate can arise from the kinetic control of multiple pathways, and thus multiple contributing sequences of microstate transitions. Importantly, these results also suggest that no significant conformational change is needed to enforce the exchange ratio. Instead, we found that the exchange rates can be kinetically coupled, and thus the ratio maintained, via residue E148. Its protonation state is naturally coupled to external pH, and controls the ease of E148 rotation coupled with Cl– transport to and from Scen. The pKa of E148 is also affected by the presence of Cl–, which explains the dependence of proton transport on Cl–.
While single sequential molecular-scale mechanisms can provide a seemingly satisfying mechanistic picture of ion exchange, a richer, more complex but physically correct picture arises from understanding the ensemble of transitions between individual states. The MKM presented here is the first, to our knowledge, that accounts for ion exchange in this manner. It is also the first to be experimentally directed, by re-optimizing calculated transition rates within their measured uncertainty, to reproduce experimental data, and then to predict new properties. This type of approach offers a powerful tool to convert molecular-level information into macroscopic observables. As more experimental information is obtained (e.g., fluxes for fixed protein orientations, at different chloride gradients, or with pH gradients), this model can be refined to further limit the number of MKM solutions and pinpoint the dominant mechanism(s).
Finally, our work also suggests a more facile evolutionary link between chloride channels and antiporters in the ClC family; it provides further evidence that the key to exchange is one residue, E148, that could much more easily arise than evolutionary changes manifesting in large conformation changes, such as those seen with “elevator” or “alternating access” mechanisms.4 Thus, this MKM model of ClC-ec1 offers a fascinating case study in emergent observable properties from stochastic kinetic transitions.
Acknowledgments
We thank Professors Christopher Miller of Brandeis University and Alessio Accardi of Cornell University for their invaluable input on this work, and Chris Mayes for programming assistance. The personnel effort in this research was supported by the National Institutes of Health (NIH Grant R01-GM053148). The computational resources in this research were provided by the Extreme Science and Engineering Discovery Environment (XSEDE), which is supported by National Science Foundation grant number ACI-1053575; the U.S. Department of Defense (DOD) High Performance Computing Modernization Program at the Engineer Research and Development Center (ERDC) and Navy DOD Supercomputing Resource Centers; the University of Chicago Research Computing Center (RCC); and the NIH through resources provided by the Computation Institute and the Biological Sciences Division of the University of Chicago and Argonne National Laboratory, under grant 1S10OD018495-01.
Supporting Information Available
The Supporting Information is available free of charge on the ACS Publications website at DOI: 10.1021/jacs.7b11463.
Additional details for the system setup for the MD and BD simulations (PDF)
Author Contributions
# H.B.M. and S.L. contributed equally.
The authors declare no competing financial interest.
Supplementary Material
References
- Accardi A. J. Physiol. 2015, 593, 4129–4138. 10.1113/JP270575. [DOI] [PMC free article] [PubMed] [Google Scholar]
- Jentsch T. J. J. Physiol. 2015, 593, 4091–4109. 10.1113/JP270043. [DOI] [PMC free article] [PubMed] [Google Scholar]
- Jentsch T. J.; Neagoe I.; Scheel O. Curr. Opin. Neurobiol. 2005, 15, 319–325. 10.1016/j.conb.2005.05.002. [DOI] [PubMed] [Google Scholar]
- Ryan R. M.; Vandenberg R. J. Nat. Struct. Mol. Biol. 2016, 23, 187–189. 10.1038/nsmb.3179. [DOI] [PubMed] [Google Scholar]
- Park E.; Campbell E. B.; MacKinnon R. Nature 2017, 541, 500–505. 10.1038/nature20812. [DOI] [PMC free article] [PubMed] [Google Scholar]
- Basilio D.; Noack K.; Picollo A.; Accardi A. Nat. Struct. Mol. Biol. 2014, 21, 456–463. 10.1038/nsmb.2814. [DOI] [PMC free article] [PubMed] [Google Scholar]
- Elvington S. M.; Liu C. W.; Maduke M. C. EMBO J. 2009, 28, 3090–3102. 10.1038/emboj.2009.259. [DOI] [PMC free article] [PubMed] [Google Scholar]
- Abraham S. J.; Cheng R. C.; Chew T. A.; Khantwal C. M.; Liu C. W.; Gong S.; Nakamoto R. K.; Maduke M. J. Biomol. NMR 2015, 61, 209–226. 10.1007/s10858-015-9898-7. [DOI] [PMC free article] [PubMed] [Google Scholar]
- Khantwal C. M.; Abraham S. J.; Han W.; Jiang T.; Chavan T. S.; Cheng R. C.; Elvington S. M.; Liu C. W.; Mathews I. I.; Stein R. A.; Mchaourab H. S.; Tajkhorshid E.; Maduke M. eLife 2016, 5, e11189. 10.7554/eLife.11189. [DOI] [PMC free article] [PubMed] [Google Scholar]
- Bell S. P.; Curran P. K.; Choi S.; Mindell J. A. Biochemistry 2006, 45, 6773–6782. 10.1021/bi0523815. [DOI] [PubMed] [Google Scholar]
- Miloshevsky G. V.; Jordan P. C. Biophys. J. 2004, 86, 825–835. 10.1016/S0006-3495(04)74158-2. [DOI] [PMC free article] [PubMed] [Google Scholar]
- Shi Y. Annu. Rev. Biophys. 2013, 42, 51–72. 10.1146/annurev-biophys-083012-130429. [DOI] [PubMed] [Google Scholar]
- Screpanti E.; Hunte C. J. Struct. Biol. 2007, 159, 261–267. 10.1016/j.jsb.2007.01.011. [DOI] [PubMed] [Google Scholar]
- Dutzler R.; Campbell E. B.; MacKinnon R. Science 2003, 300, 108–112. 10.1126/science.1082708. [DOI] [PubMed] [Google Scholar]
- Lim H. H.; Miller C. J. Gen. Physiol. 2009, 133, 131–138. 10.1085/jgp.200810112. [DOI] [PMC free article] [PubMed] [Google Scholar]
- Lim H. H.; Shane T.; Miller C. PLoS Biol. 2012, 10, e1001441. 10.1371/journal.pbio.1001441. [DOI] [PMC free article] [PubMed] [Google Scholar]
- Walden M.; Accardi A.; Wu F.; Xu C.; Williams C.; Miller C. J. Gen. Physiol. 2007, 129, 317–329. 10.1085/jgp.200709756. [DOI] [PMC free article] [PubMed] [Google Scholar]
- Accardi A.; Miller C. Nature 2004, 427, 803–807. 10.1038/nature02314. [DOI] [PubMed] [Google Scholar]
- Accardi A.; Walden M.; Nguitragool W.; Jayaram H.; Williams C.; Miller C. J. Gen. Physiol. 2005, 126, 563–570. 10.1085/jgp.200509417. [DOI] [PMC free article] [PubMed] [Google Scholar]
- Jayaram H.; Accardi A.; Wu F.; Williams C.; Miller C. Proc. Natl. Acad. Sci. U. S. A. 2008, 105, 11194–11199. 10.1073/pnas.0804503105. [DOI] [PMC free article] [PubMed] [Google Scholar]
- Picollo A.; Xu Y.; Johner N.; Berneche S.; Accardi A. Nat. Struct. Mol. Biol. 2012, 19, 525–531. 10.1038/nsmb.2277. [DOI] [PMC free article] [PubMed] [Google Scholar]
- Feng L.; Campbell E. B.; Hsiung Y.; MacKinnon R. Science 2010, 330, 635–641. 10.1126/science.1195230. [DOI] [PMC free article] [PubMed] [Google Scholar]
- Feng L.; Campbell E. B.; MacKinnon R. Proc. Natl. Acad. Sci. U. S. A. 2012, 109, 11699–11704. 10.1073/pnas.1205764109. [DOI] [PMC free article] [PubMed] [Google Scholar]
- Miller C.; Nguitragool W. Philos. Trans. R. Soc., B 2009, 364, 175–180. 10.1098/rstb.2008.0138. [DOI] [PMC free article] [PubMed] [Google Scholar]
- Matulef K.; Maduke M. Biophys. J. 2005, 89, 1721–1730. 10.1529/biophysj.105.066522. [DOI] [PMC free article] [PubMed] [Google Scholar]
- Howery A. E.; Elvington S.; Abraham S. J.; Choi K.-H.; Dworschak-Simpson S.; Phillips S.; Ryan C. M.; Sanford R. L.; Almqvist J.; Tran K.; Chew T. A.; Zachariae U.; Andersen O. S.; Whitelegge J.; Matulef K.; Du Bois J.; Maduke M. C. Chem. Biol. 2012, 19, 1460–1470. 10.1016/j.chembiol.2012.09.017. [DOI] [PMC free article] [PubMed] [Google Scholar]
- Nguitragool W.; Miller C. J. Mol. Biol. 2006, 362, 682–690. 10.1016/j.jmb.2006.07.006. [DOI] [PubMed] [Google Scholar]
- Accardi A.; Kolmakova-Partensky L.; Williams C.; Miller C. J. Gen. Physiol. 2004, 123, 109–119. 10.1085/jgp.200308935. [DOI] [PMC free article] [PubMed] [Google Scholar]
- Lim H.-H.; Stockbridge R. B.; Miller C. Nat. Chem. Biol. 2013, 9, 721–725. 10.1038/nchembio.1336. [DOI] [PMC free article] [PubMed] [Google Scholar]
- Zdebik A. A.; Zifarelli G.; Bergsdorf E.-Y.; Soliani P.; Scheel O.; Jentsch T. J.; Pusch M. J. Biol. Chem. 2008, 283, 4219–4227. 10.1074/jbc.M708368200. [DOI] [PubMed] [Google Scholar]
- Vien M.; Basilio D.; Leisle L.; Accardi A. J. Gen. Physiol. 2017, 149, 523–529. 10.1085/jgp.201611682. [DOI] [PMC free article] [PubMed] [Google Scholar]
- Chenal C.; Gunner M. R. Biophys. J. 2017, 113, 1025–1036. 10.1016/j.bpj.2017.07.025. [DOI] [PMC free article] [PubMed] [Google Scholar]
- Picollo A.; Malvezzi M.; Houtman J. C.; Accardi A. Nat. Struct. Mol. Biol. 2009, 16, 1294–1301. 10.1038/nsmb.1704. [DOI] [PMC free article] [PubMed] [Google Scholar]
- Robertson J. L.; Kolmakova-Partensky L.; Miller C. Nature 2010, 468, 844–847. 10.1038/nature09556. [DOI] [PMC free article] [PubMed] [Google Scholar]
- Lee S.; Mayes H. B.; Swanson J. M. J.; Voth G. A. J. Am. Chem. Soc. 2016, 138, 14923–14930. 10.1021/jacs.6b06683. [DOI] [PMC free article] [PubMed] [Google Scholar]
- Lee S.; Swanson J. M.; Voth G. A. Biophys. J. 2016, 110, 1334–1345. 10.1016/j.bpj.2016.02.014. [DOI] [PMC free article] [PubMed] [Google Scholar]
- Coalson R. D.; Cheng M. H. J. Phys. Chem. A 2011, 115, 9633–9642. 10.1021/jp200749s. [DOI] [PubMed] [Google Scholar]
- Han W.; Cheng R. C.; Maduke M. C.; Tajkhorshid E. Proc. Natl. Acad. Sci. U. S. A. 2014, 111, 1819–1824. 10.1073/pnas.1317890111. [DOI] [PMC free article] [PubMed] [Google Scholar]
- Jiang T.; Han W.; Maduke M.; Tajkhorshid E. J. Am. Chem. Soc. 2016, 138, 3066–3075. 10.1021/jacs.5b12062. [DOI] [PMC free article] [PubMed] [Google Scholar]
- Pusch M.; Ludewig U.; Jentsch T. J. J. Gen. Physiol. 1997, 109, 105–116. 10.1085/jgp.109.1.105. [DOI] [PMC free article] [PubMed] [Google Scholar]
- Coalson R. D.; Cheng M. H. J. Phys. Chem. B 2010, 114, 1424–1433. 10.1021/jp907965b. [DOI] [PubMed] [Google Scholar]
- Roux B.; Allen T.; Bernèche S.; Im W. Q. Rev. Biophys. 2004, 37, 15–103. 10.1017/S0033583504003968. [DOI] [PubMed] [Google Scholar]
- Fink M.; Noble D. Philos. Trans. R. Soc., A 2009, 367, 2161–2179. 10.1098/rsta.2008.0301. [DOI] [PubMed] [Google Scholar]
- Tveito A.; Lines G. T.; Edwards A. G.; McCulloch A. Math. Biosci. 2016, 277, 126–135. 10.1016/j.mbs.2016.04.011. [DOI] [PMC free article] [PubMed] [Google Scholar]
- Elber R. Q. Rev. Biophys. 2017, 50, e8. 10.1017/S0033583517000063. [DOI] [PubMed] [Google Scholar]
- Anisimov V. M.; Lamoureux G.; Vorobyov I. V.; Huang N.; Roux B.; MacKerell A. D. Jr. J. Chem. Theory Comput. 2005, 1, 153–168. 10.1021/ct049930p. [DOI] [PubMed] [Google Scholar]
- Harder E.; Anisimov V. M.; Vorobyov I. V.; Lopes P. E. M.; Noskov S. Y.; MacKerell A. D. Jr.; Roux B. J. Chem. Theory Comput. 2006, 2, 1587–1597. 10.1021/ct600180x. [DOI] [PubMed] [Google Scholar]
- Chowdhary J.; Harder E.; Lopes P. E. M.; Huang L.; MacKerell A. D. Jr.; Roux B. J. Phys. Chem. B 2013, 117, 9142–9160. 10.1021/jp402860e. [DOI] [PMC free article] [PubMed] [Google Scholar]
- Lamoureux G.; Harder E.; Vorobyov I. V.; Roux B.; MacKerell A. D. Jr. Chem. Phys. Lett. 2006, 418, 245–249. 10.1016/j.cplett.2005.10.135. [DOI] [Google Scholar]
- Yu H.; Whitfield T. W.; Harder E.; Lamoureux G.; Vorobyov I.; Anisimov V. M.; MacKerell A. D. Jr.; Roux B. J. Chem. Theory Comput. 2010, 6, 774–786. 10.1021/ct900576a. [DOI] [PMC free article] [PubMed] [Google Scholar]
- Luo Y.; Jiang W.; Yu H.; MacKerell A. D. jr.; Roux B. Faraday Discuss. 2013, 160, 135–149. 10.1039/C2FD20068F. [DOI] [PMC free article] [PubMed] [Google Scholar]
- Lopes P. E. M.; Huang J.; Shim J.; Luo Y.; Li H.; Roux B.; MacKerell A. D. Jr. J. Chem. Theory Comput. 2013, 9, 5430–5449. 10.1021/ct400781b. [DOI] [PMC free article] [PubMed] [Google Scholar]
- Church J.; Pezeshki S.; Davis C.; Lin H. J. Phys. Chem. B 2013, 117, 16029–16043. 10.1021/jp409306x. [DOI] [PubMed] [Google Scholar]
- Smith M.; Lin H. Chem. Phys. Lett. 2011, 502, 112–117. 10.1016/j.cplett.2010.12.031. [DOI] [Google Scholar]
- Kumar S.; Rosenberg J. M.; Bouzida D.; Swendsen R. H.; Kollman P. A. J. Comput. Chem. 1992, 13, 1011–1021. 10.1002/jcc.540130812. [DOI] [Google Scholar]
- Grossfield A.WHAM: an implementation of the weighted histogram analysis method, ver. 2.0.9.
- van der Walt S.; Colbert S. C.; Varoquaux G. Comput. Sci. Eng. 2011, 13, 22–30. 10.1109/MCSE.2011.37. [DOI] [Google Scholar]
- Fortin F.-A.; De Rainville F. ç.-M.; Gardner M.-A.; Parizeau M.; Gagné C. J. Mach. Learn. Res. 2012, 13, 2171–2175. [Google Scholar]
- Kennedy J.; Eberhart R. C.; Shi Y., The Particle Swarm. In Swarm Intelligence; Morgan Kaufmann: San Francisco, 2001; pp 287–325. [Google Scholar]
- Cheng M. H.; Coalson R. D. Biophys. J. 2012, 102, 1363–1371. 10.1016/j.bpj.2012.01.056. [DOI] [PMC free article] [PubMed] [Google Scholar]
- Krzywinski M.; Schein J.; Birol I.; Connors J.; Gascoyne R.; Horsman D.; Jones S. J.; Marra M. A. Genome Res. 2009, 19, 1639–1645. 10.1101/gr.092759.109. [DOI] [PMC free article] [PubMed] [Google Scholar]
Associated Data
This section collects any data citations, data availability statements, or supplementary materials included in this article.


