Abstract
Objective:
To quantify the biomechanical properties of the bovine periodontal ligament (PDL) in postmortem sections and to apply these properties to study orthodontic tooth intrusion using finite element analysis (FEA). We hypothesized that PDL's property inherited heterogeneous (anatomical dependency) and nonlinear stress-strain behavior that could aid FEA to delineate force vectors with various rectangular archwires.
Materials and Methods:
A dynamic mechanical analyzer was used to quantify the stress-strain behavior of bovine PDL. Uniaxial tension tests using three force levels (0.5, 1, and 3 N) and samples from two anatomical locations (circumferential and longitudinal) were performed to calculate modulus. The Mooney-Rivlin hyperelastic (MRH) model was applied to the experimental data and used in an FEA of orthodontic intrusion rebounded via a 0.45-mm step bend with three archwire configurations of two materials (stainless steel and TMA).
Results:
Force levels and anatomical location were statistically significant in their effects on modulus (P < .05). The apical part had a greater stiffness than did the middle part. The MRH model was found to approximate the experimental data well (r = 0.99), and it demonstrated a reasonable stress-strain outcome within the PDL and bone for FEA intrusion simulation. The force acting on the tooth increased five times from the 0.016 × 0.022-inch TMA to the 0.019 × 0.025-inch stainless steel.
Conclusions:
The PDL is a nonhomogeneous tissue in which the modulus changed in relation to location. PDL nonlinear constitutive model estimated quantitative force vectors for the first time to compare intrusive tooth movement in 3-D space in response to various rectangular archwires.
Keywords: PDL, Tooth movement, Hyperelastic, FEA, Nonlinear, Bovine, Elastic rebound
INTRODUCTION
The dental PDL is the most deformable tissue in the periodontium, and stress-strain within the PDL is the key to orthodontic tooth movement.1–7 The ability to estimate stress-strain levels throughout the PDL would provide valuable information in predicting orthodontic tooth movement as well as understanding its biological implications. It is not possible to obtain this type of information from a patient and, therefore, interest in computer modeling of the PDL to predict tooth movement has increased. These models are accurate only as correct geometry and material properties are used. Currently, material properties used for the PDL are mostly based on linear assumption that has limited reliability of FEA. To date, complete quantification of the nonlinear stress-strain relationship in the PDL is unavailable.
Several studies have characterized the PDL's biomechanical properties.3,6,8–14 In vitro PDL studies report mostly single linear values for Young's Modulus (E) ranging from 1.18 to 6.0 MPa (Table 1).5,8–12 Recently, the bilinear method has allowed for better approximation of the PDL's nonlinearity as it reports two different slope values to represent the early (toe region) and later (linear region) parts of the curve. A constitutive equation that calculates the PDL's stress-strain curve to match experimentally measured stress-strain curves would best represent the PDL's nonlinear behavior. This has been attempted using the Mooney-Rivlin hyperelastic (MRH) model and shown to better represent the PDL's nonlinearity.5,12
Table 1.
Modulus Values Determined from Experimental Data Using Three Different Methods
| Author |
Modulus |
Sample |
Method |
Model |
| Linear | ||||
| Atkinson (1977) | 3.8 MPa | Human | Uniaxial | Linear |
| Mandel (1986) | 3.0 MPa | Human | Extrusion | Linear |
| Pini (2002) | 3.0–6.0 MPa | Bovine | Uniaxial | Linear |
| Bilinear | ||||
| Dorow (2003) | E1 = 0.15 MPa | Porcine | Uniaxial | Bilinear |
| E2 = 5.24 MPa | ||||
| Continuous Nonlinear | ||||
| Natali (2004) | Constitutive equation | Human | Load-displacement | Mooney-Rivlin |
| Qian (2009) | Constitutive equation | Porcine | Intrusion/ extrusion | Mooney-Rivlin |
Over the years, increased numbers of investigators have become interested in matching finite element (FE) model predications with experimental outcomes to determine PDL modulus. Table 2 shows the different methods and modulus values reported for their respective FE models.3,5,6,12,13–17 Early FE models predicting tooth movement contained linear isotropic modulus values for the PDL. Previous linear PDL models for FEA used modulus values ranging from 0.68 to 1750 MPa. Cattaneo used piecewise linear modulus values depending on strain level and whether compression or tension forces were present.19 Although the piecewise linear PDL model provides an improved prediction, a constitutive model with a continuous function to describe the PDL mechanical behavior and validated with uniaxial experimental data is still at the infant stage.
Table 2.
FEM Studies and Their Reported PDL Modulus Values
| Author |
Modulus |
Sample |
Method |
Model |
| Linear | ||||
| Tanne (1998) | 0.68 MPa | Human | Load-displacement | Linear |
| Jones (2001) | 1 MPa | Human | Load-displacement | Linear |
| Canales et al. (2013) | 1.75 GPa | Human | Load-displacement | Linear |
| Piecewise Linear and Bilinear | ||||
| Poppe (2002) | E1 = .05 MPa | Human | Load-displacement | Bilinear |
| E2 = .28 MPa | ||||
| Cattaneo (2005) | <−93% = 8.5 MPa | Human | Load-displacement | Piecewise |
| 0 to −93% = 0.005 MPa | ||||
| 0 to 25% = 0.004 MPa | ||||
| 25 to 50% = 0.44 MPa | ||||
| >50% = 0.032 MPa | ||||
| Qian (2009) | E1 = 0.1 MPa | Porcine | Intrusion/extrusion | Bilinear |
| E2 = 0.8 MPa | ||||
| Dong-Xu (2011) | E1 = 0.04 MPa E2= 0.016 MPa | Human | Load-displacement | Bilinear |
| Continuous Nonlinear | ||||
| Natali (2004) | Constitutive equation | Human | Load-displacement | Mooney-Rivlin |
| Qian (2009) | Constitutive equation | Porcine | Intrusion/ extrusion | Mooney-Rivlin |
Natali et al. and Qian et al. proposed to use the MRH constitutive equation for PDL stress-strain relationship.5,12 The MRH model, derived from strain energy density functions, is a nonlinear elastic model. It allows the PDL to behave as an incompressible rubber material at any load. Unfortunately, none has acquired the PDL data from an isolated sample with uniaxial tensile testing. The validity of the MRH model for PDL characterization and for orthodontic biomechanical simulation remains untested.
The present study used a dynamic mechanical analyzer (DMA) machine (TA Instruments, New Castle, Del), which was designed to study the dynamic properties of polymers. Modulus values calculated from in vitro DMA data were compared to see the effects of anatomic location and force levels. We hypothesized that modulus was dependent upon anatomic location and force levels. The MRH model was applied to fit experimental data and used in an FEA simulation of orthodontic tooth intrusion. The goal of simulation was to compare the force vectors acting on a single tooth with three archwire configurations of two alloys with clinical relevance.
MATERIALS AND METHODS
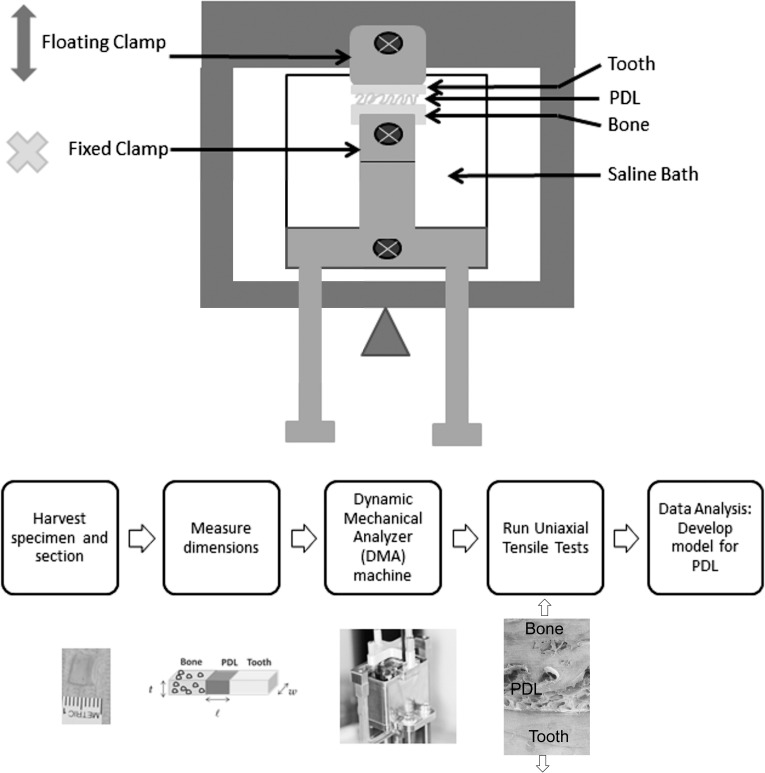
Bovine mandibular incisor PDL samples were used for uniaxial tensile testing. Figure 1 reveals the flow chart of experimental design. Jaws were collected within an hour of slaughter, then the soft tissue was removed from the mandible. Each incisor-bone specimen was sectioned out individually with periodontium intact.
Figure 1.
(Top) Schematic of DMA tests showing the clamps, the sample within the saline bath, and the arm rising upward in uniaxial tension. (Bottom) Flowchart shows experimental procedures including tissue harvest, sample preparation, and testing.
Anatomic effect was investigated in two directions: circumferential and longitudinal. For the circumferential test, midroot cross-sectional cuts were made in 1.4-mm increments. The section was used to produce rectangular samples of approximately 7 × 4 × 1.4 mm. Specimens were stored in saline and frozen until use. Thirty-seven total samples were obtained from two different jaws. For the longitudinal test, midroot and apical cross-sectional cuts were made using the same method in 1.0-mm increments. Sample dimension for this group was approximately 7 × 2 × 1 mm. A total of 52 samples were obtained from four different jaws. Samples were thawed just prior to DMA testing. Dimensions were measured with a micrometer slide (Gaertner Scientific Corp, Skokie, Ill) in order to convert the load-displacement data into stress-strain curves. Figure 1, top, is a schematic for the DMA setup. A custom clamp was fabricated to allow direct clamping of bone and dentin. Uniaxial testing took place in a saline bath to prevent dehydration.
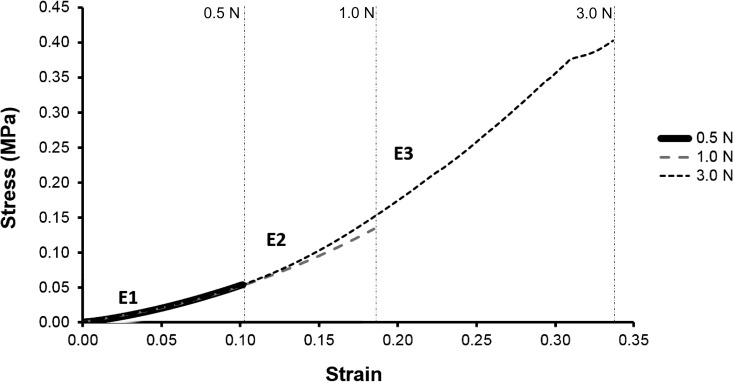
For the circumferential group, each sample was loaded to three specified force levels (0.5, 1.0, and 3.0 N) for 1-minute duration and then unloaded at the same rate, all in a consecutive manner with a 2-minute rest period between each run. Stress-strain loading curves were analyzed for effect of location (mesial, distal, facial, or lingual) and force on modulus. All 0.5-N loading curves were assumed linear and one modulus value (E1) was calculated using the endpoints of the loading curve. For the 1.0-N loading curve, two modulus values (E1, E2) were calculated for 0.0 N–0.5 N and 0.5N–1.0 N, respectively. A similar approach was taken with the 3.0 N data, except that loading curves were segmented into thirds, and three different modulus values (E1, E2, E3) were calculated. Moduli were grouped as E1 (low strain), E2 (intermediate strain), and E3( high strain) (Figure 2). Moduli at different anatomic locations and different force levels were compared using the two-way ANOVA.
Figure 2.
Average stress-strain curves for 0.5 N, 1 N, and 3 N. Vertical lines delineate regions for E1, E2, and E3.
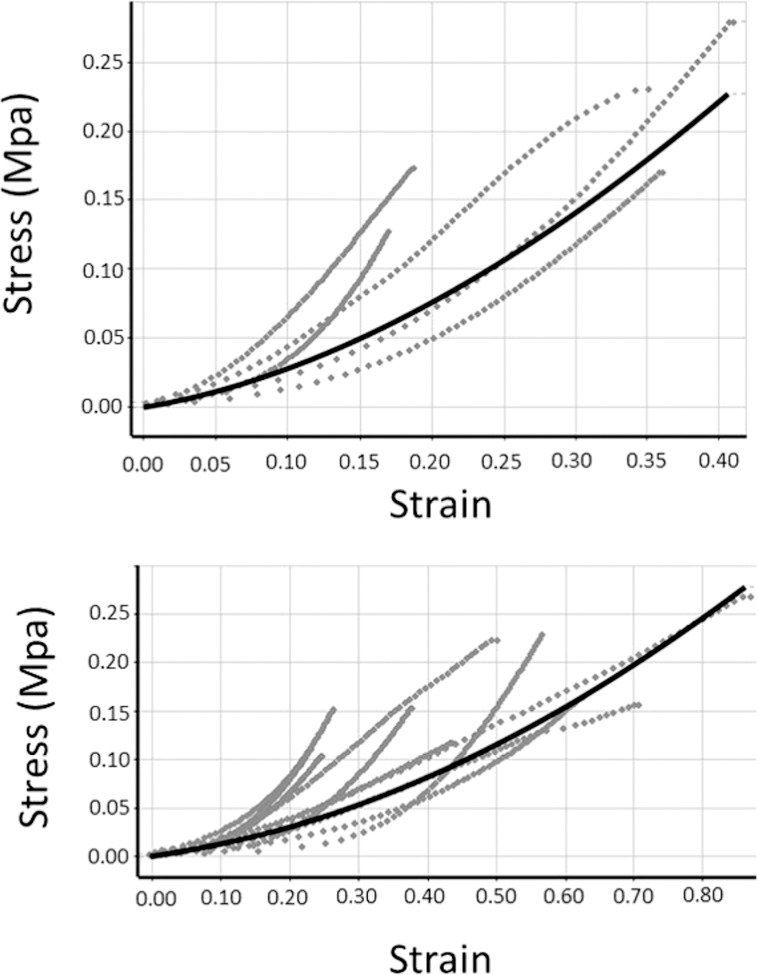
For the longitudinal group, each sample was loaded to 0.5 N for 1-minute duration and then unloaded at the same rate. Data from midroot and apical parts were collected and fitted by the Mooney-Rivlin model separately. Figure 3 illustrates the curve-fitting results. The Mooney-Rivlin hyperelastic model used the following equation to determine constants (The loading curve was selected to curve fit [Figure 3] and constants C01, C10, and C11 [Table 3] were adjusted until the MRH model best fit the experimental data):
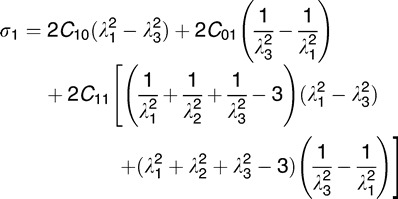 |
where = principal stretch ratio =
 , where ε is the strain value defined as the deformation divided by the original length and σ1 is the experimental stress measured.
Figure 3.
Curve-fitting results of the hyperelastic model of PDL. Solid line represents curve-fitting result. Dotted line represents experimental data. (Top) Apical third of incisor PDL. (Bottom) Middle third of incisor PDL.
Table 3.
Values of MRH Constants Determined From Curve Fit of Experimental Data From Both Groups
| Central incisor |
C
10
|
C
01
|
C
11
|
d
|
| Longitudinal | ||||
| Midroot | 0.0098242 | 0.0044069 | 0.042671 | 0 |
| Apex | 0.26534 | −0.25378 | 0.2342 | 0 |
= material incompressibility parameter
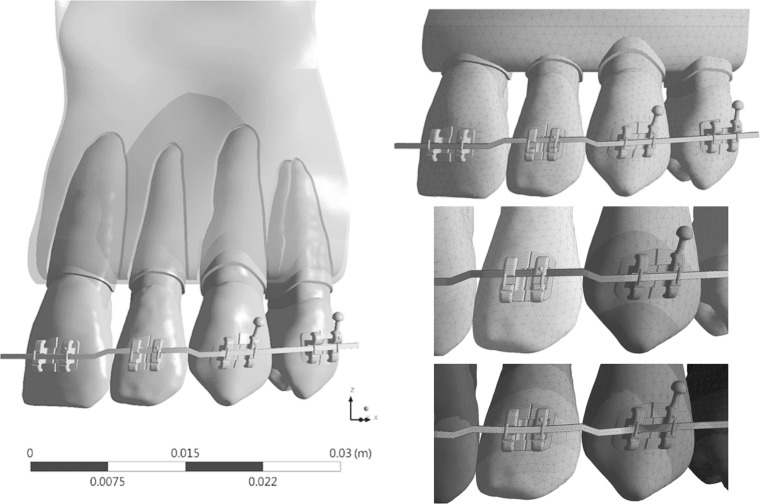
A four-tooth FE model (Figure 4) simulating orthodontic intrusion of a lateral incisor was used to compare the conventional linear PDL model with the nonlinear MRH PDL model. The model used brackets having a 0.022-inch slot, and parametrical studies of three rectangular wires (0.016 × 0.022-, 0.017 × 0.025-, and 0.019 × 0.025-inch) and two metallic materials (stainless steel [SS] and TMA) were analyzed. The interfaces between the wire and the brackets and tooth-tooth interfaces were simulated as contact interface. The unloading of the step bend using birth-death simulation in ANSYS15.0 (ANSYS, Canonsburg, Pa) was described in a previous study by Canales with converged solutions.18 Table 4 shows the material properties used for the present FEM. Deformation, resulting force vector, maximum (tensile), and minimum (compressive) principle stresses and strains were calculated and compared with evaluated differences parametrically.
Figure 4.
(Left) Image of the birth-death FEM model with brackets and an archwire with a 0.45-mm step bend to intrude the lateral incisor. (Top right) Meshed FEM model. (Middle right) Initially, wire is modeled to have a 0.45-mm step bend. (Bottom right) At the end of simulation, wire is inserted in the slot and the lateral incisor is intruded.
Table 4.
Material Properties Proposed for FEM
|
|
Young's Modulus (GPa) |
Poisson's Ratio |
| Enamel | 84.1 | 0.33 |
| Dentin | 18.3 | 0.31 |
| Pulp | 0.002 | 0.45 |
| Periodontal ligament | MRH | 0.45 |
| Lamina dura | 15.0 | 0.33 |
| Cortical bone | 15.0 | 0.30 |
| Cancellous bone | 0.25 | 0.30 |
RESULTS
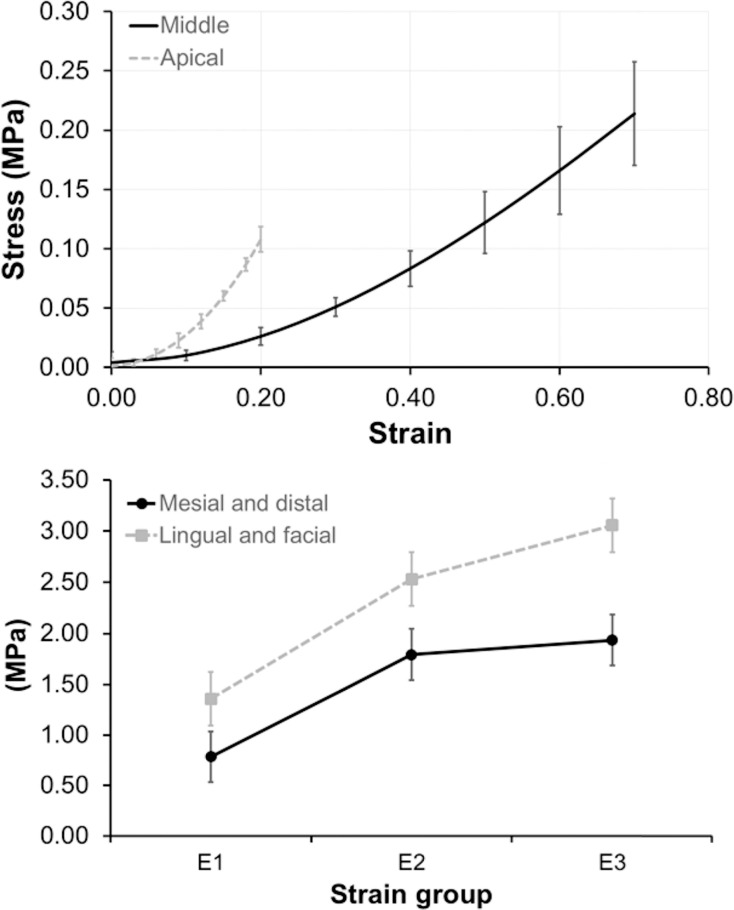
In the circumferential group, mesial and distal samples were combined and compared with combined facial and lingual samples. There were 20 total samples for the facial + lingual group and 17 for the mesial + distal group. E1, E2, and E3 values were compared across the same force group (3.0 N) to determine whether location had any effect on modulus (Table 5). There was a statistically significant difference in means found at E2 (P < .05) and E3 (P < .05) for the two sample groups. Facial and lingual PDLs were consistently stiffer than mesial and distal PDLs (Figure 5). In addition, the modulus change was greater between E1 and E2, and it plateaued between E2 and E3, which suggests nonlinear behavior as discussed previously. There was a statistically significant difference in modulus values (P = .003) between the three force levels using repeated measures ANOVA. The mean modulus did increase with increasing strain rate, which is typical for viscoelastic tissues (Table 6).
Table 5.
Mean Modulus Values (Mpa) Comparing Facial and Lingual Surfaces With Mesial and Distal Surfaces Using a Two-Way ANOVA
|
|
Facial + Lingual Mean ± SDa |
Mesial + Distal Mean ± SD |
Significance |
| E1 | 1.36 ± 0.64 | 0.79 ± 0.47 | NSb |
| E2 | 2.53 ± 1.12 | 1.83 ± 1.12 | *P < .05 |
| E3 | 3.06 ± 1.35 | 2.05 ± 1.6 | *P < .05 |
SD indicates standard deviation.
NS indicates not significant.
Figure 5.
(Top) Apical PDL group (dotted line) had a greater stiffness than did the middle group (solid line). (Bottom) Modulus change is greater at lower strain range (between E1 and E2), than at higher strain range (between E2 and E3). Lingual and facial surfaces (dotted line) were stiffer than mesial and distal surfaces (solid line).
Table 6.
Mean Modulus Values at E1 Region for all Three Force Levels.
|
|
Mean Modulus (MPa) Mean ± SDa |
| 0.5 N | 0.69 ± 0.41 |
| 1.0 N | 0.82 ± 0.48 |
| 3.0 N | 1.10 ± 0.63 |
SD indicates standard deviation.
In the longitudinal group, apical samples were combined and compared with combined middle samples. There are 20 total samples for the apical group and 32 for the middle group. The apical part had a greater stiffness than did the middle part (Figure 5).
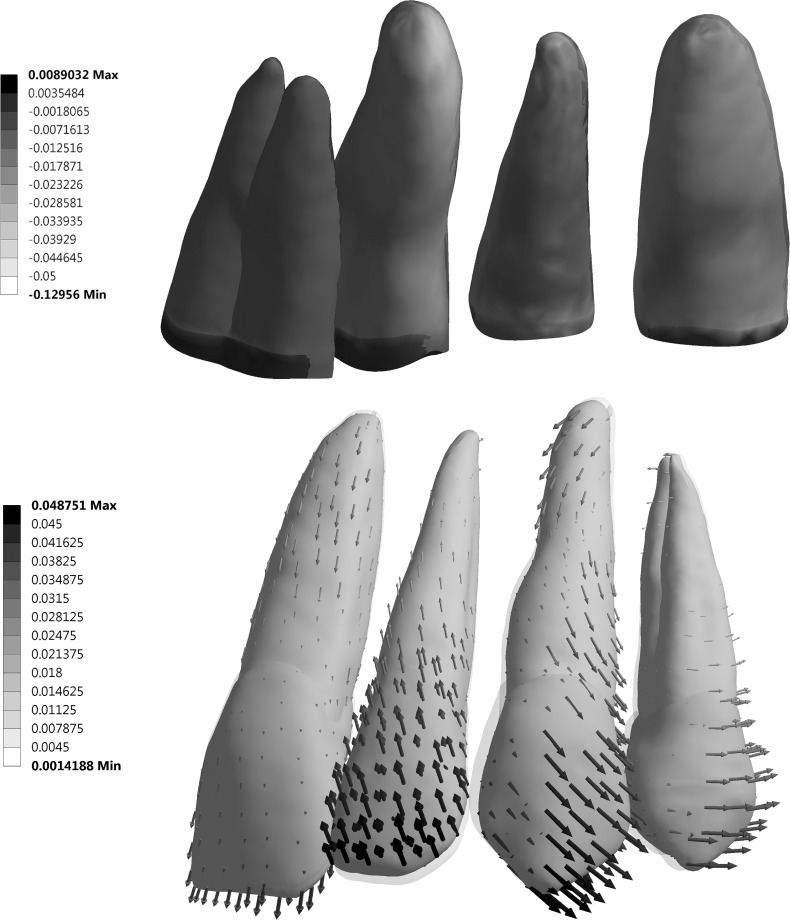
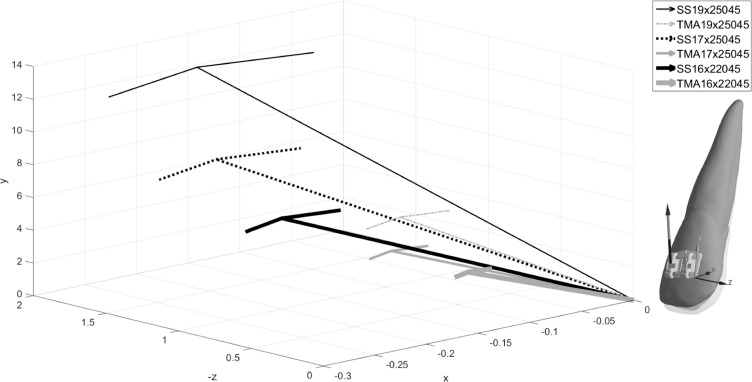
Figure 6 shows distributions of tensile and compressive strains and exaggerated deformation. Outcomes of the MRH FE model revealed an intrusive movement more at the apex along with rotation of the tooth around the center of resistance than that of the previous linear FE model, which showed no intrusion of the apex or facial tipping of the crown.16 The magnitude of force acting on the lateral incisor was a result of elastic rebound from the step bend, which was proportional to the material modulus and wire dimension (Table 7). The forces ranged from 6.0 N to 12.3 N and from 2.4 N to 5.1 N for SS and TMA, respectively. Regardless of materials and wire dimensions, the force vector ran toward the gingival, mesial, and buccal directions (Figure 7).
Figure 6.
(Top) Fringe plot of minimum principal (compressive) strains in PDL from lingual view, showing high compressive strains on tip of lateral incisor PDL. (Bottom) Vector plot of deformation (×20) of the lateral incisor reveals both tipping and intrusion. Shadow represents unformed shape.
Table 7.
Resulting Force (N) Acting on Lateral Incisor for 0.45-mm Intrusive Step Bend (See also Figure 7)
|
|
SS, inches |
TMA, inches |
||||
| 0.016 × 0.022 |
0.017 × 0.025 |
0.019 × 0.025 |
0.016 × 0.022 |
0.017 × 0.025 |
0.019 × 0.025 |
|
| Fx | −0.214 | −0.216 | −0.154 | −0.110 | −0.149 | −0.120 |
| Fy | 5.938 | 8.609 | 12.197 | 2.408 | 3.693 | 5.051 |
| Fz | −0.899 | −1.340 | −1.909 | −0.361 | −0.611 | −0.757 |
| F | 6.010 | 8.715 | 12.347 | 2.438 | 3.746 | 5.109 |
Figure 7.
Resulting force vectors acting on lateral incisor shows general effects of intrusion, flaring (facial movement), and mesial movement. Overall, the TMA yielded lower magnitudes than did the SS.
DISCUSSION
The range of our modulus values (0.69–2.52 MPa) are in close agreement with that of other investigators.9,10,12,14,15 The data suggest PDL nonhomogeneity. The facial and lingual surfaces were stiffer than were the mesial and distal surfaces (58% at E1, 72% at E2, and 67% at E3), and the apical third was stiffer than the middle third; these observations have not been previously reported. As form usually follows function, it would appear to make sense that the faciolingual PDL was stiffer since the faciolingual bone of the mandibular incisors likely receive more loads than does the mesiodistal one because of constraints by the neighboring teeth with the mesiodistal contacts. In our study, the apicocoronal position was recorded and, for the same reason, the apical area is stiffer than midroot, in agreement with other studies.18
The experimental design includes animals that are sacrificed and the bone-PDL-tooth samples obtained postmortem. The vasculature is not maintained, which could affect cell function and fluid replenishment and, in turn, the mechanical properties of the PDL. All references to variable moduli and Poisson's ratio may not reflect an intact PDL, but only its residual structural components in sections of bovine incisors. Additionally, bovine PDL may have different geometric and intrinsic biomechanical properties than human PDL.19 Our data showed proximity of the bovine PDL to human PDL. Fiber orientation may also play a factor in PDL modulus. Future scanning electron microscope and histological images may help investigate the role of fiber orientation in the PDL modulus.
Although it is easier to apply a simple linear elastic model, this assumption is not suitable for the soft tissue, known as a nonlinear material. Based on our data, the stress-strain curve of the PDL was divided into three regions: toe, linear, and steep. When loading of the PDL increased initially, the stiffness E1 of the toe region was low; the linear region was identified after the toe region and had a higher stiffness E2 than did the toe region; then the slope steepened slightly. The transition between each region could not be quantified, yielding an incomplete picture of nonlinear behavior. Furthermore, the viscoelastic model was not suitable for the present study because the experimental results did not collect the time-dependent characteristic of the PDL. Therefore, the hyperelastic model provided a reasonable fit to model the nonlinear behavior of the PDL. Mooney-Rivlin is a hyperelastic isotropic model that has been used to describe the mechanical properties of skin and PDL.20 Our result (data not shown) indicated a great fit of the MRH model and its computational applications.
Differences were found in force levels acting on the lateral incisor, proportional to the modulus ratio (TMA:SS = 1.0:2.5) and the ratio of the moment of inertia (0.016 × 0.022-inch:0.017 × 0.025-inch:0.019 × 0.025-inch = 1.0:1.4:1.9). Our result was consistent with the clinical experience that an intrusive bend could yield tooth flaring. Among our simulations, 0.016 × 0.022-inch TMA and 0.019 × 0.025-inch TMA showed the least flaring while the 0.016 × 0.022-inch TMA yielded the lowest force value. For SS, the 0.019 × 0.025-inch provided better torque control than did the other two archwires. The displacement of the MRH FE model indicates the root apex of the lateral incisor moving in a lingual direction and the coronal part moving facially.
The MRH FE model appeared to predict a much more realistic response to an intrusive force than did the linear elastic model. The PDL of the lateral incisor showed higher compressive (minimum principal) strain levels at the apex where one would expect to see bone resorption. There was also some increased tensile (maximum principal) strain at the linguocoronal aspect, as one might expect. Higher strain levels were found at the apex and coronal aspects of the PDL, which has been supported in previous studies.14 The Frost theory indicates that the typical peak bone strains in healthy adults should range between about 50 microstrains (με)–1500 με.21,22 Our MRH model's tensile strain level of the bone was 170 με, which was within this physiological range. The MRH model makes more physiological sense for predicting clinical tooth movement than does the linear one, although one limitation of our work is the lack of validation of experimental or clinical data. Future study will verify the predictions through clinical data.
According to the study of Iwasaki et al., application of a 60-g retraction force on a canine would generate 13 KPa of stress on its distal root surface, which was calculated based on the estimated area of PDL compression.23 In our FE model simulation of lateral incisor intrusion, the MRH model's peak compressive stress within the PDL was 259 KPa for the 0.016 × 0.022-inch TMA, which was about 20 times as large as the data from the aforementioned study. The reason for that difference may be the fact that our peak stress was concentrated at the root tip rather than averaged at the surface. If the step bend was reduced to 0.2–0.3 mm or we used round, 0.016-inch and 0.018-inch archwires, then the peak stress from simulation would decrease, which requires future investigation. Nevertheless, under current conditions of simulation, the MRH model's stress level within the PDL still appears to be a much more appropriate response to the 0.45-mm intrusive bend than did the 2720 KPa from Canales's linear elastic models, which was 10 times as large as the MRH one.
CONCLUSIONS
The data suggest nonhomogeneity of the PDL structural component in which the faciolingual surfaces were stiffer than were the mesiodistal ones.
The MRH FE model for the nonlinear behavior of the PDL structural component provided an improved outcome for an FEM orthodontic simulation.
The results will contribute, for the first time, to the quantitative force vectors of different rectangular archwires in the torque control of an intrusive bend.
ACKNOWLEDGMENT
Supported by NIH/NIDCR R01DE022816-01.
REFERENCES
- 1.Bourauel C, Freudenreich D, Vollmer D, Kobe D, Drescher D, Jager A. Simulation of orthodontic tooth movements. A comparison of numerical models. J Orofac Orthop. 1999;60:136–151. doi: 10.1007/BF01298963. [DOI] [PubMed] [Google Scholar]
- 2.Brosh T, Machol IH, Vardimon AD. Deformation/recovery cycle of the periodontal ligament in human teeth with single or dual contact points. Arch Oral Biol. 2002;47:85–92. doi: 10.1016/s0003-9969(01)00083-8. [DOI] [PubMed] [Google Scholar]
- 3.Dong-Xu L, Hong-Ning W, Chun-Ling W, Hong L, Ping S, Xiao Y. Modulus of elasticity of human periodontal ligament by optical measurement and numerical simulation. Angle Orthod. 2011;81:229–236. doi: 10.2319/060710-311.1. [DOI] [PMC free article] [PubMed] [Google Scholar]
- 4.Fill TS, Carey JP, Toogood RW, Major PW. Experimentally determined mechanical properties of, and models for, the periodontal ligament: critical review of current literature. Journal of Dental Biomechanics. 2011;2(1) Epub 2011 Apr 5. [DOI] [PMC free article] [PubMed]
- 5.Natali AN, Pavan PG, Scarpa C. Numerical analysis of tooth mobility: formulation of a non-linear constitutive law for the periodontal ligament. Dent Mater. 2004;20:623–629. doi: 10.1016/j.dental.2003.08.003. [DOI] [PubMed] [Google Scholar]
- 6.Poppe M, Bourauel C, Jager A. Determination of the elasticity parameters of the human periodontal ligament and the location of the center of resistance of single-rooted teeth: a study of autopsy specimens and their conversion into finite element models. J Orofac Orthop. 2002;63:358–370. doi: 10.1007/s00056-002-0067-8. [DOI] [PubMed] [Google Scholar]
- 7.Slomka N, Vardimon AD, Gefen A, Pilo R, Bourauel C, Brosh T. Time-related PDL: viscoelastic response during initial orthodontic tooth movement of a tooth with functioning interproximal contact—a mathematical model. J Biomech. 2008;41:1871–1877. doi: 10.1016/j.jbiomech.2008.04.003. [DOI] [PubMed] [Google Scholar]
- 8.Atkinson HF, Ralph WJ. In vitro strength of the human periodontal ligament. J Dent Res. 1977;56:48–52. doi: 10.1177/00220345770560011001. [DOI] [PubMed] [Google Scholar]
- 9.Dorow C, Krstin N, Sander FG. Determination of the mechanical properties of the periodontal ligament in a uniaxial tensional experiment. J Orofac Orthop. 2003;64:100–107. doi: 10.1007/s00056-003-0225-7. [DOI] [PubMed] [Google Scholar]
- 10.Mandel U, Dalgaard P, Viidik A. A biomechanical study of the human periodontal ligament. J Biomech. 1986;19:637–645. doi: 10.1016/0021-9290(86)90169-7. [DOI] [PubMed] [Google Scholar]
- 11.Pini M, Wiskott HWA, Scherrer SS, Botsis J, Belser UC. Mechanical characterization of bovine periodontal ligament. J Periodont Res. 2002;37:237–244. doi: 10.1034/j.1600-0765.2002.00344.x. [DOI] [PubMed] [Google Scholar]
- 12.Qian L, Todo M, Morita Y, Matsushita Y, Koyano K. Deformation analysis of the periodontium considering the viscoelasticity of the periodontal ligament. Dent Mater. 2009;25(10):1285–1292. doi: 10.1016/j.dental.2009.03.014. [DOI] [PubMed] [Google Scholar]
- 13.Rees JS, Jacobsen PH. Elastic modulus of the periodontal ligament. Biomaterials. 1997;18:995–999. doi: 10.1016/s0142-9612(97)00021-5. [DOI] [PubMed] [Google Scholar]
- 14.Tanne K. An evaluation of the biomechanical response of the tooth and periodontium to orthodontic forces in adolescent and adult subjects. J Orthod. 1998;25:109–115. doi: 10.1093/ortho/25.2.109. [DOI] [PubMed] [Google Scholar]
- 15.Jones ML, Hickman J, Middleton J, Knox J, Volp C. A validated finite element method study of orthodontic tooth movement in the human subject. J Orthod. 2001;28:29–38. doi: 10.1093/ortho/28.1.29. [DOI] [PubMed] [Google Scholar]
- 16.Canales C, Larson M, Grauer D, Sheats R, Stevens C, Ko CC. A novel biomechanical model assessing continuous orthodontic archwire activation. Am J Orthod Dentofacial Orthop. 2013;143:281–290. doi: 10.1016/j.ajodo.2012.06.019. [DOI] [PMC free article] [PubMed] [Google Scholar]
- 17.Cattaneo PM, Dalstra M, Melsen B. The finite element method: a tool to study orthodontic tooth movement. J Dent Res. 2005;84:428–433. doi: 10.1177/154405910508400506. [DOI] [PubMed] [Google Scholar]
- 18.Toms SR, Lemons JE, Bartolucci AA, Eberhardt AW. Nonlinear stress-strain behavior of periodontal ligament under orthodontic loading. Am J Orthod Dentofacial Orthop. 2002;122:174–179. doi: 10.1067/mod.2002.124997. [DOI] [PubMed] [Google Scholar]
- 19.Sanctuary CS, Wiskott HW, Justiz J, Botsis J, Belser UC. In vitro time-dependent response of periodontal ligament to mechanical loading. J Appl Physiol. 2005;99:2369–2378. doi: 10.1152/japplphysiol.00486.2005. [DOI] [PubMed] [Google Scholar]
- 20.Delalleau A, Josse G, Lagarde JM, Zahouani H, Bergheau JM. A nonlinear elastic behavior to identify the mechanical parameters of human skin in vivo. Skin Res Technol. 2008;14:152–164. doi: 10.1111/j.1600-0846.2007.00269.x. [DOI] [PubMed] [Google Scholar]
- 21.Frost HM. The mechanostat: a proposed pathogenetic mechanism of osteoporoses and the bone mass effects of mechanical and nonmechanical agents. Bone and Min. 1987;2:73–85. [PubMed] [Google Scholar]
- 22.Frost HM. Wolff's Law and bone's structural adaptations to mechanical usage: an overview for clinicians. Angle Orthod. 1994;64:175–88. doi: 10.1043/0003-3219(1994)064<0175:WLABSA>2.0.CO;2. [DOI] [PubMed] [Google Scholar]
- 23.Iwasaki LR, Haack JE, Nickel JC, Morton J. Human tooth movement in response to continuous stress of low magnitude. Am J Orthod Dentofacial Orthop. 2000;117:175–183. doi: 10.1016/s0889-5406(00)70229-0. [DOI] [PubMed] [Google Scholar]


