Abstract.
High-dimensional imaging features extracted from diagnostic imaging, called radiomics, are increasingly reported for diagnosis, prognosis, and response to therapy. Establishing the sensitivity of radiomic features to variation in scan protocols is necessary because acquisition and reconstruction parameters can vary widely across and within institutions. Our objective was to assess the reproducibility of radiomic features derived from computed tomography (CT) images by varying tube current (mA), noise index, and reconstruction [adaptive statistical iterative reconstruction (ASiR)], parameters increasingly varied by institutions seeking to reduce radiation dose in their patients. We extracted radiomic features from CT images of a uniform water phantom, anthropomorphic phantom, and a human scan. Scans were acquired from the phantoms with six tube currents (50, 100, 200, 300, 400, and 500 mA) and five noise index levels (12, 14, 16, 18, and 20), respectively. Scans of the phantoms and patient were reconstructed from 0% ASiR (i.e., filtered back projection) to 100% ASiR in increments of 10%. Two hundred and forty-eight well-known radiomic features were extracted from all scans. The concordance correlation coefficient was used to assess agreement of features. Our analysis suggests that image acquisition parameters (tube current, noise index) as well as the reconstruction technique strongly influence radiomic feature reproducibility and demonstrate a subset of reproducible features potentially usable in clinical practice.
Keywords: reproducibility, quantitative imaging, texture analysis, computed tomography, dose reduction
1. Introduction
Improvements in the resolution of diagnostic imaging over a decade ago have created an abundance of retrospectively available images that contain information, which can be capitalized upon to create predictive treatment algorithms. Radiomics, the high-throughput extraction of imaging features from high-resolution images, has opened up new possibilities for the diagnosis, staging, and treatment stratification of patients with malignant pathologies.1–3 Extracting additional information from routine imaging is an attractive opportunity for clinicians looking for low-cost, objective, and noninvasive biomarkers for personalized cancer treatment. With respect to the liver, for example, publications have emerged linking quantitative imaging features to clinicopathological and outcome variables in single institution retrospective series.4–12 While clinically promising, the successful clinical implementation of radiomics as a trusted biomarker requires reproducibility experiments studying the effect of varying image acquisition and reconstruction parameters on imaging features.
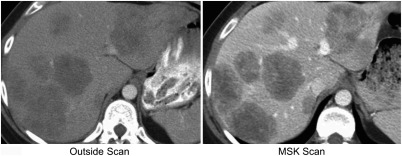
Establishing the repeatability and reproducibility of radiomic features is necessary since computed tomography (CT) scan acquisition and reconstruction parameters can not only vary widely across institutions, but also within an institution, as protocol standardization is clinically challenging. Figure 1 shows an example of a portal venous phase CT scan of the liver acquired of the same patient at two institutions, 10 days apart. Despite the fact that attenuation (brightness) differences are observable in these images, little attention has been paid to the effect that imaging protocol variation has on radiomic features. In CT phantom studies, differences in slice thickness and reconstruction algorithm (standard versus lung) significantly influenced radiomic features.13 Recent work on reproducibility of features extracted from lung CT has demonstrated a subset of reproducible, informative, and nonredundant radiomic features in the presence of scan protocol differences2,14–19 with similar findings observed for bone CT applications.20 However, lung cancers, contrary to liver cancers, are surrounded by air and imaged without intravenous contrast. Thus, liver-specific studies based on contrast-enhanced CT are needed to determine reproducibility for clinical use. Motivated by a study demonstrating the effect of slice thickness variation on radiomic feature performance assessed across noncontrast, arterial, and portal venous phases in liver CT,21 further study is warranted.
Fig. 1.
Comparison of imaging protocol differences: portal venous phase CT acquired of the same patient 10 days apart.
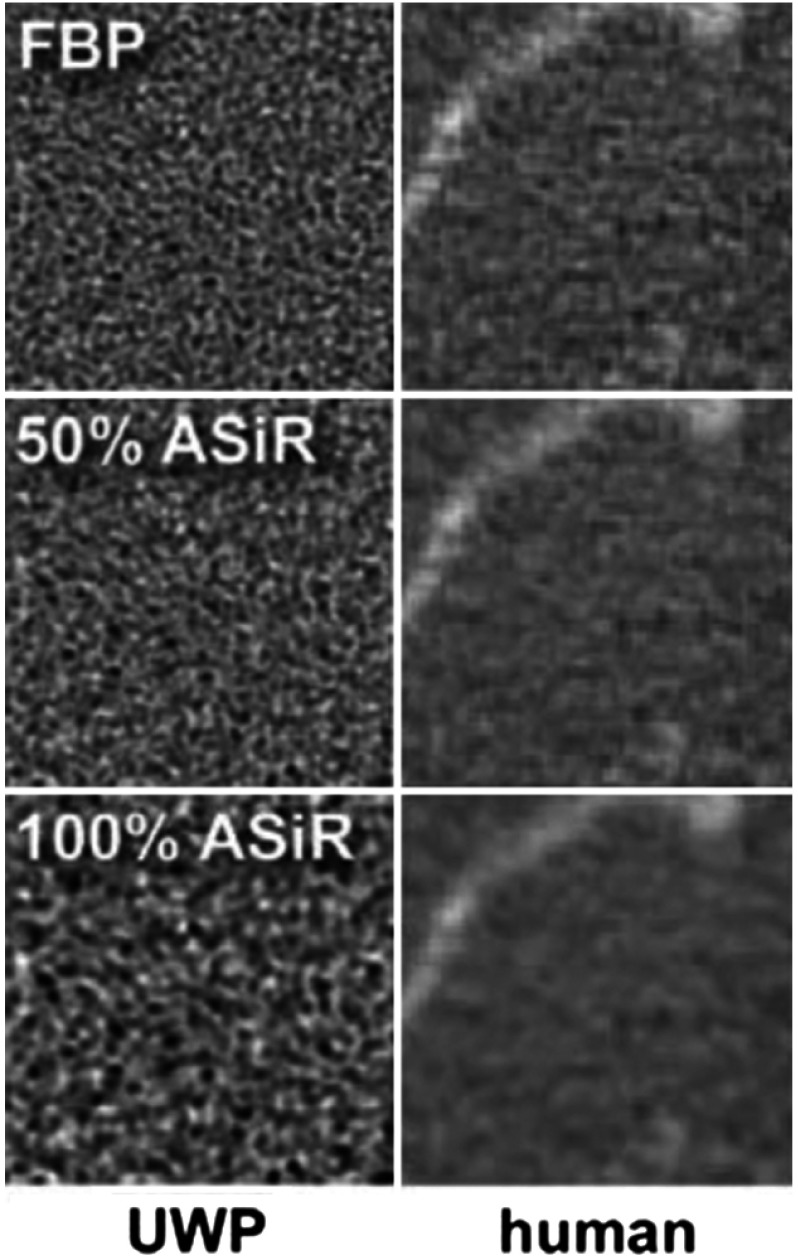
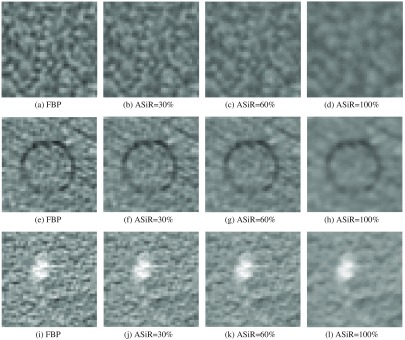
Adaptive statistical iterative reconstruction (ASiR™, GE Healthcare, Waukesha, Wisconsin) is a noise reduction-based reconstruction algorithm introduced for CT in 2008. ASiR iteratively refines each pixel value measured with filtered back projection (FBP) to an idealized estimate, predicted by noise modeling.22 It is implemented in discrete levels by adjusting the percentage of ASiR blended with the FBP reconstruction of the image, which enables the user to control overall magnitude of noise in the image. Recent studies showed the degradation of spatial resolution due to ASiR,23 which affects radiographic performance.24,25 In addition, the amount of radiation dose has an effect on CT appearance; reduction of dose increases noise, which affects observers’ performance in disease detection.26,27 Automated tube current modulation along the -axis optimizes the radiation dose to the patient while attempting to maintain a predetermined noise level throughout the scan volume. The noise level within the scan volume is determined by an operator preset noise index. The effect of ASiR on volumetric tumor measurements was recently assessed using a phantom (with known dimensions) designed to mimic the tissue properties of liver in imaging.28 Lower contrast of the lesion relative to the background parenchyma with increasing ASiR contributed to variability in volumetric measurements; however, the effect of ASiR on radiomic features is unknown. Figure 2 demonstrates the increase in blurring effect due to gradual increase in ASiR from 0% (pure FBP) to 100% ASiR in exemplar phantom and human scans.
Fig. 2.
Changes in the appearance of image texture with increasing ASiR.
Although CT-based imaging features have been shown to be promising prognostic biomarkers for clinical use, the robustness of these features on systems equipped with iterative reconstruction algorithms and automated tube current modulation is unknown. Understanding the variability of radiomic features is necessary to use radiomics in clinical practice. Solomon et al.29 investigated the effect of radiation dose and reconstruction algorithm on imaging features derived from gray-level co-occurrence matrices (GLCM) and intensity histograms. Therefore, the present study aimed to determine the sensitivity of radiomic features to modulating tube currents, variable noise index, and reconstruction algorithms with many more imaging features commonly described in the quantitative imaging literature. We sought to perform a controlled study with phantoms and a human scan to motivate future prospective assessment. We chose to investigate the effect of tube current, noise index, and ASiR on imaging features, parameters increasingly varied by institutions looking to reduce radiation dose to their patients.
2. Materials and Methods
2.1. Image Data Sources
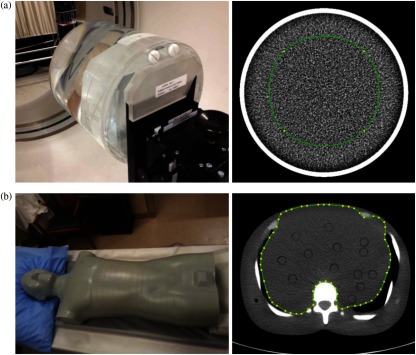
A uniform water phantom (UWP, GE Healthcare, Waukesha, Wisconsin) for CT image quality control and an adult-sized anthropomorphic dosimetry verification phantom (ATOM phantoms, CIRS, Norfolk, Virginia) were employed for the study. The UWP was attached to the end of the CT table and the anthropomorphic phantom was positioned similar to clinical scanning (Fig. 3). The UWP is made of acrylic and filled with water, whereas the anthropomorphic phantom consists of five simulated tissue types including the liver. The tissue types are engineered to produce photon attenuation values within 1% of those for real tissues for the bone and the soft tissue substitutes, and 3% for the lung tissue substitute over the range of 30 to 20,000 keV.30 Phantoms were employed so that we could systemically vary tube current and noise index, requiring multiple scans, which would be difficult to justify in patients due to the added radiation dose. A single abdominal CT scan of a patient was also included in the study so that we could study the effect of reconstruction parameters in a clinical setting.
Fig. 3.
Phantoms used in study: (a) uniform water phantom and (b) anthropomorphic phantom reconstructed with FBP. Regions of interest included in analysis are outlined in green.
2.2. CT Scan Acquisition and Reconstruction
All CT scans were acquired using a GE 64 slice multidetector scanner (GE Healthcare, Waukesha, Wisconsin) using the parameters listed in Table 1. The UWP scans were acquired at six different fixed tube currents: 50, 100, 200, 300, 400, and 500 mA, respectively. The anthropomorphic phantom was scanned at five noise index (NI) levels (12, 14, 16, 18, and 20). Modulating tube current values in the range [61 to 69], [99 to 104], [70 to 79], [52 to 63], and [42 to 49] were recorded from the DICOM header of the anthropomorphic phantom scans for NI 12, 14, 16, 18, and 20, respectively. A second data acquisition verified that the values increased at NI 14 indicating unexpected behavior not controlled in the experiment. A contrast-enhanced patient CT obtained as part of routine clinical management was also included. The CT image was acquired following the administration of 150-mL iodinated contrast (Omnipaque 300, GE Healthcare, New Jersey) at with noise index of 14. CT reconstruction was performed with FBP and ASiR on all images. All images were reconstructed from FBP (0% ASiR) to 100% ASiR in increments of 10%. FBP is the most widely used reconstruction algorithm; hence, it was considered the gold standard reference image set in this study. The choice to vary mA, noise index, and ASiR was made based on our clinical experience that these acquisition and reconstruction parameters often vary across different institutions. At our cancer center, we tend to use lower noise indices than at outpatient CT facilities, for example, and apply lower ASiR levels. The wide variability in specific mA values investigated in this study may be greater than those used clinically (most sites use 100 to 300 mA) but included here for completeness. However, the choice of NI reflects clinical conditions at our institution.
Table 1.
CT acquisition and reconstruction parameters.
| Parameter | UWP | Anthropomorphic phantom | Human |
|---|---|---|---|
| GE model | Discovery 750 | Discovery 750 HD | Discovery 750 HD |
| Detector rows | 64 | 64 | 64 |
| Scan mode | Helical | Helical | Helical |
| kVp | 120 | 120 | 120 |
| Display field of view (cm) | 25 | 40 | 50 |
| Filter type | HEAD | BODY | BODY |
| Convolutional Kernel | STANDARD | STANDARD | STANDARD |
| Axial pixel size (mm) | 0.48 | 0.78 | 0.87 |
| Slice thickness (mm) | 5 | 5 | 5 |
| Focal spot size (cm) | 0.7 | 1.2 | 0.7 |
2.3. Image Segmentation
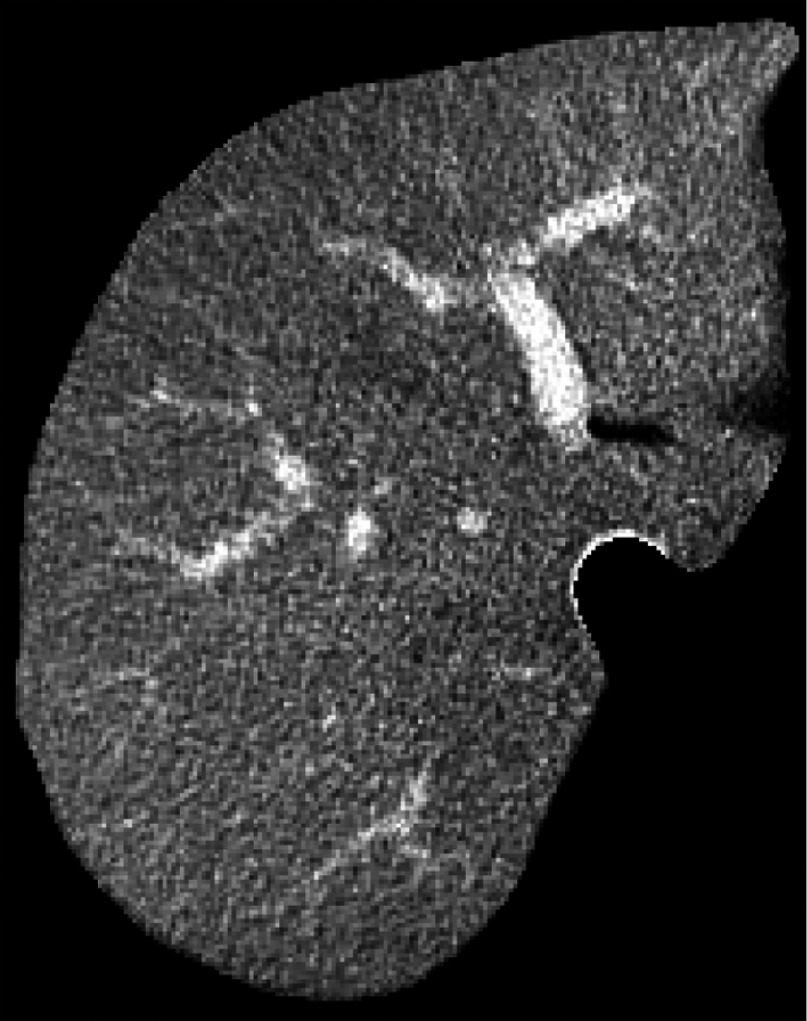
All images were subject to preprocessing prior to radiomic feature extraction. The central portion of the UWP and the anthropomorphic phantom were manually segmented using Scout Liver (Analogic Corporation, Peabody, Massachusetts) (Fig. 3). The image mask was propagated to all other scans such that all scans had the same segmentation applied. This was possible because the position of the phantoms remained fixed in the imaging unit for every scan. For the human scan, the liver region was semiautomatically segmented from the CT scan using Scout Liver (Fig. 4).
Fig. 4.
Segmented liver region from human CT reconstructed with FBP used in analysis.
2.4. Extraction of Radiomic Features
For each of the segmented regions of interest, we extracted standard radiomic features that broadly describe variation in CT enhancement patterns (i.e., heterogeneity), which are well described in the image processing literature. Briefly, these features can be categorized as first-order features based on the intensity histogram and second-order texture-based features based on spatial variation in pixel intensity. Intensity histogram (IH) features included mean, standard deviation, skewness, kurtosis, and entropy. Texture features included GLCM, run-length matrices (RLM), local binary patterns (LBP), fractal dimension analysis (FD), and angle co-occurrence matrices (ACM).31–41 Radiomic features are listed in Table 2.
Table 2.
Image features set investigated in this study.
| A. GLCM (19 features) | … | 2. A12 (Contrast) |
| 1. G1 (Energy) | 59. L59 (Frequency of 58th bin of ULBP) | 3. A13 (Correlation) |
| 2. G2 (Contrast) | 60. L60 (Frequency of 0th bin of RI-LBP) | 4. A14 (Sum of squares) |
| 3. G3 (Correlation) | 61. L61 (Frequency of 1st bin of RI-LBP) | 5. A15 (Inverse difference moment) |
| 4. G4 (Sum of squares) | … | 6. A16 (Sum average) |
| 5. G5 (Inverse difference moment) | 69. L69 (Frequency of 9th bin of RI-LBP) | 7. A17 (Sum variance) |
| 6. G6 (Sum average) | 70. L70 (Standard deviation (SD) of ULBP) | 8. A18 (Entropy) |
| 7. G7 (Sum variance) | 71. L71 (Skewness of ULBP) | 9. A19 (Difference variance) |
| 8. G8 (Entropy) | 72. L72 (Kurtosis of ULBP) | 10. A110 (Sum entropy) |
| 9. G9 (Difference variance) | 73. L73 (Entropy of RI-ULBP) | 11. A111 (Difference entropy) |
| 10. G10 (Sum entropy) | 74. L74 (SD of RI-ULBP) | 12. A112 (Information-theoretic |
| 11. G11 (Difference entropy) | 75. L75 (Skewness of RI-ULBP) | measures of correlation 1) |
| 12. G12 (Information-theoretic measures of correlation 1) | 76. L76 (Kurtosis of RI-ULBP) | 13. A113 (Information-theoretic measures of correlation 2) |
| 13. G13 (Information-theoretic measures of correlation 2) | 77. L77 (Entropy of RI-ULBP) | |
| 14. G14 (Maximum correlation coefficient) | 78. L78 (SD of LBP) | 14. A114 (Maximum correlation coefficient) |
| 15. G15 (Inertia) | 79. L79 (Skewness of LBP) | 15. A115 (Inertia) |
| 16. G16 (Cluster shade) | 80. L80 (Kurtosis of LBP) | 16. A116 (Cluster shade) |
| 17. G17 (Cluster prominence) | 81. L81 (Entropy of LBP) | 17. A117 (Cluster prominence) |
| 18. G18 (Renyi entropy) | 82. L82 (SD of RI-LBP) | 18. A118 (Renyi entropy) |
| 19. G19 (Tsallis entropy) | 83. L83 (Skewness of RI-LBP) | 19. A119 (Tsallis entropy) |
| B. RLM (11 features) | 84. L84 (Kurtosis of RI-LBP) | G. ACM2 (19 features) |
| 1. R1 (Short run emphasis) | 85. L85 (Entropy of RI-LBP) | 1. A21 (Energy) |
| 2. R2 (Long run emphasis) | 86. L86 (SD of rotated LBP) | 2. A22 (Contrast) |
| 3. R3 (Gray-level nonuniformity) | 87. L87 (Skewness of LBP) | 3. A23 (Correlation) |
| 4. R4 (Run length nonuniformity) | 88. L88 (Kurtosis of LBP) | 4. A24 (Sum of squares) |
| 5. R5 (Run percentage) | 89. L89 (Entropy of LBP) | 5. A25 (Inverse difference moment) |
| 6. R6 (Low gray-level run emphasis) | 90. L90 (0th frequency coefficient of RI-ULBP Fourier spectrum | 6. A26 (Sum average) |
| 7. R7 (High gray-level run emphasis) | … | 7. A27 (Sum variance) |
| 8. R8 (Short run low gray-level emphasis) | 127. L127 (37th frequency coefficient of RI-ULBP Fourier Spectrum | 8. A28 (Entropy) |
| 9. R9 (Short run high gray-level emphasis) | E. FD (48 features) | 9. A29 (Difference variance) |
| 10. R10 (Run low gray-level emphasis) | 1. F1 (FD from 1st binary image from SFTA | 10. A210 (Sum entropy) |
| 11. R11 (Long run high gray-level emphasis) | … | 11. A211 (Difference entropy) |
| C. IH (5 features) | 16. F16 (FD from 16th binary image from SFTA | 12. A212 (Information-theoretic measures of correlation 1) |
| 1. I1 (Mean) | 17. F17 (Mean gray value from 1st binary image from SFTA) | |
| 2. I2 (Standard deviation) | … | 13. A213 (Information-theoretic measures of correlation 2) |
| 3. I3 (Skewness) | 32. F32 (Mean gray value from 16th binary image from SFTA) | 14. A214 (Maximum correlation coefficient) |
| 4. I4 (Kurtosis) | 33. F33 (Pixel count from 1st binary image from SFTA) | 15. A215 (Inertia) |
| 5. Entropy | … | 16. A216 (Cluster shade) |
| D. LBP (127 features) | 48. F48 (Pixel count from 16th binary image from SFTA) | 17. A217 (Cluster prominence) |
| 1. L1 (Frequency of 0th bin of ULBP) | F. ACM1 (19 features) | 18. A218 (Renyi entropy) |
| 2. L2 (Frequency of 1st bin of ULBP) | 1. A11 (Energy) | 19. A219 (Tsallis entropy) |
In total, 248 features were extracted using MATLAB (MathWorks, Natick, Massachusetts). Averaging the feature values over all slices yielded one value for each feature for each image.
2.5. Statistical Analysis
First the effect of tube current (or noise index) on radiomic features was investigated by varying the tube current (or noise index) for a specific reconstruction method. We then studied the effect of reconstruction method on radiomic features by keeping the acquisition parameters constant. When assessing the agreement in radiomic features with reconstruction algorithms (i.e., different ASiR levels), the FBP dataset was used as the reference set.
Lin’s concordance correlation coefficient (CCC),42 a measure of concordance or agreement between two measurements, was used to determine sensitivity of features to variations in image noise, tube current, and reconstruction method. CCC ranges from 0 to 1 (correlated), with perfect agreement at 1. CCC is defined as
| (1) |
where is a vector containing the value of a particular feature for all cases in the first observation and is a vector containing the value of the same radiomic feature in the second observation; and are the variances; and and are the means of each vector. When assessing the agreement in radiomic features with reconstruction algorithms, the FBP dataset was used as the reference set. We defined features with an absolute as being reproducible.43 We also report the features with and 0.95. Statistical analysis was performed with MATLAB.
3. Results
3.1. Effect of Tube Current and Noise Index on Radiomic Features
The number and percentage of reproducible radiomic features () extracted from the UWP while varying the tube currents (50 versus 100 mA, 200 versus 300 mA, 400 versus 500 mA, 100 versus 400 mA, 100 versus 500 mA, and 200 versus 500 mA) are listed in Table 3. In general, variation in tube current had substantial effect on CCC with only 20 (8%) and 44 (18%) reproducible radiomic features for 50 versus 100 mA and 200 versus 300 mA, respectively. This is likely because lower tube current is associated with more random noise, which results in increased pixel-by-pixel intensity variability. With increased tube current (400 versus 500 mA), 63 (25%) of the radiomic features were reproducible suggesting that increased tube current (and corresponding reduction in random noise) results in an increase in the uniformly distributed pixels. The number and percentage of reproducible radiomic features extracted from the anthropomorphic phantom while varying the noise indices (NI 12 versus 14, NI 14 versus 16, NI 16 versus 18, NI 12 versus 18, NI 12 versus 20, and NI 14 versus 20) are listed in Table 4. In general, change in noise indices, resulted in variation in the number of reproducible features: 49 (20%), 62 (25%), and 47 (19%) of radiomics features were reproducible for NI 12 versus 14, NI 14 versus 16, and NI 16 versus 18, respectively.
Table 3.
Total number (percentage) of reproducible features out of 248 radiomic features for UWP with FBP reconstruction.
| 50 versus 100 mA | 200 versus 300 mA | 400 versus 500 mA | 100 versus 400 mA | 100 versus 500 mA | 200 versus 500 mA | |
|---|---|---|---|---|---|---|
| 13 (5) | 26 (10) | 27 (11) | 7 (3) | 7 (3) | 11 (4) | |
| 20 (8) | 44 (18) | 63 (25) | 18 (7) | 10 (4) | 17 (7) | |
| 25 (10) | 58 (23) | 74 (30) | 24 (10) | 12 (5) | 18 (7) |
Table 4.
Total number (percentage) of reproducible features out of 248 radiomic features for anthropomorphic phantom with FBP reconstruction.
| NI 12 versus 14 | NI 14 versus 16 | NI 16 versus 18 | NI 12 versus 18 | NI 12 versus 20 | NI 14 versus 20 | |
|---|---|---|---|---|---|---|
| 34 (14) | 56 (23) | 30 (12) | 29 (12) | 31 (13) | 35 (14) | |
| 49 (20) | 62 (25) | 47 (19) | 43 (17) | 40 (16) | 53 (21) | |
| 57 (23) | 69 (28) | 53 (21) | 54 (22) | 53 (21) | 61 (25) |
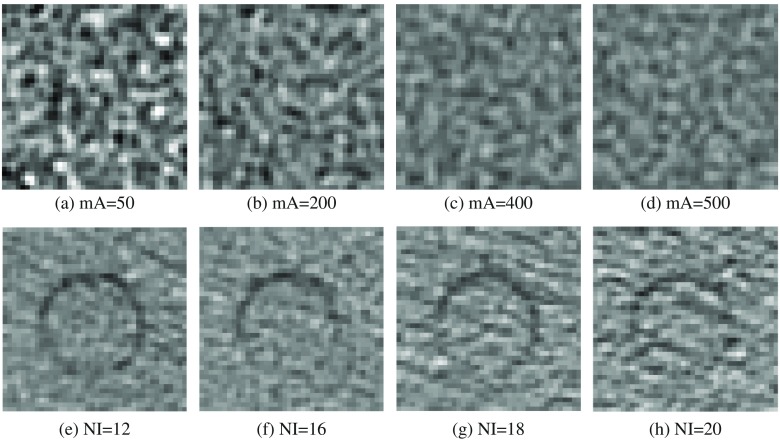
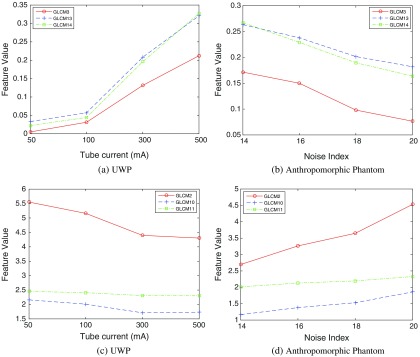
The changes in appearance of image texture with varying mA and NI are shown in Fig. 5. We also note that values of radiomic features change approximately linearly with increased ASiR. Select exemplar GLCM features for the UWP and anthropomorphic phantom are shown in Fig. 6.
Fig. 5.
CT pixel pattern appearance variation with increasing (a)–(d) tube current and (e)–(h) noise index in the UWP and anthropomorphic phantom, respectively. The circle in the anthropomorphic phantom is a rod designed to hold dosimeter.
Fig. 6.
Change in radiomic feature values over different NI and mA.
3.2. Effect of Reconstruction Algorithm on Radiomic Features
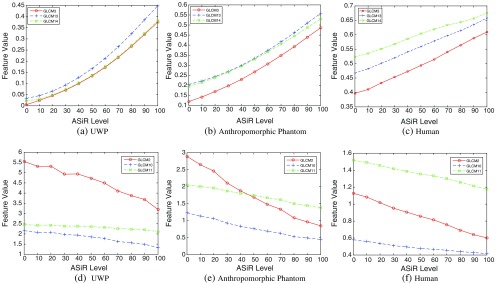
The number and percentage of reproducible radiomic features extracted from the UWP, anthropomorphic phantom, and human scan for increasing ASiR levels are listed in Table 5. In all three datasets, the number of reproducible features decreased with increasing ASiR with respect to FBP. Figure 7 demonstrates the increase in blurring due to gradual increase in ASiR from 0% (pure FBP) to 100% ASiR in all three datasets. We also note that values of radiomic features change approximately linearly with increased ASiR. Selected GLCM features for all three datasets are shown in Fig. 8.
Table 5.
Total number (percentage) of reproducible features out of 248 features for UWP, anthropomorphic phantom, and human for different ASiR levels. Feature values are averaged all over tube currents and noise indices for the UWP and anthropomorphic phantom, respectively.
| ASiR | UWP | Anthropomorphic phantom | Human | ||||||
|---|---|---|---|---|---|---|---|---|---|
| 10 | 115 (46) | 96 (39) | 60 (24) | 232 (94) | 223 (90) | 197 (79) | 230 (93) | 219 (88) | 193 (78) |
| 20 | 110 (44) | 81 (33) | 45 (18) | 227 (92) | 217 (88) | 185 (75) | 222 (90) | 209 (84) | 183 (74) |
| 30 | 100 (40) | 78 (31) | 45 (18) | 218 (88) | 197 (79) | 164 (66) | 213 (86) | 193 (78) | 156 (63) |
| 40 | 97 (39) | 75 (30) | 45 (18) | 208 (84) | 180 (73) | 148 (60) | 209 (84) | 183 (74) | 145 (58) |
| 50 | 82 (33) | 63 (25) | 40 (16) | 200 (81) | 174 (70) | 144 (58) | 186 (75) | 161 (65) | 124 (50) |
| 60 | 81 (33) | 60 (24) | 34 (14) | 185 (75) | 165 (67) | 133 (54) | 166 (67) | 145 (58) | 107 (43) |
| 70 | 72 (29) | 50 (20) | 32 (13) | 177 (71) | 155 (63) | 127 (51) | 153 (62) | 134 (54) | 94 (38) |
| 80 | 55 (22) | 44 (18) | 27(11) | 162 (65) | 144 (58) | 122 (49) | 141 (57) | 117 (47) | 73 (29) |
| 90 | 51 (21) | 32 (13) | 26 (10) | 158 (64) | 140 (56) | 107 (43) | 131 (53) | 110 (44) | 58 (23) |
| 100 | 47 (19) | 29 (12) | 26 (10) | 152 (61) | 128 (52) | 102 (41) | 119 (48) | 95 (38) | 47 (19) |
Fig. 7.
CT pixel pattern appearance variation with increasing ASiR levels in (a)–(d) UWP, (e)–(h) anthropomorphic phantom, and (i)–(l) human scan, respectively.
Fig. 8.
Change in radiomic feature values over different ASiR levels.
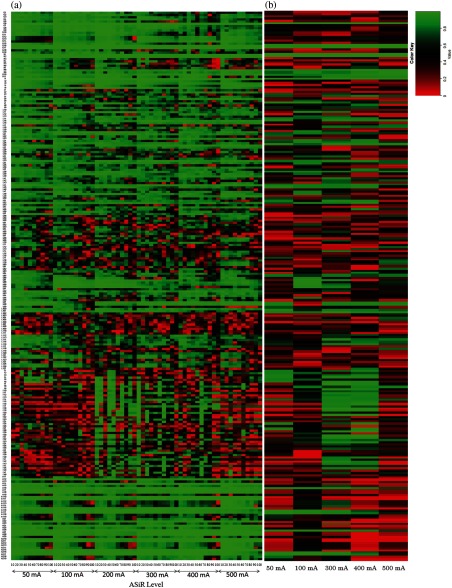
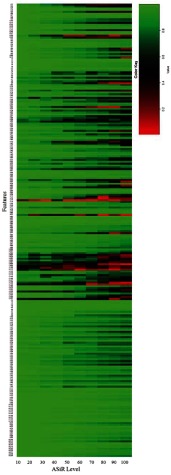
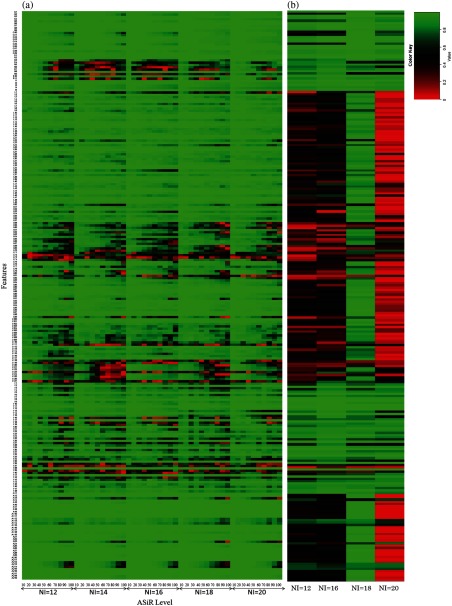
CCC calculated between FBP and increasing ASiR levels from 10% to 100% for all radiomic features extracted from UWP, anthropomorphic phantom, and human are provided in Figs. 9–11, respectively, at different tube currents and NI, as available. Specifically, in Fig. 9, the -axis is partitioned into the available tube currents and within each tube current; the CCC for each ASiR level relative to FBP is shown. Similarly, in Fig. 10, the -axis is partitioned into the available noise indices and within each noise index; the CCC for each ASiR level relative to FBP is shown. In Fig. 11, CCC for each ASiR level is shown since we did not vary the noise index or tube current in the human scan.
Fig. 9.
Effect of tube current and ASiR level on radiomic features extracted from UWP. (a) The -axis is partitioned into the available tube currents and within each tube current; the CCC for each ASiR level relative to FBP is calculated. (b) CCC is calculated for each mA with and FBP reconstruction as the reference standard.
Fig. 11.
Effect of the ASiR level on radiomic features extracted from the human scan such that the CCC for each ASiR level relative to FBP is calculated.
Fig. 10.
Effect of tube current and ASiR level on radiomic features extracted from anthropomorphic phantom. (a) The -axis is partitioned into the available noise indices and within each noise index; the CCC for each ASiR level relative to FBP is calculated. (b) CCC is calculated for each NI with and FBP reconstruction as the reference standard.
3.3. Reproducible Radiomic Features
The specific radiomic features with for different image acquisition and reconstruction parameters are listed in Table 6. In general, reproducibility of radiomic features was influenced by acquisition parameters (noise index and tube current) more so than ASiR. Studying the effect of variation in noise index and tube current requires multiple scans, which would expose patients to additional radiation. Therefore, we studied these variations in phantoms to motivate prospective evaluation in a clinical trial with patient consent.
Table 6.
Reproducible features ().
| UWP | Anthropomorphic phantom | Human | |||||
|---|---|---|---|---|---|---|---|
| All mA (FBP) | All ASiR (500 mA) | All NI (FBP) | All ASiR (NI 12) | All ASiR | |||
| 1. G6 | 1. G6 | 1. G3 | 1. G1 | 51. LBP44 | 101. ACM12 | 1. G3 | 51. FD2 |
| 2. G16 | 2. G14 | 2. G6 | 2. G3 | 52. LBP45 | 102. ACM14 | 2. G4 | 52. FD3 |
| 3. G17 | 3. G16 | 3. G8 | 3. G4 | 53. LBP46 | 103. ACM15 | 3. G6 | 53. FD4 |
| 4. RLM1 | 4. G17 | 4. G12 | 4. G5 | 54. LBP47 | 104. ACM16 | 4. G7 | 54. FD5 |
| 5. RLM2 | 5. RLM1 | 5. G13 | 5. G6 | 55. LBP48 | 105. ACM17 | 5. G8 | 55. FD6 |
| 6. RLM8 | 6. RLM2 | 6. G14 | 6. G7 | 56. LBP49 | 106. ACM18 | 6. G13 | 56. FD8 |
| 7. RLM9 | 7. RLM8 | 7. G16 | 7. G8 | 57. LBP52 | 107. ACM19 | 7. G14 | 57. FD11 |
| 8. RLM10 | 8. RLM9 | 8. G17 | 8. G9 | 58. LBP54 | 108. ACM110 | 8. G16 | 58. FD17 |
| 9. IH1 | 9. RLM10 | 9. G18 | 9. G12 | 59. LBP55 | 109. ACM111 | 9. G17 | 59. FD20 |
| 10. LBP5 | 10. IH1 | 10. RLM1 | 10. G13 | 60. LBP56 | 110. ACM115 | 10. RLM1 | 60. FD23 |
| 11. IH3 | 11. RLM2 | 11. G14 | 61. LBP57 | 111. ACM116 | 11. RLM2 | 61. FD26 | |
| 12. IH4 | 12. RLM7 | 12. G16 | 62. LBP78 | 112. ACM117 | 12. RLM3 | 62. FD29 | |
| 13. LBP5 | 13. RLM8 | 13. G17 | 63. LBP84 | 113. ACM118 | 13. RLM4 | 63. FD37 | |
| 14. LBP15 | 14. RLM10 | 14. G18 | 64. LBP86 | 114. ACM119 | 14. RLM5 | 64. FD38 | |
| 15. LBP16 | 15. RLM11 | 15. G19 | 65. LBP87 | 115. ACM21 | 15. IH1 | 65. FD41 | |
| 16. LBP26 | 16. IH1 | 16. RLM1 | 66. LBP88 | 116. ACM22 | 16. IH2 | 66. FD44 | |
| 17. LBP33 | 17. IH3 | 17. RLM2 | 67. LBP89 | 117. ACM24 | 17. IH3 | 67. FD47 | |
| 18. LBP40 | 18. FD2 | 18. RLM8 | 68. LBP92 | 118. ACM25 | 18. IH4 | 68. ACM11 | |
| 19. LBP44 | 19. FD5 | 19. IH1 | 69. LBP93 | 119. ACM26 | 19. IH5 | 69. ACM12 | |
| 20. LBP49 | 20. FD7 | 20. IH2 | 70. LBP94 | 120. ACM27 | 20. LBP1 | 70. ACM13 | |
| 21. LBP97 | 21. FD8 | 21. IH3 | 71. LBP95 | 121. ACM28 | 21. LBP2 | 71. ACM14 | |
| 22. LBP98 | 22. FD9 | 22. IH5 | 72. LBP96 | 122. ACM29 | 22. LBP11 | 72. ACM15 | |
| 23. FD2 | 23. FD10 | 23. LBP | 73. LBP97 | 123. ACM210 | 23. LBP12 | 73. ACM16 | |
| 24. ACM12 | 24. FD11 | 24. LBP7 | 74. LBP98 | 124. ACM211 | 24. LBP16 | 74. ACM18 | |
| 25. ACM14 | 25. FD12 | 25. LBP10 | 75. LBP100 | 125. ACM215 | 25. LBP20 | 75. ACM19 | |
| 26. ACM15 | 26. FD14 | 26. LBP11 | 76. LBP101 | 126. ACM216 | 26. LBP39 | 76. ACM110 | |
| 27. ACM16 | 27. FD16 | 27. LBP12 | 77. LBP112 | 127. ACM217 | 27. LBP44 | 77. ACM111 | |
| 28. ACM17 | 28. FD17 | 28. LBP13 | 78. LBP113 | 128. ACM218 | 28. LBP47 | 78. ACM112 | |
| 29. ACM18 | 29. FD18 | 29. LBP14 | 79. LBP117 | 129. ACM219 | 29. LBP48 | 79. ACM113 | |
| 30. ACM110 | 30. FD21 | 30. LBP15 | 80. FD1 | 30. LBP57 | 80. ACM114 | ||
| 31. ACM111 | 31. FD26 | 31. LBP16 | 81. FD5 | 31. LBP58 | 81. ACM115 | ||
| 32. ACM115 | 32. FD28 | 32. LBP17 | 82. FD8 | 32. LBP59 | 82. ACM116 | ||
| 33. ACM22 | 33. FD29 | 33. LBP18 | 83. FD10 | 33. LBP60 | 83. ACM117 | ||
| 34. ACM24 | 34. FD31 | 34. LBP19 | 84. FD11 | 34. LBP64 | 84. ACM118 | ||
| 35. ACM25 | 35. FD32 | 35. LBP20 | 85. FD14 | 35. LBP67 | 85. ACM119 | ||
| 36. ACM26 | 36. FD35 | 36. LBP21 | 86. FD17 | 36. LBP68 | 86. ACM23 | ||
| 37. ACM27 | 37. FD38 | 37. LBP23 | 87. FD20 | 37. LBP69 | 87. ACM24 | ||
| 38. ACM28 | 38. FD41 | 38. LBP25 | 88. FD23 | 38. LBP76 | 88. ACM25 | ||
| 39. ACM210 | 39. FD44 | 39. LBP26 | 89. FD24 | 39. LBP78 | 89. ACM26 | ||
| 40. ACM211 | 40. FD45 | 40. LBP27 | 90. FD26 | 40. LBP79 | 90. ACM28 | ||
| 41. ACM215 | 41. LBP28 | 91. FD29 | 41. LBP80 | 91. ACM212 | |||
| 42. ACM218 | 42. LBP33 | 92. FD31 | 42. LBP82 | 92. ACM213 | |||
| 43. LBP34 | 93. FD32 | 43. LBP83 | 93. ACM214 | ||||
| 44. LBP36 | 94. FD35 | 44. LBP84 | 94. ACM216 | ||||
| 45. LBP37 | 95. FD38 | 45. LBP85 | 95. ACM217 | ||||
| 46. LBP38 | 96. FD41 | 46. LBP86 | |||||
| 47. LBP39 | 97. FD44 | 47. LBP92 | |||||
| 48. LBP40 | 98. FD47 | 48. LBP93 | |||||
| 49. LBP42 | 99. FD48 | 49. LBP94 | |||||
| 50. LBP43 | 100. ACM11 | 50. FD1 | |||||
4. Discussion
We approached our reproducibility study with the intention of varying NI, ASiR, and mA as it is increasingly common for institutions to set goals for dose reduction, to prevent unnecessary radiation to their patients. Dose reduction may be achieved by increasing the noise index or by applying different types of tube current modulation, which subsequently affect mA. As the noise levels increase with decreasing dose, it is also common for institutions to apply ASiR or other reconstruction methods to varying degrees to improve image quality. The concern with dose reduction, combined with the observed variability in clinical practice across institutions, motivated our approach to investigate these specific imaging parameters, within the constraints of our clinical GE CT scanners.
Our data suggest that image acquisition parameters relating to image noise [tube current, noise index, and reconstruction (ASiR)] strongly influence radiomic feature reproducibility (see Tables 3–5). Random noise in CT images affects the pixel-by-pixel intensity variability, thereby influencing the reproducibility of features that are based on the spatial distribution of pixel intensities. An increase in the tube current reduces the image noise, resulting in more reproducible radiomic features. For example, only 20 reproducible features (8% of all features) were observed when features extracted at 50 mA were compared with the same features extracted at 100 mA, whereas 63 features (25%) were reproducible when the comparison was performed between 400 and 500 mA. Increased ASiR led to blurring, resulting in fewer reproducible features when compared with FBP (the reference standard). 219 (88%), 161 (65%), and 95 (38%) features were reproducible at 10%, 50%, and 100% ASiR, respectively. ASiR initially uses information obtained from the FBP algorithm to initiate image reconstruction and focuses on noise reduction primarily through statistical modeling of the system. The statistical model transforms the measured value of each pixel to a new estimate of the pixel value. The new estimate is then compared against the ideal pixel value that the noise model predicts. The process iterates until the final estimated and ideal pixel values converge.22 This modification of the pixel-by-pixel values likely explains the poor concordance observed between features extracted from images with increasing ASiR application. These results are supported by a recent study comparing GLCM and IH features obtained from FBP, 50% ASiR, and model-based iterative reconstruction images.29 Our institution uses 20% ASiR in imaging protocols, but this value varies widely across institutions;44 hence, care should be taken in the extraction of radiomic features for prognostication in the presence of variable scan protocols.
The UWP is filled with uniform material (i.e., water), but the reconstructed CT images are not perfectly uniform in terms of intensity values. The reconstructed CT images of the UWP have random noise without any texture due to the absence of structures. It should also be noted that in Figs. 8(a)–8(c), GLCM homogeneity-based features (e.g., correlation) have the lowest values for UWP due to greater local random noise present in the UWP images. However, with increasing ASiR, as images became smoother, the homogeneity features values gradually increased for (a), (b), and (c). The GLCM features shown in Figs. 8(d)–8(f) represent heterogeneity (e.g., entropy), and demonstrate higher values in more locally heterogeneous images.
We evaluated the reproducibility of 248 radiomic features. Many of the first-order intensity histogram-based features (features I1 to I5 in Figs. 9–11) were reproducible as ASiR maintains the mean and standard deviation of the image histogram by definition. GLCM (G1 to G19) and RLM features (R1 to R11) were consistently reproducible with increasing ASiR; however, concordance decreased with extreme ASiR application. RLM features count consecutive pixels with the same intensity so large variation in pixel intensity will have significant effect. LBP and FD features (L1 to L127 and F1 to F48, respectively) encode structural texture information; increased blurring with increased ASiR will affect spatial distribution of pixel intensities so LBP and FD features were less reproducible than GLCM features. ACM-based features (A11 to A119 and A21 to A219) were robust to variation in ASiR. ACM features are likely less sensitive to image noise because these features are computed using gradient magnitude and orientation information instead of spatial distribution of pixel intensities. With respect to modulations in tube current, few features showed robustness to large changes in mA (Fig. 9); however, for smaller modulations, FD, GLCM, and RLM-based features were robust (Fig. 10) suggesting that care should be taken when comparing features derived from CT scans with vastly different tube currents. Figures 9 and 10 show CCC variation with different image acquisition and reconstruction parameters. Noise index (tube current) affects reproducibility of features more so than ASiR variation. Figure 6 shows feature values over different acquisition conditions for a single patient. Therefore, it is difficult to relate Figs. 9 and 10 to Fig. 6.
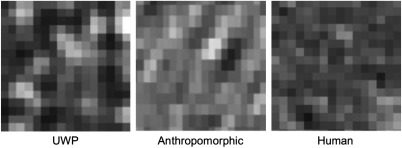
There are several limitations to this study. First, studies evaluating the effects of modulation of tube current and noise index on radiomic features require additional scans; hence, phantoms were employed. However, the UWP is circular, filled with liquid water and not representative of patient anatomy. To address this issue, we used an anthropomorphic phantom, but when compared with actual patient anatomy, the phantom images are uniform in content, without organs and without artifacts observed during patient image acquisition procedures. Both phantoms lack texture in imaging (see Fig. 12), underscoring the need for phantoms that mimic the tissue properties of contrast-enhanced abdominal CT. Although we included one human scan reconstructed with increasing ASiR, prospective evaluation in patients with multiple tube currents or NI levels is required. Second, radiomic features were analyzed on the basis of one segmented region of interest. Different segmentation strategies employed by various studies can affect the quantification of radiomic features and their reproducibility. Another limitation of this study was that only GE scanners were used. Hence, only variability with one manufacturer’s reconstruction algorithms and automatic exposure control modes was studied. Other acquisition parameters such as helical pitch and contrast timing likely affect the reproducibility of features. Future work includes prospective evaluation in liver cancer patients with scans acquired at variable NI and with different reconstruction algorithms and contrast timings. Reproducibility of individual radiomic features as well as prediction model variability will be studied. Despite these limitations, our findings underscore the influence of noise on radiomic features and demonstrate reproducible features potentially usable for clinical decision making.
Fig. 12.
Magnified regions from the UWP, anthropomorphic phantom, and human scans demonstrating lack of textural appearance in the phantoms versus the human scan.
5. Conclusion
The present study demonstrates that image noise plays an important role in the reproducibility of radiomic features. Specifically, variation in image noise due to dose reduction algorithms, tube current, and noise index significantly affects reproducibility of radiomic features. Prospective evaluation across multiple centers, preferably with human subjects, is needed.
Acknowledgments
This research was funded in part through the NIH/NCI Cancer Center Support Grant No. P30 CA008748.
Biography
Biographies for the authors are not available.
Disclosures
The authors have nothing to disclose.
References
- 1.Aerts H. J. W. L., et al. , “Decoding tumour phenotype by noninvasive imaging using a quantitative radiomics approach,” Nat. Commun. 5, 4006 (2014).https://doi.org/10.1038/ncomms5006 [DOI] [PMC free article] [PubMed] [Google Scholar]
- 2.Kumar V., et al. , “Radiomics: the process and the challenges,” Magn. Reson. Imaging 30(9), 1234–1248 (2012).https://doi.org/10.1016/j.mri.2012.06.010 [DOI] [PMC free article] [PubMed] [Google Scholar]
- 3.Lambin P., et al. , “Radiomics: extracting more information from medical images using advanced feature analysis,” Eur. J. Cancer 48(4), 441–446 (2012).https://doi.org/10.1016/j.ejca.2011.11.036 [DOI] [PMC free article] [PubMed] [Google Scholar]
- 4.Ganeshan B., et al. , “Dynamic contrast-enhanced texture analysis of the liver,” Invest. Radiol. 46(3), 160–168 (2011).https://doi.org/10.1097/RLI.0b013e3181f8e8a2 [DOI] [PubMed] [Google Scholar]
- 5.Lubner M. G., et al. , “CT textural analysis of hepatic metastatic colorectal cancer: pre-treatment tumor heterogeneity correlates with pathology and clinical outcomes,” Abdom. Imaging 40(7), 2331–2337 (2015).https://doi.org/10.1007/s00261-015-0438-4 [DOI] [PubMed] [Google Scholar]
- 6.Miles K. A., et al. , “Colorectal cancer: texture analysis of portal phase hepatic CT images as a potential marker of survival,” Radiology 250(2), 444–452 (2009).https://doi.org/10.1148/radiol.2502071879 [DOI] [PubMed] [Google Scholar]
- 7.Rao S.-X., et al. , “CT texture analysis in colorectal liver metastases: a better way than size and volume measurements to assess response to chemotherapy?” United Eur. Gastroenterol. J. 4(2), 257–263 (2016).https://doi.org/10.1177/2050640615601603 [DOI] [PMC free article] [PubMed] [Google Scholar]
- 8.Rao S.-X., et al. , “Whole-liver CT texture analysis in colorectal cancer: does the presence of liver metastases affect the texture of the remaining liver?” United Eur. Gastroenterol. J. 2(6), 530–538 (2014).https://doi.org/10.1177/2050640614552463 [DOI] [PMC free article] [PubMed] [Google Scholar]
- 9.Simpson A. L., et al. , “Texture analysis of preoperative CT images for prediction of postoperative hepatic insufficiency: a preliminary study,” J. Am. Coll. Surg. 220(3), 339–346 (2015).https://doi.org/10.1016/j.jamcollsurg.2014.11.027 [DOI] [PMC free article] [PubMed] [Google Scholar]
- 10.Simpson A. L., et al. , “Computed tomography image texture: a noninvasive prognostic marker of hepatic recurrence after hepatectomy for metastatic colorectal cancer,” Ann. Surg. Oncol. 24, 2482–2490 (2017).https://doi.org/10.1245/s10434-017-5896-1 [DOI] [PMC free article] [PubMed] [Google Scholar]
- 11.Wu Z., et al. , “Hepatitis C related chronic liver cirrhosis: feasibility of texture analysis of MR images for classification of fibrosis stage and necroinflammatory activity grade,” PloS One 10(3), e0118297 (2015).https://doi.org/10.1371/journal.pone.0118297 [DOI] [PMC free article] [PubMed] [Google Scholar]
- 12.Zheng J., et al. , “Preoperative prediction of microvascular invasion in hepatocellular carcinoma using quantitative image analysis,” J. Am. Coll. Surg. 19, S48 (2017).https://doi.org/10.1016/j.hpb.2017.02.035 [DOI] [PMC free article] [PubMed] [Google Scholar]
- 13.Zhao B., et al. , “Exploring variability in CT characterization of tumors: a preliminary phantom study,” Transl. Oncol. 7, 88–93 (2014).https://doi.org/10.1593/tlo.13865 [DOI] [PMC free article] [PubMed] [Google Scholar]
- 14.Balagurunathan Y., et al. , “Reproducibility and prognosis of quantitative features extracted from CT images,” Transl. Oncol. 7(1), 72–87 (2014).https://doi.org/10.1593/tlo.13844 [DOI] [PMC free article] [PubMed] [Google Scholar]
- 15.Fave X., et al. , “Can radiomics features be reproducibly measured from CBCT images for patients with non-small cell lung cancer?” Med. Phys. 42, 6784–6797 (2015).https://doi.org/10.1118/1.4934826 [DOI] [PMC free article] [PubMed] [Google Scholar]
- 16.Hunter L. A., et al. , “High quality machine-robust image features: identification in nonsmall cell lung cancer computed tomography images,” Med. Phys. 40(12), 121916 (2013).https://doi.org/10.1118/1.4829514 [DOI] [PMC free article] [PubMed] [Google Scholar]
- 17.Lo P., et al. , “Variability in CT lung-nodule quantification: effects of dose reduction and reconstruction methods on density and texture based features,” Med. Phys. 43, 4854–4865 (2016).https://doi.org/10.1118/1.4954845 [DOI] [PMC free article] [PubMed] [Google Scholar]
- 18.Lu L., et al. , “Assessing agreement between radiomic features computed for multiple CT imaging settings,” PLoS One 11, e0166550 (2016).https://doi.org/10.1371/journal.pone.0166550 [DOI] [PMC free article] [PubMed] [Google Scholar]
- 19.Zhao B., et al. , “Reproducibility of radiomics for deciphering tumor phenotype with imaging,” Sci. Rep. 6, 23428 (2016).https://doi.org/10.1038/srep23428 [DOI] [PMC free article] [PubMed] [Google Scholar]
- 20.Guggenbuhl P., et al. , “Reproducibility of CT-based bone texture parameters of cancellous calf bone samples: influence of slice thickness,” Eur. J. Radiol. 67, 514–520 (2008).https://doi.org/10.1016/j.ejrad.2007.08.003 [DOI] [PubMed] [Google Scholar]
- 21.Duda D., Kretowski M., Bezy-Wendling J., “Effect of slice thickness on texture-based classification of liver dynamic CT scans,” Lect. Notes Comput. Sci. 8104, 96–107 (2013).https://doi.org/10.1007/978-3-642-40925-7 [Google Scholar]
- 22.Geyer L. L., et al. , “State of the art: iterative CT reconstruction techniques,” Radiology 276(2), 339–357 (2015).https://doi.org/10.1148/radiol.2015132766 [DOI] [PubMed] [Google Scholar]
- 23.McCollough C. H., et al. , “Degradation of CT low-contrast spatial resolution due to the use of iterative reconstruction and reduced dose levels,” Radiology 276, 499–506 (2015).https://doi.org/10.1148/radiol.15142047 [DOI] [PMC free article] [PubMed] [Google Scholar]
- 24.Saiprasad G., et al. , “Evaluation of low-contrast detectability of iterative reconstruction across multiple institutions, CT scanner manufacturers, and radiation exposure levels,” Radiology 277, 124–133 (2015).https://doi.org/10.1148/radiol.2015141260 [DOI] [PubMed] [Google Scholar]
- 25.Shin C.-I., et al. , “Ultra-low peak voltage CT colonography: effect of iterative reconstruction algorithms on performance of radiologists who use anthropomorphic colonic phantoms,” Radiology 273(3), 759–771 (2014).https://doi.org/10.1148/radiol.14140192 [DOI] [PubMed] [Google Scholar]
- 26.Fletcher J. G., et al. , “Observer performance in the detection and classification of malignant hepatic nodules and masses with CT image-space denoising and iterative reconstruction,” Radiology 276, 465–478 (2015).https://doi.org/10.1148/radiol.2015141991 [DOI] [PMC free article] [PubMed] [Google Scholar]
- 27.Padole A., et al. , “Assessment of filtered back projection, adaptive statistical, and model-based iterative reconstruction for reduced dose abdominal computed tomography,” J. Comput. Assisted Tomogr. 39(4), 462–467 (2015).https://doi.org/10.1097/RCT.0000000000000231 [DOI] [PubMed] [Google Scholar]
- 28.Li Q., et al. , “The effects of iterative reconstruction in CT on low-contrast liver lesion volumetry: a phantom study,” Proc. SPIE 10134, 101340Z (2017).https://doi.org/10.1117/12.2255743 [Google Scholar]
- 29.Solomon J., et al. , “Quantitative features of liver lesions, lung nodules, and renal stones at multi? Detector row CT examinations: dependency on radiation dose and reconstruction algorithm,” Radiology 279(1), 185–194 (2016).https://doi.org/10.1148/radiol.2015150892 [DOI] [PubMed] [Google Scholar]
- 30.ATOM, “Atom dosimetry verification phantoms” (2015).
- 31.Haralick R. M., Shanmugam K., Dinstein I., “Textural features for image classification,” IEEE Trans. Syst. Man Cybern. SMC-3(6), 610–621 (1973).https://doi.org/10.1109/TSMC.1973.4309314 [Google Scholar]
- 32.Soh L. K., Tsatsoulis C., “Texture analysis of SAR sea ice imagery using gray level co-occurrence matrices,” IEEE Trans. Geosci. Remote Sens. 37(2), 780–795 (1999).https://doi.org/10.1109/36.752194 [Google Scholar]
- 33.Clausi D. A., “An analysis of co-occurrence texture statistics as a function of grey level quantization,” Can. J. Remote Sens. 28(1), 45–62 (2002).https://doi.org/10.5589/m02-004 [Google Scholar]
- 34.Tang X., “Texture information in run-length matrices,” IEEE Trans. Image Process. 7(11), 1602–1609 (1998).https://doi.org/10.1109/83.725367 [DOI] [PubMed] [Google Scholar]
- 35.Galloway M. M., “Texture analysis using gray level run lengths,” Comput. Graphics Image Process. 4(2), 172–179 (1975).https://doi.org/10.1016/S0146-664X(75)80008-6 [Google Scholar]
- 36.Al-Kadi O. S., Watson D., “Texture analysis of aggressive and nonaggressive lung tumor CE CT images,” IEEE Trans. Biomed. Eng. 55(7), 1822–1830 (2008).https://doi.org/10.1109/TBME.2008.919735 [DOI] [PubMed] [Google Scholar]
- 37.Sarkar N., Chauduri B. B., “Efficient differential box-counting approach to compute fractal dimension of image,” IEEE Trans. Syst. Man Cybern. 24(1), 115–120 (1994).https://doi.org/10.1109/21.259692 [Google Scholar]
- 38.Ojala T., Pietikäinen M., Harwood D., “A comparative study of texture measures with classification based on featured distributions,” Pattern Recognit. 29(1), 51–59 (1996).https://doi.org/10.1016/0031-3203(95)00067-4 [Google Scholar]
- 39.Pietikäinen M., et al. , Local Binary Patterns for Still Images, pp. 13–47, Springer, London: (2011). [Google Scholar]
- 40.Chakraborty J., et al. , “Statistical measures of orientation of texture for the detection of architectural distortion in prior mammograms of interval-cancer,” J. Electron. Imaging 21(3), 033010 (2012).https://doi.org/10.1117/1.JEI.21.3.033010 [Google Scholar]
- 41.Midya A., Chakraborty J., “Classification of benign and malignant masses in mammograms using multi-resolution analysis of oriented patterns,” in IEEE 12th Int. Symp. on Biomedical Imaging (ISBI), pp. 411–414 (2015).https://doi.org/10.1109/ISBI.2015.7163899 [Google Scholar]
- 42.Lin L. I.-K., “A concordance correlation coefficient to evaluate reproducibility,” Biometrics 45(1), 255–268 (1989).https://doi.org/10.2307/2532051 [PubMed] [Google Scholar]
- 43.McBride G., “A proposal for strength-of-agreement criteria for Lin’s concordance correlation coefficient,” Tech. Rep., National Institute of Water and Atmospheric Research Ltd. (2005). [Google Scholar]
- 44.Nakamoto A., et al. , “Clinical evaluation of image quality and radiation dose reduction in upper abdominal computed tomography using model-based iterative reconstruction; comparison with filtered back projection and adaptive statistical iterative reconstruction,” Eur. J. Radiol. 84(9), 1715–1723 (2015).https://doi.org/10.1016/j.ejrad.2015.05.027 [DOI] [PubMed] [Google Scholar]


