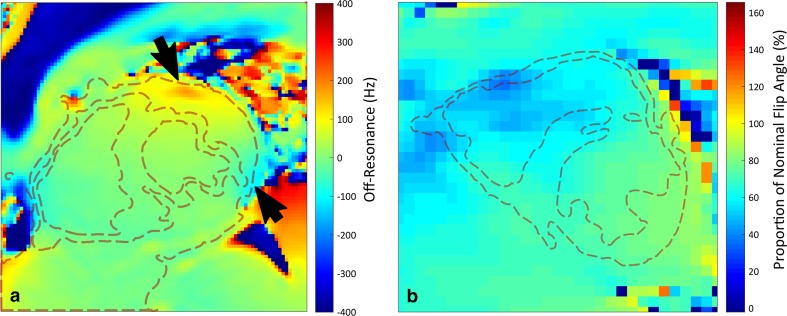
Fig. 2.
In vivo fieldmaps of static field and radiofrequency transmit homogeneity in the heart. Plots show a B 0 map (a) and a B 1 map (b) planned across the mid-ventricular short axis of the heart, with dashed red lines delineating the approximate boundaries of the myocardium. Maps were acquired at 3T, subsequent to first-order B 0 shimming and dual-channel RF calibration. Note the distinct inhomogeneity of B 0 near the coronary veins in a (arrows), and slightly reduced pulse performance across the right ventricle in b, where the measured B 1 drops to around 50–60% of the nominal value

