

Abstract
Objectives
To study fetal growth in pregnancies at risk for growth restriction (GR) using, for the first time, the fetal growth pathology score (FGPS1).
Methods
A retrospective cohort study of GR was carried out in 184 selected SGA singletons using a novel, composite measure of growth abnormalities termed the FGPS1. Serial fetal biometry was used to establish second trimester Rossavik size models and determine FGPS1 values prior to delivery. FGPS1 data were compared to neonatal growth outcomes assessed using growth potential realization index (GPRI) values (average negative pathological GPRI (av – pGPRI)). Growth at the end of pregnancy was evaluated from differences in negative, individual composite prenatal growth assessment scores (-icPGAS) measured at the last two ultrasound scans. The FGPS1 and av – pGPRI values were used to classify fetal growth and neonatal growth outcomes, respectively, as Normal (N) or Abnormal (A).
Results
The risk of neonatal GR (based on birth weight (BW)) was moderate (MR: between 5th and10th percentiles (n=113)) or significant (SR:<5th percentile) (n=71)). Individual pregnancies were grouped into four categories, two representing agreement (N–N (29%), A–A (40%)) and two representing discordance (N–A (11%), A–N (20%)). In the largest and most variable subgroup (A–A,<5%tile, n=49), there was a statistically significant correlation (0.63, p<.0001) between the FGPS1 and av – pGPRI. In N–A, all 20 cases (100%) had long last-scan-to-delivery intervals (1.9 weeks or greater), suggesting late development of the growth abnormality. For A–N, in approximately equal proportions, GR was improving, progressing or unclassifiable at the end of pregnancy.
Conclusions
Significant agreement between prenatal and postnatal growth assessments was found using a novel approach for quantifying fetal growth pathology (FGPS1). Discordances appear to be due to lack of appropriate prenatal scans or an inadequate set of neonatal measurements. Evidence for a quantitative relationship between assessment methods was seen in the largest and most variable subgroup. The FGPS1 has the potential for characterizing GR in the third trimester and may provide a means for predicting the severity of corresponding abnormal neonatal growth outcomes.
Keywords: Individualized growth assessment, SGA, longitudinal growth study
INTRODUCTION
Fetal growth assessment is an essential component of prenatal care because growth abnormalities are associated with increased perinatal complications and long-term disabilities [1,2]. Conventional assessments of third trimester fetal growth and neonatal growth outcomes utilize age-specific size standards [3,4]. Such standards compare the individual to the group and include all variability between individuals. This limitation reduces diagnostic precision and the ability to detect the onset of these conditions when intervention could be beneficial.
Individualized growth assessment (IGA), by contrast, is based on second trimester growth velocities of size parameters (measures of growth potential) for a specified fetus [5]. These growth velocities specify Rossavik size models that provide individualized third trimester size standards and predicted birth characteristics (eliminating most between-individual variability) for up to 13 size parameters [6,7]. IGA also permits direct comparisons of fetal and neonatal growth outcome assessments on a personalized basis.
Changes in size parameters during the third trimester are evaluated by IGA from comparisons of actual and expected measurements. Percent Deviations (%Dev), the difference between expected and measured values (expressed as a percentage of the expected value (Figure 1)) are used in these comparisons [6]. Age-specific reference ranges, determined by measurement errors, modeling errors and the biological variability associated with following a predicted growth trajectory, have been established for thirteen anatomical parameters [6]. Growth pathology is then quantified by measuring the component of %Dev outside the appropriate reference range (Figure 1), called the pathological Percent Deviation (%Devp) [8].
Figure 1.
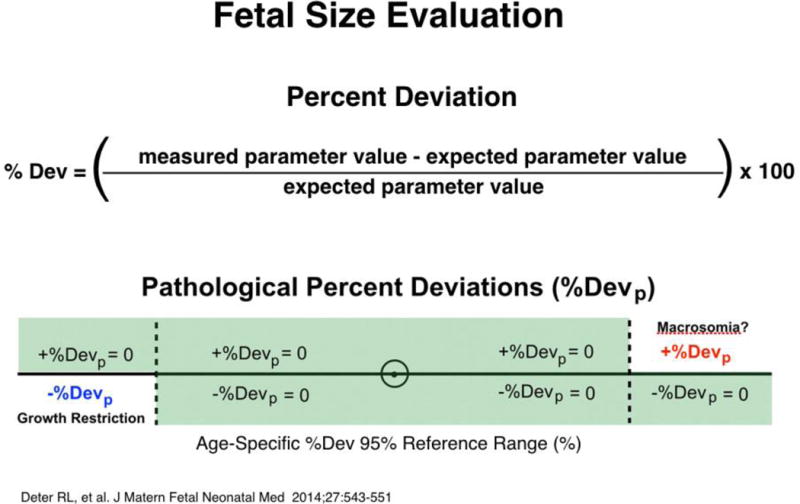
Fetal size evaluation. Fetal growth evaluations first compared actual measurements to expected values (generated with Rossavik size models specified in the second trimester from growth velocity measurements). Percent deviations (%Dev) were then compared to their 95% reference range. If the %Dev was positive, the numerical part above the upper normal limit was designated the positive pathological %Dev (+%Devp) and indicated macrosomia. If the %Dev was negative, the numerical part below the lower normal limit was designated the negative pathological %Dev (−%Devp) and indicated growth restriction. For both +%Devp and −%Devp, all other %Dev values were considered to be zero.
While use of %Devp eliminates many of the confounding variables affecting fetal growth assessment, it provides only a “snapshot” of the pathological growth process at one moment in time. To improve diagnostic performance, a summary measure that captures the history of each third trimester growth abnormality, reflecting its onset, duration and magnitude, is needed. We propose the fetal growth pathology score (FGPS (Figure 2, Appendix)), which represents the cumulative moving average of %Devp values of an individual growth parameter or sets of such parameters, for this purpose. As the first test of the usefulness of the FGPS, we compared third trimester growth categories, based on the FGPS1 (head circumference (HC), abdominal circumference (AC), femur diaphysis length (FDL), estimated weight (EWT)), to corresponding neonatal growth outcomes defined by the average, negative, pathological, GPRI (av – pGPRI: weight (WT), HC, crown-heel length (CHL), Figure 3) in a cohort of SGA pregnancies [7,9]. The latter is the pathological component of the parameter (GPRI) that is used to evaluate neonatal growth outcomes on an individualized basis [9]. This study evaluates the degree of concordance between our IGA assessments of prenatal and postnatal GR.
Figure 2.
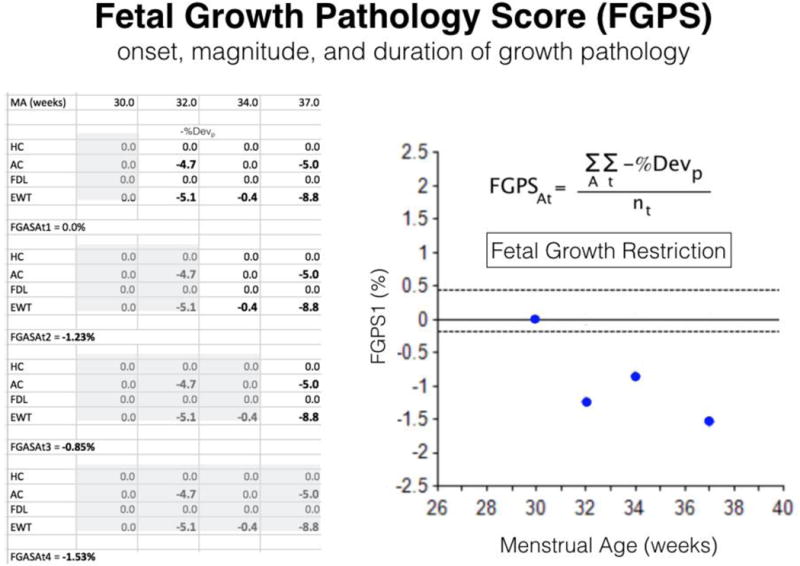
Fetal growth pathology score (FGPS). This figure presents the data (left-hand table), mathematical definition (upper right-hand corner), and graph (lower right-hand corner) of the FGPS1 in a growth restricted fetus. All negative pathological percent deviations (−%Devp) for head circumference (HC), abdominal circumference (AC), femur diaphysis length (FDL) and estimated weight (EWT) collected up to each time point (shaded area) were averaged (FGPSAt) and plotted in the graph. Earlier onset, longer duration and greater magnitude (number and size of −%Devp) of the growth pathology increase the FGPS1. A: complete set of four anatomical parameters; t: sequential time points.
Figure 3.
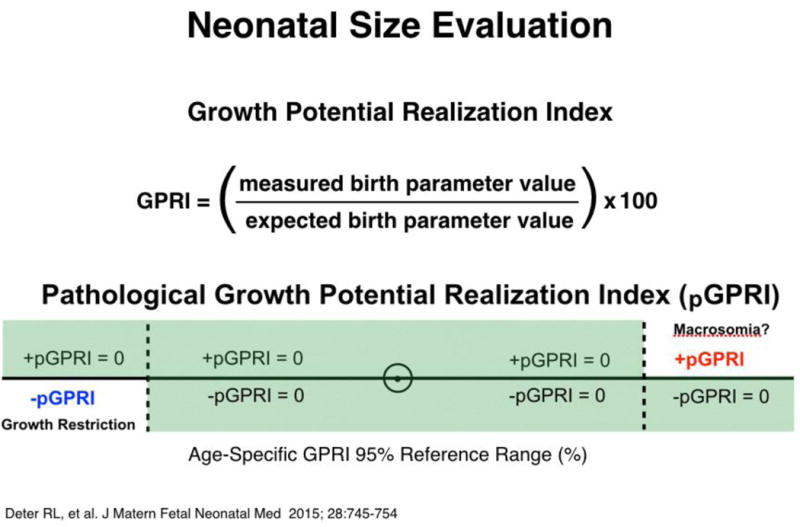
Neonatal size evaluation. Neonatal growth evaluations first compared actual birth measurements to expected values at their growth cessation ages (generated with Rossavik size models specified in the second trimester from growth velocity measurements). Growth potential index (GPRI) values were then compared to their 95% reference ranges. For GPRI’s above their reference ranges, the numerical part above the upper normal limit was designated the positive pathological GPRI (+pGPRI) and indicate macrosomia. For GPRI’s below their reference ranges, the numerical part below the lower normal limit was designated the negative pathological GPRI (−pGPRI) and indicate growth restriction. GPRI values within their reference ranges were assigned pGPRI values of zero. –pGPRI values were averaged to give av − GPRI values, neonates with values more negative than −0.69% being classified as growth restricted [9].
METHODS
Sample
This retrospective, multi-center study included SGA cases from three institutions: the Perinatology Research Branch (NICHD), Detroit, MI (145 cases); Texas Children’s Pavilion for Women, Houston, TX (14 cases); and Mount Sinai Hospital, University of Toronto, Toronto, ON, Canada (25 cases). SGA status (BW <10th percentile) was determined using the sex-specific birth weight standards of the Intergrowth-21st Project [4] for the Detroit and Houston cases. For this preliminary screening, the more appropriate gender-specific, Canadian birth weight standards of Kramer et al. [10] were used for the Toronto cohort. To improve consistency, the subgroup with birth weights (BW) below the 5th percentile was identified using the Intergrowth-21st Project standards [3] only. The selected sample of 184 cases had 113 with BW <10th percentile but at least equal to the 5th percentile. Seventy-one cases were in the BW <5th percentile subgroup. The 25 Toronto cases were part of a previous study of neonatal growth outcomes [9].
Additional inclusion and exclusion criteria were used in selecting cases for study. All cases were required to have at least two 2nd trimester scans, separated by 3–8 weeks [11], and two 3rd trimester scans separated by at least 2 weeks. At least four measurements (biparietal diameter (BPD), HC, AC and FDL) had to be available at each scan. In the neonate, three measurements (WT, HC and CHL) were required. Exclusion criteria were: (1) multiple gestations; (2) fetal anomalies; (3) delivery before 33 weeks, menstrual age (MA). Since the individualized standards used in this study incorporate the effects of demographic variables on growth potential by utilizing empirically measured second trimester growth velocities to specify the standards [5], a description of conventional demographics is unnecessary. Each fetus is its own control and group characteristics are not relevant.
Fetal age determination
Fetal age was determined from crown-rump length measurements made before 12 weeks, MA, as previously described [12] or from a composite of the BPD, HC, AC and FDL measurements obtained before 16 weeks, MA [6].
Ultrasound assessment
Serial ultrasound examinations were carried out from 14.0 weeks, MA, to delivery. Before 28 weeks, MA, 77.7% of cases had 3–4 scans while only 17.4% were limited to two scans (Table 1). In the third trimester, 71.3% had three or more scans and in 17.4%, there was one scan between 38 weeks and delivery. In each scan, the BPD, HC, AC and FDL were measured using methods previously described [13]. Fetal weights were estimated primarily using the four parameters (BPD, HC, AC and FDL] method of Hadlock et al. [14]. However, in cases with abnormal second trimester growth velocities [6], other Hadlock weight estimation functions with parameters having normal velocities or the method of Deter et al. [15], utilizing the head and abnorminal cubes (Hcube, Acube) estimated from conventional biometric measurements [16], were used. Only 17/184 (9.2%) required alternative weight estimation procedures. The last-scan-to-delivery interval was less than one week in 34.2% and less than two weeks in 58.7% (Table 1). In only 23.9% was it more than 3 weeks.
Table 1.
Sample Characteristics (N = 184 SGA Singletons)
| a. Number of scans | |||||||||
| Before 28 weeks | After 28 weeks | ||||||||
| 2 | 3 | 4 | 5 | 2 | 3 | 4 | 5 | 6 | |
| 17.4% | 51.6% | 26.1% | 4.9% | 28.7% | 31.5% | 24.5% | 12.0% | 3.3% | |
| b. Last- Scan-to-Delivery Interval (weeks) | |||||||||
| > 4.0 | 4.0–3.1 | 3.0–2.1 | 2.0–1.0 | < 1.0 | |||||
| 15.2% | 8.7% | 17.4% | 24.5% | 34.2% | |||||
| c. Birth Age (weeks) | |||||||||
| 33.1–34 | 34.1–35 | 35.1–36 | 36.1–37 | 37.1–38 | 38.1–39 | 39.1–40 | >40.1 | ||
| 1.1% | 3.3% | 2.2% | 13.0% | 19.6% | 26.0% | 20.1% | 14.7% | ||
Neonatal assessment
Birth age ranged from 33 weeks to 42 weeks. MA (Table 1). There were 80.4% term deliveries (>37 weeks, MA) and 1.1% extremely preterm deliveries (<34 weeks, MA). Postnatal measurements of WT, HC and CHL were obtained within 24 h of delivery using electronic scales and a tape measure.
Data analysis
Second trimester growth assessment
Second trimester growth velocities were calculated directly (two scans) or taken as the slopes of linear regression lines fitted to measurements obtained before 28.1 weeks, MA [6]. These velocity values were compared to reference ranges specified previously in fetuses with normal neonatal growth outcomes [6]. For all values falling below the lower limits of parameter-specific reference ranges, the differences between the actual values and the appropriate lower limits were calculated.
Third trimester growth assessment
Individualized Size Standards
Second trimester growth velocities (slopes) were used to specify Rossavik size models (P=c(t)k+st) for different anatomical parameters in individual fetuses, an IGA procedure that has been described in detail elsewhere [6]. Basically, these models relate the parameter size (P) to fetal age (t) via the coefficients c, k and s. This requires functions specifying the relationship of loge c to loge slope and s to c, k being a constant, that have been developed previously for the biometric parameters used in this study [6]. These models were used to define predicted size trajectories for all four anatomical parameters evaluated in this investigation in each fetus studied. Predicted size trajectories for EWT were obtained by using the predicted values of the parameter set used for weight estimation at each time point in a weight estimation function for calculating the predicted EWT at each time point. These IGA analyses were carried out using individualized growth assessment program (iGAP), a freely available online software application that is available for download at http://igap.research.bcm.edu.
Outcome Parameters
Measured and predicted values were used to calculate −% Dev values at each time point (Figure 1) [6]. Comparisons of these values to the lower limits of their age-specific reference ranges provided a set of −%Devp values (HC, AC, FDL and EWT) at each time point (Figure 1). A negative, individual composite prenatal growth assessment score (-icPGAS) was defined as the mean value of the −%Devp values obtained at a specified third trimester time point for a set of anatomical parameters (Figure 4) [16]. In evaluating growth just before delivery in certain subgroups, changes in -icPGAS values between the last two scans were evaluated. Change values were compared to zero using the one-sample t-test.
Figure 4.
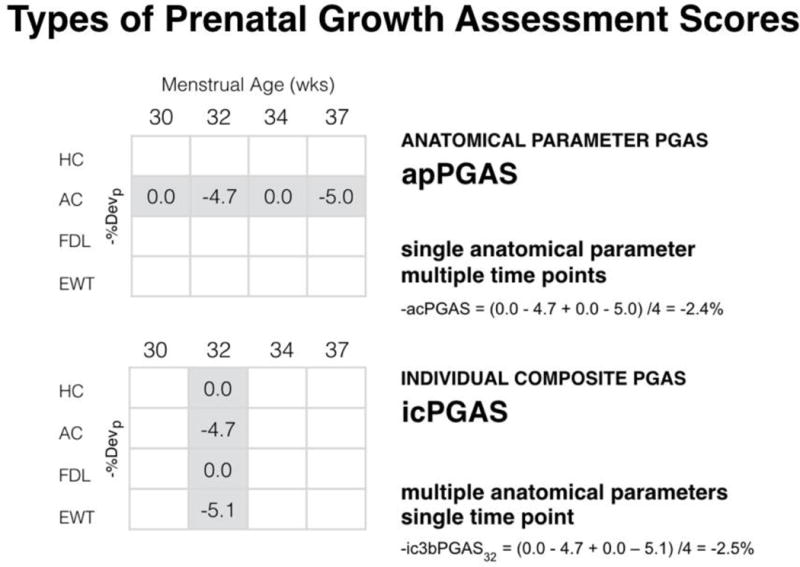
Types of prenatal growth assessment scores (PGAS). This figure illustrates how the negative anatomical parameter PGAS (−apPGAS) and negative individual composite PGAS (−icPGAS) values are calculated. They are the average of the negative pathological percent deviation (−%Devp) values for a given anatomical parameter during the third trimester (apPGAS) or the average of a set of −%Devp values obtained for specified group of anatomical parameters at a given time point in the third trimester (−icPGAS).
The cumulative moving average of −%Devp values, calculated after each third trimester scan, can be plotted to give a visual representation of changes in growth pathology over time (Figure 2). This moving average was defined as the first FGPS and its value after the last scan before 38 weeks was used to distinguish normal third trimester growth from GR (95% boundary value: −0.19% [16]).
The FGPS1 has a value very close to 0% in normally growing fetuses as most −%Devp are assigned a value of zero unless growth pathology is present (Figure 1) [8]. It becomes more negative with earlier onset, longer duration and increasing magnitude (increasing number of parameters affected and size of the −%Devp values) of the growth pathology. As it can be seen in Figure 2, it also can provide estimates of onset and duration and indicate progression or regression of the pathological process (Appendix).
Neonatal growth assessment
As shown in Figure 3, GPRI values were calculated using actual and predicted neonatal measurements [7]. Predicted values for WT, HC and CHL were obtained using the Rossavik size models for various anatomical parameters and a prediction age of 38 weeks (38.5 weeks for CHL), to adjust for late term growth cessation that occurs in fetuses with normal neonatal growth outcomes [7]. The predicted WT was calculated from the set of predicted values for the parameters used in the weight estimation function while the predicted CHL was calculated using the predicted FDL value and the function relating CHL to FDL given previously [9].
GPRI values were compared to their reference ranges and the –pGPRI values determined as shown in Figure 3. The –pGPRI values for WT, HC and CHL were averaged to give the av −pGPRI. This measure was used to separate neonates with normal growth outcomes from those with GR (boundary value: −0.69%). Previous studies have shown that this boundary effectively separates normally grown and growth restricted SGA neonates identified with the negative GPRI profile or placental assessment [7,9].
Classification system
An important limitation of prior studies has been a paucity of information on the limits of agreement between fetal growth classifications and neonatal growth assessments, using methods that account for differences in growth potential. To assess the relationship between third trimester growth and neonatal growth outcome, a simple classification system was devised. If prenatal growth and neonatal growth outcomes were both normal (using the criteria given above), the fetus/neonate was categorized as Normal–Normal (N–N). Fetuses/neonates identified with growth abnormalities both prenatally and postnatally were categorized as Abnormal–Abnormal (A–A). If the prenatal growth was normal and the postnatal growth outcome was abnormal, the category was Normal–Abnormal (N–A). The reverse of this finding, namely a prenatal growth abnormality with a normal neonatal growth outcome, was classified as Abnormal–Normal (A–N). This classification system was used for the group as a whole and for the two weight subgroups (i.e. <10th–5th percentile, <5th percentile) separately. Measured parameters in these subgroups were compared using the two-sample t-test. The relationships of FGPS1 to the av −pGPRI in the A–A group were evaluated using linear correlation. Significance in all statistical testing was p < .05.
Results
Second trimester growth assessments
Even in this sample with 83/184 (45.1%) cases having BW <5th percentile, 693/738 (93.9%) of the second trimester growth velocities were within the reference ranges obtained from fetuses with normal neonatal growth outcomes [6]. There were 45 values outside these reference ranges (BPD: 8; HC: 11; AC: 19; and FDL: 5). The mean differences (SD) from their reference range lower limits (BPD: 0.25; HC: 0.90; AC: 0.90; FDL: 0.20 cm/week) were small (BPD: −0.02(±0.01)); HC: −0.04(±0.02); AC: −0.07(±0.04); FDL: −0.03(±0.04) cm/week). Exceptions were AC differences of −0.15 and −0.17 cm/week in two likely early-onset GR cases.
Classification
As seen in Table 2a, the majority (69%) of these SGA cases were classified as N–N or A–A. An additional 11% were Normal at the end of the third trimester but the neonate was growth restricted (N–A). The final 21% were considered abnormal prenatally but no (or minimal) evidence of GR was found in the neonate (A–N). In the BW <10th–5th percentile subsample, 38% were N–N and only 21% were A–A (Table 2(a)). The comparable values for the BW <5th percentile subsample were 15% and 69%. In both these subsamples, less than 15% were found in either the N–A or A–N group, except for the 27% of the BW <10th to 5th percentile subsample that were in the A–N group (Table 2(a)).
Table 2a.
Growth Outcome Group Frequency Distributions for SGA Singletons
| BW Percentiles | Number SGA | Normal-Normal (N-N) | Abnormal-Abnormal (A-A) | Normal-Abnormal (N-A) | Abnormal-Normal (A-N) |
|---|---|---|---|---|---|
| < 10th | 184 | 53 (29%) | 73 (40%) | 20 (11%) | 38 (20%) |
|
| |||||
| < 10th – 5th | 113 | 42 (38%) | 24 (21%) | 16 (14%) | 31 (27%) |
| < 5th | 71 | 11 (15%) | 49 (69%) | 4 (6%) | 7 (10%) |
Normal–Normal (29%)
As expected, most of these cases (79%) were found in the <10th–5th percentile subgroup (Table 2(b)). However, in some fetuses/neonates with birth weights below the 5th percentile, there was no evidence of GR prenatally or postnatally with IGA. Statistical analyses indicated no significant differences in FGPS1 or av −pGPRI values for the two birth weight subgroups (Table 3).
Table 2b.
Growth Outcome Group Percentage of SGA Singletons Stratified By BW Percentile
| BW Percentiles | % of All SGA | Normal-Normal (N-N) | Abnormal-Abnormal (A-A) | Normal-Abnormal (N-A) | Abnormal-Normal (A-N) |
|---|---|---|---|---|---|
| < 10th – 5th | 113/184 (61%) | 42/53 (79%) | 24/73 (33%) | 4/20 (20%) | 31/38 (82%) |
| < 5th | 71/184 (39%) | 11/53 (21%) | 49/73 (67%) | 16/20 (80%) | 7/38 (18%) |
Growth outcome groups are classified (N-N, A-A, N-A, A-N) according to the Fetal Growth Pathology Score (FGPS1) prior to delivery and neonatal growth outcomes based on the average negative Growth Potential Realization Index (av -GPRI): BW = birth weight; SGA = small for gestational age newborns with birth weight < 10th percentile.
Table 3.
Prenatal and Postnatal Growth Assessment in SGA Singletons
| BW Percentile | Normal-Normal (N-N) | Abnormal-Abnormal (A-A) | ||||
|---|---|---|---|---|---|---|
| No. | FGPS1 (%) | av -pGPRI (%) | No. | FGPS1 (%) | av -pGPRI (%) | |
| < 10th | 53 | −0.05 ± 0.06 | −0.06 ± 0.16 | 73 | −1.64 ± 1.60 | −3.07 ± 2.13 |
| < 10th – 5th | 42 | −0.04 ± 0.06 | −0.07 ± 0.16 | 24 | −1.32 ± 1.23 | −1.91 ± 1.37 |
| < 5th | 11 | −0.06 ± 0.06 | −0.04 ± 0.12 | 49 | −1.80 ± 1.74 | −3.64 ± 2.21* |
| BW Percentile | Normal-Abnormal (N-A) | Abnormal-Normal (A-N) | ||||
|---|---|---|---|---|---|---|
| No. | FGPS1 (%) | av -pGPRI (%) | No. | FGPS1 (%) | av -pGPRI (%) | |
| < 10th | 20 | −0.05 ± 0.08 | −2.79 ± 2.25 | 38 | −1.02 ± 0.81 | −0.10 ±0.19 |
| < 10th – 5th | 4 | −0.04 ± 0.08 | −1.30 ±0.74 | 31 | −1.05 ± 0.86 | −0.09 ±0.17 |
| < 5th | 16 | −0.05 ± 0.09 | −2.92 ± 1.34* | 7 | −0.87 ± 0.53 | −0.16 ± 0.26 |
Growth outcome groups are classified (N-N, A-A, N-A, A-N) according to the Fetal Growth Pathology Score (FGPS1) prior to delivery and neonatal growth outcomes based on the average negative Growth Potential Realization Index (av -GPRI); BW = birth weight; SGA = small for gestational age newborns with birth weight < 10th percentile; data expressed as mean values ± 1 SD
statistically significant difference [two-sample t-test, p < 0.05] between < 10th - 5th and < 5th BW Percentile subcategories
Abnormal–Abnormal (40%)
Consistent with conventional interpretations of BW <5th percentile, the majority of these cases (67%) were found in the <5th percentile subgroup (Table 2(b)). Both the FGPS1 and av −pGPRI values were greater in this subgroup (Table 3) but only the difference in av −pGPRI values was statistically significant. The variability of the av −pGPRI was also greater (±1.37 to ±3.64), indicating the heterogeneity of this more extreme form of GR (Table 3). Correlations between FGPS1 and av −pGPRI values were found to be 0.39 (p = .06) and 0.63 (p = .0001) for the <10th–5th percentile and <5th percentile birth weight subgroups, respectively.
Normal–Abnormal (11%)
This small category was composed primarily of term infants (birth age: 38.0 ± 1.2 weeks], 80% of the cases having BW <5th percentile (Table 2(b)). There was essentially no evidence of GR prenatally (45% had three or more third trimesters scans) in either birth weight subgroup. However, the av −pGPRI values were abnormally low (significantly more negative in the <5th percentile subgroup (Table 3)). This discrepancy suggested the possibility of a major reduction in fetal growth occurring at the end of pregnancy (Figure 5(a)). Examination of the last-scan-to-delivery interval found that this interval averaged 2.7 weeks in the <10th–5th percentile subgroup and 2.9 weeks in the <5th percentile subgroup. More importantly, essentially 100% of these intervals were 2 weeks or longer (one exception: 1.9 weeks). Only 41.3% of the entire sample had last-scan-to-delivery intervals that were ≥2 weeks.
Figure 5.
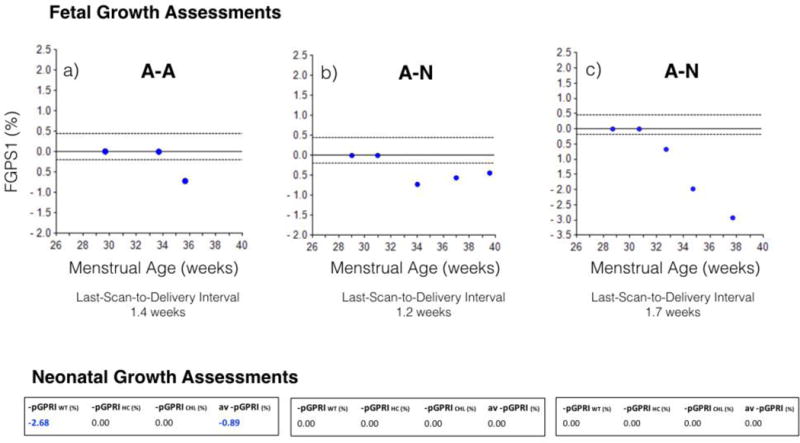
Fetal growth restriction patterns. a) Pre-delivery growth abnormality (Figure 5(a)): Growth abnormality only in last two weeks before delivery; confirmed by an abnormal av −pGPRI; b) Recovery from earlier growth abnormality (Figure 5(b)): less negative FGPS1 with advancing fetal age; confirmed by normal neonatal growth outcome; c) Progressive growth restriction (Figure 5(c)): increasingly negative FGPS1 throughout third trimester; no growth abnormalities found in GPRI’s for WT, HC or CHL. FGPS1: fetal growth pathology score; GPRI: growth potential realization index; av −pGPRI: average pathological growth potential realization index
Abnormal–Normal (21%)
Cases in this category were primarily (82%) from the <10th–5th percentile birth weight subgroup (Table 2(b)). Within this category, there appears to be two subcategories based on the last-scan-to-delivery interval. In approximately two thirds of the cases, this interval was two weeks or less (mean: 0.86 weeks; range: 0.0–2.0 weeks (Table 4)). Changes in the −icPGAS values for the last two scans in these cases indicated the presence of two patterns. In one pattern (13 cases), all differences in −icPGAS values were positive (one exception: zero), indicating that fetal growth was becoming more normal (regression of GR (Table 4) (Figure 5(b))). In the other pattern (11 cases), all differences in −icPGAS values were negative, indicating that fetal GR was getting worse (progression of GR (Table 4) (Figure 5(c))). In the second subcategory (14 cases), there were no scans within two weeks of delivery, the last-scan-to-delivery interval averaging 4.2 (100% range: 2.1–6.0) weeks, so no assessment of GR at the end of pregnancy was possible.
Table 4.
End-of-Pregnancy Growth in Abnormal - Normal Outcome Group
| FGR Subcategory | Next to Last Scan | Last Scan | -icPGAS1 | FGPS12 | av -pGPRI3 | ||
|---|---|---|---|---|---|---|---|
|
| |||||||
| MA4(wk) | -icPGAS (%) | MA4(wk) | -icPGAS (%) | change5(%) | % | % | |
|
|
|
|
|
|
|||
|
Regressing (n = 13) |
35.5 [32.4 to 37.4] |
−1.95 [−5.66 to 0.00] |
38.4 [35.9 to 39.9] |
−0.35 [−2.87 to 0.00] |
+1.60 [0.00 to +5.00] |
−0.98 [−3.03 to −0.24] |
−0.12 [−0.68 to 0.00] |
|
Progressing (n = 11) |
34.9 [33.1 to 36.7] |
−1.15 [−5.94 to 0.00] |
37.4 [35.1 to 38.7 |
−3.03 [−6.67 to 0.68] |
−1.88 [−4.05 to −0.68] |
−0.98 [−2.29 to −0.29] |
−0.04 [−0.37 to 0.00] |
FGR = fetal growth restriction defined as BW < 10th percentile; MA = menstrual age (weeks) data expressed as mean values (100% range]
Regressing Fetal Growth Restriction: last-scan-to-delivery interval 0.89 (0.0 to 2.0) weeks; birth age 39.3 (37.0 to 41.4) weeks
Progressing Fetal Growth Restriction: last-scan-to-delivery interval 0.83 (0.0 to 1.7) weeks; birth age 38.2 (36.4 to 38.4) weeks
Both values for -icPGAS change were significantly different from zero, t-test [p < 0.05]
-icPGAS = negative, individual, composite Prenatal Growth Assessment Score
FGPS1 = Fetal Growth Pathology Score 1
av -pGPRI = average negative pathological Growth Potential Realization Index
MA = menstrual age (weeks)
change refers to difference in -icPGAS values between Next to Last Scan and Last Scan
Discussion
Principal findings
Our investigation is the first attempt to use the FGPS to evaluate third trimester growth abnormalities and represents the largest IGA study of GR. Our first objective was to compare third trimester assessments with FGPS1 to neonatal growth outcomes based on the av −pGPRI, a parameter shown to be effective in identifying different growth outcomes in SGA singletons [9]. Information was obtained on individuals with moderate (<10th–5th percentile) and significant (<5th percentile) risk for growth abnormalities. The FGPS quantifies third trimester growth pathology, reflecting the age of onset, duration and magnitude of these abnormalities (Appendix).
Comparisons indicated that the prenatal and postnatal size assessments were in agreement for a majority (69%) of cases with both normal and growth restricted outcomes. Normal growth occurred more frequently in those cases at moderate risk for GR while restricted growth was found primarily in those at significant risk (Table 2). However, normal growth did occur in some cases with BW <5th percentile. The IGA analysis detected an almost 40% incidence of normal growth outcomes in the moderate risk group while approximately 70% of the significant risk group had GR. These results support the adoption of lower birth weight percentiles for fetal growth abnormality screening [17] but IGA is needed to more specifically categorizing individual fetuses in these heterogeneous groups.
A correlation (0.63, p = .0001) between the FGPS1 and the av −pGPRI was found in the significant risk group (BW <5th percentile A–A (Table 2(a))). Though preliminary due to small sample size, this result suggests the possibility of obtaining quantitative estimates of neonatal growth pathology using the FGPS.
In about one-third of cases (31%), the prenatal and postnatal growth outcome variables were discordant (Table 2(a)). In the smaller group (N–A, 11%), fetal growth was considered normal but the neonatal growth outcome indicated restricted growth. Most of these cases (80%) were found in the significant risk group but none had scans in the last two weeks of pregnancy (Table 2(b)). These results could be explained by an adverse effect on fetal growth occurring only late in pregnancy, as shown in the example given in Figure 5(a).
Cases in the larger discordant group (A–N, 20%) were primarily (82%) from those neonates with moderate risk for GR. In these cases, GR was seen prenatally but the neonates had minimal or no growth abnormalities.
There appeared to be three types of third trimester patterns in this subgroup. In the first (13 cases), fetal growth improved between the last two scans (regression of GR), the last scan being within 2 weeks of delivery (Table 4). An example of this process is given in Figure 5(b). This discordance was probably due, in part, to the cumulative nature of the FGPS1 but failure to detect a neonatal growth abnormality may have been caused by an inadequate (lack of soft tissue measures) neonatal assessment set.
A second growth pattern (11 cases) was one in which fetal growth became worse between the next-to-last and last scans (progressive GR (Figure 5(c))), the latter averaging less than one week before delivery (Table 4). In all cases the −icPGAS values at the last scan indicated GR. The “Normal” neonatal outcomes found in these cases are most likely due to an inadequate set of birth measurements for growth assessment (see above).
A third component of this subgroup included 14 fetuses that did not have a scan within two weeks of delivery (last-scan-to-delivery interval: mean 4.2 weeks, 100% range 2.1–6.0 weeks). The lack of a scan near delivery made these cases unclassifiable. They represent 7.6% of the total sample.
Previous studies
No previous investigations have used FGPS1 but a related parameter, the original PGAS (utilizing references ranges for the entire third trimester rather than ones that were age-specific [6]), has been studied in twins [8]. The PGAS effectively identified normal and growth restricted twin fetuses with different types of GRs except in cases with only soft tissue loss [8,18]. With respect to the av −pGPRI, it has also been used previously to separate normal and growth restricted SGA singletons [7,9] and showed good agreement (89%) with a growth outcome classification based on BW and placental assessments [9].
Strengths and limitations
The strengths of this longitudinal study are its large sample size for an IGA evaluation of SGA infants, approximately equally distributed between cases with moderate and significant risk for GR based on BW. The availability of a relatively large number of both second trimester (model specification) and third trimester (growth assessment) scans is unusual and makes detailed IGA analyzes possible. The use of IGA is a major strength of this investigation as it corrects for differences in growth potential, reduces biological variability and provides individualized size standards for both fetuses and neonates [6,7]. Our composite parameters (FGPS1, av −pGPRI) are sensitive to the major aspects of pathological growth processes and they provide comprehensive assessments of growth abnormalities that are not otherwise possible using conventional biometry. Most importantly, IGA allows measurements to be compared to individualized and prescriptive standards rather than group standards.
Our study has several limitations. First, the retrospective nature of our study and its concentration on SGA pregnancies mean that the performance of FGP1 in unselected or high-risk pregnancies is unknown. Second, there are important missing data such as the lack of scans within two weeks of delivery in some fetuses and the lack of neonatal soft tissue measurements. The former prevented definitive classification of 34/184 (18.5%) cases delivered more than two weeks after last scan. The latter affected the classification of 24/184 (13.0%). Soft tissue abnormalities are frequently seen in growth restricted SGA neonates [7]. Weight measurements may not accurately reflect soft tissue development since GR can occur without weight abnormalities [7,19] and weight does not strongly correlate with percent body fat [20,21]. The incidence of weight abnormalities (52.9%) was substantially lower than that for thigh circumference (76.5%) in growth restricted SGA neonates [7]. Third, to maximize sample size, a modest relaxation of IGA criteria was required (see Supplement 1). In less than 10% of the cases, the end of normal growth was 26 weeks instead of 28 weeks (4.9%), second trimester growth velocities were below their reference ranges (6.1%) and alternative weight estimation methods were needed (9.2%). These differences may have increased variability in the results but this was at least partially compensated by the increase in sample size.
Clinical significance
Our results indicate that 1) individuals at significant risk for GR (based on BW) can have normal growth outcomes, 2) the use of lower birth weight percentiles in GR screening is supported by our results, 3) significant changes in fetal growth can occur in the last two weeks before delivery and 4) the lack of soft tissue measures, prenatally and postnatally, results in some cases of GR being undetected. These observations indicate a need to reconsider how growth is being assessed in the clinical setting.
Conclusions
The FGPS significantly enhances the detection and characterization of abnormal fetal growth processes and is in good agreement with neonatal growth assessments (69%), although our study was limited by the lack of soft tissue measurements. The last two weeks before delivery appears to represent a critical time in fetal growth processes, with the sudden development of abnormalities or recovery from abnormalities present earlier in pregnancy. Improvements in the characterization of fetal or neonatal growth status may require significant changes in the size parameters measured and the timing of scans used in routine clinical care.
Supplementary Material
Acknowledgments
FUNDING
This research was supported, in part, by the Perinatology Research Branch, Division of Obstetrics and Maternal-Fetal Medicine, Division of Intramural Research, Eunice Kennedy Shriver National Institute of Child Health and Human Development, National Institutes of Health, U.S. Department of Health and Human Services (NICHD/NIH/DHHS); and, in part, with Federal funds from NICHD/NIH/DHHS under Contract No. HHSN275201300006C. Dr. Romero has contributed to this work as part of his official duties as an employee of the United States Federal Government.
Disclosure statement
Rose Torno Chair at Mount Sinai Hospital, University of Toronto, to Professor John Kingdom. This research was supported (in part) by the Perinatology Research Branch, Division of Intramural Research, Eunice Kennedy Shriver National Institute of Child Health and Human Development, NIH and DHHS. R. Romero contributed to this work as part of his official duties as an employee of the United States Federal Government.
Footnotes
DISCLOSURE STATEMENT
The authors report no conflicts of interest.
References
- 1.American College of Obstetricians and Gynecologists. ACOG Practice bulletin no. 134: fetal growth restriction. Obstet Gynecol. 2013;121:1122–33. doi: 10.1097/01.AOG.0000429658.85846.f9. [DOI] [PubMed] [Google Scholar]
- 2.Sharma D, Farahbakhsh N, Shastri S, Sharma P. Intrauterine growth restriction - part 2. J Matern Fetal Neonatal Med. 2016;11:1–12. [Google Scholar]
- 3.Villar J, Ismail LE, Victora CG, et al. International standards for newborn weight, length and head circumference by gestational age and sex: the newborn cross-sectional study of the INTERGROWTH-21st project. Lancet. 2014;384:857–68. doi: 10.1016/S0140-6736(14)60932-6. [DOI] [PubMed] [Google Scholar]
- 4.Papageorghiou AT, Ohuma EO, Altman DG, et al. International standards for fetal growth based on serial ultrasound measurements: the fetal growth longitudinal study of the INTERGROWTH-21st project. Lancet. 2014;384:869–79. doi: 10.1016/S0140-6736(14)61490-2. [DOI] [PubMed] [Google Scholar]
- 5.Deter RL. Individualized growth assessment: evaluation of growth using each fetus as its own control. Semin Perinatol. 2004;28:23–32. doi: 10.1053/j.semperi.2003.10.011. [DOI] [PubMed] [Google Scholar]
- 6.Deter RL, Lee W, Sangi-Haghpeykar H, et al. Individualized fetal growth assessment: critical evaluation of key concepts in the specification of third trimester growth trajectories. J Matern Fetal Neonatal Med. 2014;27:537–42. doi: 10.3109/14767058.2013.833904. [DOI] [PMC free article] [PubMed] [Google Scholar]
- 7.Deter RL, Lee W, Sangi-Haghpeykar H, et al. Fetal growth cessation in late pregnancy: its impact on predicted size parameters used to classify small for gestational age neonates. J Matern Fetal Neonatal Med. 2015;28:755–65. doi: 10.3109/14767058.2014.934219. [DOI] [PMC free article] [PubMed] [Google Scholar]
- 8.Deter RL, Stefos T, Harrist RB, Hill RM. Detection of intrauterine growth retardation in twins using individualized growth assessment: II. evaluation of third-trimester growth and prediction of growth outcome at birth. J Clin Ultrasound. 1992;20:579–85. doi: 10.1002/jcu.1870200903. [DOI] [PubMed] [Google Scholar]
- 9.Deter RL, Levytska K, Lee W, et al. Classifying neonatal growth outcomes: use of birth weight, placental evaluation and individualized growth assessment. J Matern Fetal Neonatal Med. 2016;21:1–11. doi: 10.3109/14767058.2016.1157576. [DOI] [PubMed] [Google Scholar]
- 10.Kramer MS, Platt RW, Wen SW, et al. A new and improved population-based Canadian reference for birth weight for gestational age. Pediatrics. 2001;108:E35. doi: 10.1542/peds.108.2.e35. [DOI] [PubMed] [Google Scholar]
- 11.Stefos T, Deter RL, Simon NV. Effect of timing of initial scan and interval between scans on Rossavik growth model specification. J Clin Ultrasound. 1989;71:319–25. doi: 10.1002/jcu.1870170503. [DOI] [PubMed] [Google Scholar]
- 12.Hadlock FP, Shah YP, Kanon OJ, et al. Fetal crown rump length: reevaluation of relation to menstrual age (5–18 weeks) with high-resolution real-time US. Radiology. 1992;182:501–5. doi: 10.1148/radiology.182.2.1732970. [DOI] [PubMed] [Google Scholar]
- 13.Salomon LJ, Alfrevic G, Berghella V, et al. Practice guidelines for performance of the routine mid-trimester fetal ultrasound scan. Ultrasound Obstet Gynecol. 2011;37:116–26. doi: 10.1002/uog.8831. [DOI] [PubMed] [Google Scholar]
- 14.Hadlock FP, Harrist RB, Deter RL, Park SK. Estimation of fetal weight with the use of head, body, and femur measurements-a prospective study. Am J Obstet Gynecol. 1985;151:333–7. doi: 10.1016/0002-9378(85)90298-4. [DOI] [PubMed] [Google Scholar]
- 15.Deter RL, Rossavik IK, Harrist RB. Development of individual growth curve standards for estimated fetal weight. I. Weight estimation procedure. J Clin Ultrasound. 1988;16:215–25. doi: 10.1002/jcu.1870160402. [DOI] [PubMed] [Google Scholar]
- 16.Deter RL, Lee W, Sangi-Haghpeykar H, et al. A modified prenatal growth assessment score for the evaluation of fetal growth in the third trimester using single and composite biometric parameters. J Matern Fetal Neonatal Med. 2015;28:745–54. doi: 10.3109/14767058.2014.934218. [DOI] [PMC free article] [PubMed] [Google Scholar]
- 17.McIntire DD, Bloom SL, Casey BM, Leveno KJ. Birth weight in relation to morbidity and mortality among newborn infants. N Engl J Med. 1999;340:1234–8. doi: 10.1056/NEJM199904223401603. [DOI] [PubMed] [Google Scholar]
- 18.Deter RL, Xu B, Milner LL. Prenatal prediction of neonatal growth status in twins using individualized growth assessment. J Clin Ultrasound. 1996;24:53–9. doi: 10.1002/(SICI)1097-0096(199602)24:2<53::AID-JCU1>3.0.CO;2-J. [DOI] [PubMed] [Google Scholar]
- 19.Deter RL, Spence L. Identification of macrosomic, normal and intrauterine growth retarded neonates using the modified neonatal growth assessment score. Fetal Diagn Ther. 2004;19:58–67. doi: 10.1159/000074262. [DOI] [PubMed] [Google Scholar]
- 20.Lee W, Balasubramaniam M, Deter RL, et al. Fetal growth parameters and birth weight: their relationship to newborn infant body composition. Ultrasound Obstet Gynecol. 2009;33:441–6. doi: 10.1002/uog.6317. [DOI] [PMC free article] [PubMed] [Google Scholar]
- 21.Moyer-Mileur LJ, Slater H, Thomson JA, et al. Newborn adiposity measured by plethysmography is not predicted by late gestation two-dimensional ultrasound measures of fetal growth. J Nutr. 2009;139:1772–8. doi: 10.3945/jn.109.109058. [DOI] [PMC free article] [PubMed] [Google Scholar]
Associated Data
This section collects any data citations, data availability statements, or supplementary materials included in this article.