

Abstract
Population-level inferences and individual-level analyses are two important aspects in functional magnetic resonance imaging (fMRI) studies. Extracting reliable and informative features from fMRI data that capture biologically meaningful inter-subject variation is critical for aligning and comparing functional networks across subjects, and connecting the properties of functional brain organization with variations in behavior, cognition and genetics. In this study, we derive two new measures, which we term functional density map and edge map, and demonstrate their usefulness in characterizing the function of individual brains. Specifically, using data from the Human Connectome Project (HCP), we show that (1) both functional maps capture intrinsic properties of the functional connectivity pattern in individuals while exhibiting large variation across subjects; (2) functional maps derived from either resting-state or task-evoked fMRI can be used to accurately identify subjects from a population; and (3) cross-subject alignment using these functional maps considerably reduces functional variation and improves functional correspondence across subjects over state-of-the-art multimodal registration algorithms. Our results suggest that the proposed functional density and edge maps are promising features in characterizing the functional architecture in individuals and provide an alternative way to explore the functional variation across subjects.
Keywords: functional MRI, identity prediction, cross-subject alignment, functional variation
1. Introduction
A substantial degree of anatomical and functional variability in the human brain has been observed across individuals (Mueller et al., 2013; Laumann et al., 2015), which has a strong link with differences in behavioral performance (Stephen, 2016). Morphological measurements such as cortical thickness, sulcal depth and curvature can be computed from structural magnetic resonance imaging (MRI) scans and have been widely used to explore individual anatomical variability on the cortex (Fischl and Dale, 2000; Im et al., 2008). Functional variability in individuals can be captured by functional MRI (fMRI) in either task or resting conditions. Recently, functional connectivity derived from fMRI data has been utilized to investigate individual functional variability (Mueller et al., 2013). Individual differences in functional connectivity have been demonstrated, to be heterogeneous across the cortex in Mueller et al. (2013). Significantly higher variability has been shown in heteromodal association cortex while lower variability was found in unimodal cortices. However, the entire functional connectome is noisy, sensitive to local perturbations (Jiang et al., 2013), and difficult to visualize due to its high dimensional nature. Independent Component Analysis (ICA) is often employed to reduce the spatial dimension of fMRI data (Smith et al., 2013) but may fail to localize individual components. Low-dimensional functional measurements that can characterize functional connectivity profiles while preserving their spatial localization may provide a better way to compare and visualize functional differences at the individual level.
In contrast to individual-level analysis, group-level fMRI features obtained by averaging data across subjects have been more extensively investigated since the early 1990s. Group-level analysis often benefits from improved signal-to-noise ratio (SNR) but is hampered by substantial anatomical and functional variability across subjects. To enable a reliable group-level analysis, anatomical and functional correspondence need to be established among subjects before calculating the group average for subsequent analysis. Although anatomical variability can be largely removed through an alignment of morphological features (Liu et al., 2004; Gholipour et al., 2007; Fischl et al., 2008; Conroy et al., 2013), substantial functional variability often remains after structure-based cross-subject registration. Recent studies (Sabuncu et al., 2010; Conroy et al., 2013; Robinson et al., 2014) have attempted to remove functional variability by using fMRI-derived features in the registration, thus improving the power of analysis at the group level (Glasser et al., 2016).
In this work, we address two fundamental problems in the analysis of functional neuroimaging data. First, state-of-the-art fMRI studies utilize high-dimensional functional connectivity profiles (Yeo et al., 2011) or ICA-based fMRI features (Smith et al., 2013; Glasser et al., 2016). However, these measurements may not well characterize the unique functional architecture of an individual brain. Second, group analysis is complicated by the large cross-subject variability of structure-function relationship, which reduces the power to detect group effects in functional studies. To address these issues, here we derive a functional density map and an edge map from fMRI data to characterize the functional connectivity pattern in individuals, and use these maps to establish functional correspondence across subjects for group analysis. The functional density map quantifies and summarizes functional connectivity strength at each location on the cortex. A cortical location will have a large density value if it is strongly connected to a large number of other locations. The functional edge map derived from the functional density maps was inspired by the work of Gordon et al. (2014). It models the transitions in functional connectivity patterns and corresponds to functional boundaries. Large values in an edge map indicate sharp change of functional connectivity patterns. Using data from 100 unrelated subjects distributed by the Human Connectome Project (HCP) WU-UMinn Corsortium (Van Essen et al., 2013), we demonstrate that:
The functional density and edge maps are unique at the individual level and capture functional variation across subjects, and thus can serve as functional fingerprints to identify subjects from a large population;
Individual functional density and edge maps can be used to establish functional correspondence across subjects and produce sharp group averages. The group-average functional density and edge maps are highly reproducible across independent samples;
Cross-subject alignment using functional maps derived from resting-state fMRI improves the alignment of task activations across subjects. These functional maps can be used as promising measures for driving the functional alignment in order to remove inter-subject functional variations and to establish functional correspondence across subjects for group analysis.
These results suggest that the proposed functional density and edge maps capture intrinsic properties of subject-specific functional connectivity patterns, and have the potential to characterize functional variation in the population, improve function-based cross-subject alignment and increase the power of group-level inferences.
2. Materials and Methods
2.1. Data
A data set of 100 unrelated young and healthy subjects was downloaded from the HCP WU-Minn Consortium (Van Essen et al., 2013). Multimodal MR images, including T1-weighted and T2-weighted imaging, fMRI and diffusion-weighted imaging were collected from all subjects on a customized Siemens 3T Connectome Skyra scanner using HCP’s acquisition protocol (Van Essen et al., 2012). Structural images were acquired using a 3D MPRAGE T1-weighted sequence with 0.7 mm isotropic resolution. Other parameter settings included: TR = 2,400 ms; TE = 2.14 ms; TI = 1,000 ms; flip angle = 8°. Two resting-state and seven task fMRI sessions were collected for each subject. The tasks included working memory (WM), gambling, motor, language, social cognition, relational processing and emotional processing. In each session, two runs were acquired using single-shot EPI with alternating (left-to-right, LR and right-to-left, RL) phase encoding directions. The two resting sessions were acquired on separate days with the following scanning parameters: TR = 720 ms; TE = 33.1 ms; flip angle = 52°; slice thickness = 2.0 mm; 72 slices; 2 mm isotropic voxels; multiband factor = 8; matrix size = 104 × 90; partial Fourier = 6/8; echo spacing = 0.58 ms; bandwidth (BW) = 2,290 Hz/px; time points = 1,200. The acquisition protocol of the task sessions was identical to that of the resting sessions to achieve maximal compatibility between task and resting data. Full details about subject recruitment and MRI data acquisition can be found in (Smith et al., 2013; Barch et al., 2013).
2.2. Preprocessing
The HCP minimal preprocessing pipeline (Glasser et al., 2013) was utilized to process the data set, which included artifact removal, motion correction and alignment to standard space using cortical folding features. Software used by this pipeline included FSL (FMRIB’s Software Library) (Jenkinson et al., 2012), FreeSurfer (Fischl, 2012), and the Connectome Workbench (Marcus et al., 2013). Specifically, the processing of structural MRI comprised the PreFreeSurfer (Jovicich et al., 2006; van der Kouwe et al., 2008), FreeSurfer recon-all (Dale et al., 1999; Fischl et al., 1999a,b, 2001, 2002; Ségonne et al., 2007) and PostFreeSurfer steps (Glasser et al., 2014), and the cortical and subcortical fMRI signals were processed separately in fMRISurface (Glasser et al., 2013) and fMRIVolume (Andersson et al., 2003; Greve and Fischl, 2009) pipelines. fMRI data were resampled onto a standard “grayordinate” space, which used a surface representation with 32,492 vertices on each hemisphere. The fMRI time series were then temporally demeaned and linearly detrended within each run, followed by a bandpass filtering (0.01–0.08 Hz). Next, the whole-brain signal was regressed out and surface-based smoothing using a Gaussian kernel with 6mm full-width at half-maximum (FWHM) was applied. Finally, two runs within each resting-state or task session were concatenated.
2.3. Calculation of functional density and edge maps
Given a cortical mesh P with N vertices, in order to calculate a density value for each vertex, we first constructed a weighted graph by connecting all neighboring vertices of the mesh and computing the Pearson distance between each pair of neighboring vertices i and j:
| (1) |
where yi and yj are the normalized fMRI time series and denotes the standard inner product. The shortest path between each pair of vertices through the weighted graph was then computed and defined as their geodesic distance (Honnorat et al., 2015). The geodesic distance between two vertices reflects the dissimilarity of their time series through the surface. However, it should be mentioned that the geodesic distance is also affected by the spatial distance since it is the accumulated sum along the shortest path. Tow vertices with a long spatial distance are more likely to have a large geodesic distance. The density value at vertex i can then be computed using a Gaussian kernel (Rodriguez and Laio, 2014):
| (2) |
where is the geodesic distance between vertex i and vertex k, N is the total number of vertices, and dc is a free parameter. The parameter a was set to 1 and the parameter b was set to zero as suggested in Rodriguez and Laio (2014). It can be seen that a vertex which is functionally similar to other vertices (i.e., has short geodesic distances to other vertices) tends to have a larger density value. In the present study, for each subject, the parameter dc was set to the top 0.1% smallest geodesic distance for each subject since we found that with this parameter setting the functional density map can capture fine details in the functional architecture. Figure 1 shows examples of the functional density map. Vertices within each functionally homogeneous region have high density while vertices near the boundary of functional regions have low density values. Although the top 0.1% smallest geodesic distance appears to be a good choice for dc when calculating the functional density map, functional organization at different scales can be observed when other values of dc are used, which may provide additional information for functional analysis. Therefore, we calculate a functional edge map in order to utilize the multi-scale information in the functional density map. Specifically, a watershed segmentation method (Beucher and Lantuéjoul, 1979; Gordon et al., 2014) was applied to the functional density maps computed at a range of dc values, generating binary edges at different scales. A cross-scale functional edge map can then be obtained by averaging the functional edges across scales.
Figure 1.
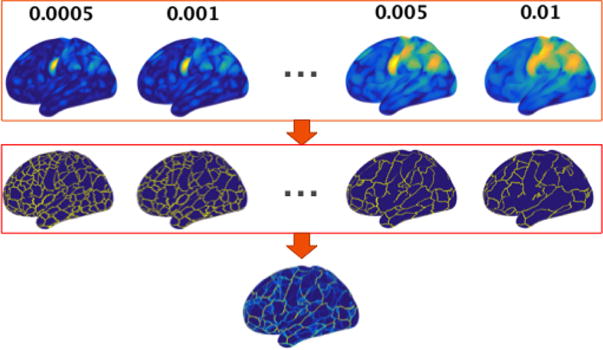
Calculation of the functional edge map using multi-scale information from the functional density maps. When calculating the functional density map, the parameter dc was set such that the effective number of neighboring vertices corresponds to 0.1% of the total number of vertices on the surface. When calculating the functional edge map, the parameter dc was set at the following values: {0.05%, 0.1%, 0.2%, 0.3%, 0.4%, 0.5%, 0.6%, 0.7%, 0.8%, 0.9%, 1%}. These values were used to extract fine to coarse scale information from the functional connectivity patterns. The second row shows the binary edge map derived from each functional density map with different values of dc. A multi-scale functional edge map can be obtained by averaging the binary edge maps across scales.
2.4. Individual identification
We used two resting-state fMRI sessions on separate days (denoted as R1 and R2) and four task fMRI sessions (motor, language, working memory, and emotion) collected from each subject. When using the functional maps derived from session X to predict the identities of subjects in session Y, we first computed a functional map (density map or edge map) for each session of each subject. Then for a particular subject in session Y whose identity was considered unseen, the similarity between the subject’s functional map and each functional map in session X was calculated. The subject was assigned the identity of the subject in session X who had the largest similarity measure. This procedure was repeated for all subjects in session Y. In this work, Pearson correlation between functional maps was used as the similarity measure. The prediction accuracy was calculated as the ratio of the number of subjects whose identities were correctly predicted to the total number of subjects.
2.5. Generation of sharp group-average maps
We concatenated two resting-state sessions and computed the functional density and edge maps for each subject in the MSM-Sulc registered space (Robinson et al., 2014). We then employed the Spherical Demons (SD) method (Yeo et al., 2010) to further align subjects, using the proposed functional maps as features and default parameters in the MATLAB implementation of the SD algorithm. The group-level density and edge maps were calculated by averaging registered functional maps. We also performed a group parcellation by applying the watershed technique (Beucher and Lantuéjoul, 1979) to the group average of functional edge maps. The watershed method provided an initial delineation of over 800 small parcels. For each boundary of the parcels, the average value of the functional edge map along the boundary was calculated. A large average value indicates a sharp boundary between two parcels while a small value indicates a weak boundary. Parcels were then fused iteratively until a predefined number of parcels was achieved. Specifically, in each iteration, two adjacent parcels were fused if the average boundary value between them was the smallest among all edges, that is, two parcels that had the most similar functional density values were fused. The number of parcels was set in the range of {75,100,125,150,175,200}. The Dice coefficient was calculated between the parcellation results of two groups. A high Dice value indicates high reproducibility of the parcellation results. The final number of parcels was set to 150 in this work. This number was selected according to the highest Dice value between two independent groups.
2.6. Functional correspondence between different contrasts
We hypothesized that the proposed functional maps can capture the functional organization of the cortex across different conditions. Therefore, we evaluated whether cross-subject alignment using functional maps derived from resting-state fMRI improved the alignment of task activations. The fMRI data from HCP has been registered to a common space using the MSM-Sulc registration to remove anatomical variation, which provides an initialization for the functional alignment. In the present work, we refined the MSM-Sulc registration by using the SD algorithm (Yeo et al., 2010), and the proposed functional density maps derived from resting-state fMRI as features to drive the alignment. The resulting transformations were then applied to the corresponding task activation maps. We compared this registration to two methods proposed in (Robinson et al., 2014): (1) MSM-Sulc, which uses anatomical features for registration; and (2) MSM-All, which uses anatomical features, myelin (T1/T2) map and resting-state fMRI features for registration. For each of these registration methods, we calculated a group-average activation map in the registered space. For the registration algorithm that best aligns the task data, the group-average task activation map should be most representative of the individual activation maps. We therefore computed the correlations between the group-average map and the registered individual activation maps for each of the three registration algorithms across 86 contrasts derived from seven tasks. Higher average correlation coefficient across subjects for each contrast indicates more accurate alignment of the task activation maps. For each contrast, a paired t-test was used to assess if the correlations between two registration methods were significantly different.
3. Results
3.1. Functional variation across subjects and conditions
Figure 2 shows functional density maps (A, upper panel) and functional edge maps (B, upper panel) computed from the resting-state fMRI data of two randomly selected subjects. The functional density map reflects the connectivity strength at each cortical location. Large density values are observed in the somato-motor region, the sensory speech area and the primary visual cortex. For each pair of subjects, we correlated the functional maps computed from the two resting-state sessions. As shown in Figure 2, for both functional maps, intra-subject inter-session correlations are significantly higher than inter-subject correlations using the paired t-test, indicating that the proposed functional maps are reproducible across repeated sessions for the same subject and capture intersubject variation in the functional architecture.
Figure 2.
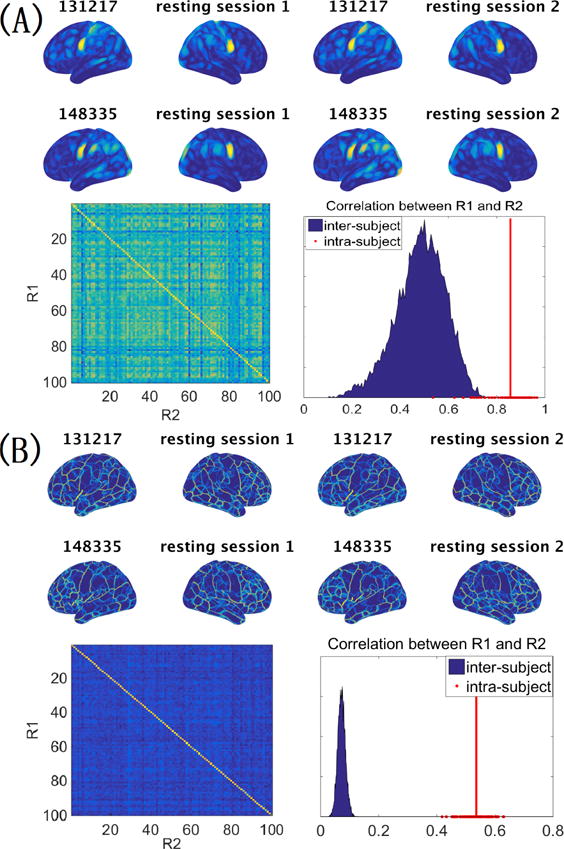
The functional density and edge maps derived from resting-state fMRI are unique at the individual level. (A) Functional density maps computed from the two resting-state fMRI sessions of two randomly selected subjects (upper panel). When correlating the functional density maps of two resting-state sessions for each pair of subjects, intra-subject correlations are much higher than inter-subject correlations (lower panel). (B) Comparison of the functional edge maps computed from different subjects (upper panel), and the comparison of intra-subject inter-session variation and inter-subject variation of the functional edge map (lower panel). In both (A) and (B), the red line corresponds to the average of the intra-subject correlations.
Figures 3 and 4 respectively show the functional density and edge maps of the same subject computed from different resting-state and task sessions. Changes to the functional maps across conditions can be clearly observed. The functional maps of all the 100 subjects in different conditions can be found at https://youtu.be/p2tHOv0v3Bg and https://youtu.be/Jn6sB1yHUs4. These figures show that both the connectivity strength and the transition of functional connectivity patterns are affected when subjects perform different tasks. However, intra-subject correlations between different rest-task or task-task pairs are much higher than inter-subject correlations as shown in Figure 3 and Figure 4.
Figure 3.
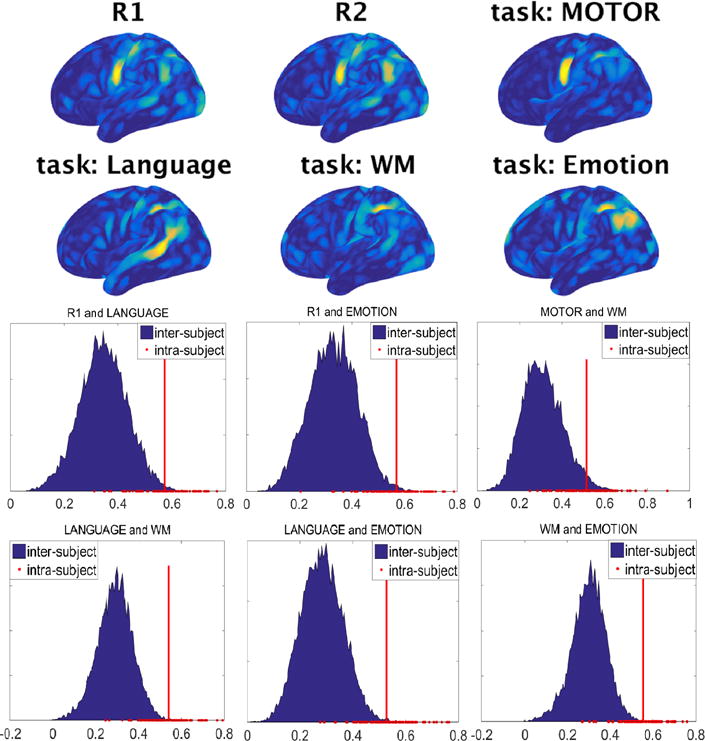
The functional density maps capture intrinsic properties of the functional organization across resting and task conditions. Intra-subject correlations of the functional density maps between different rest-task and task-task pairs are significantly higher than inter-subject correlations. In all panels, the red line corresponds to the average of the intra-subject correlations.
Figure 4.
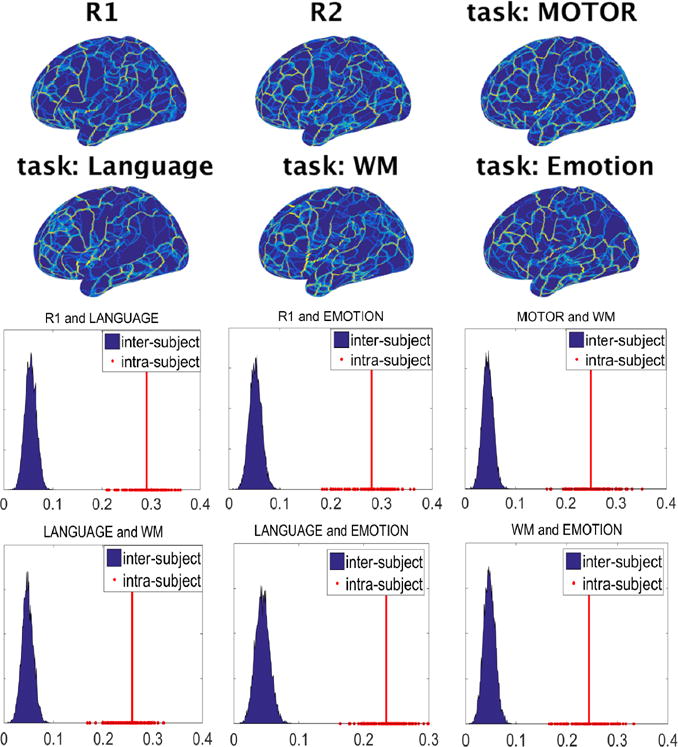
The functional edge maps reflect the functional boundaries between different functional regions across resting and task conditions. Intra-subject correlations of the functional edge maps between different rest-task and task-task pairs are significantly higher than inter-subject correlations. In all panels, the red line corresponds to the average of the intra-subject correlations.
3.2. Identification of individual subjects
We first predicted the identity of individuals using the proposed functional maps computed from resting-state fMRI sessions. Using the functional density map as features, the prediction accuracy was 0.99 when R1 was treated as unseen data and R2 as the database. The accuracy was 0.96 when predicting R2 using R1. When the functional edge map was used as features, both prediction accuracies increased to 100%. The identity prediction was also carried out using different rest-task (i.e., the R1-WM pair or the R2-emotion pair) and task-task pairs (i.e., the WM-emotion pair or the motor-language pair). The prediction accuracy ranged from 83% to 98% when the functional density map was used as features. When the functional edge map was used, we achieved perfect prediction accuracy in all rest-task and task-task pairs.
3.3. Sharp and robust group-averaged maps
Figure 5 (left column) shows the group-average functional maps in the MSM-Sulc registered space. These maps were quite blurry, indicating that functional regions of different subjects were not well aligned after structure-based registration. When we refined the MSM-Sulc registration using the SD algorithm with the functional maps as features, the group-average functional maps became sharper after each iteration of the SD algorithm (Figure 5).
Figure 5.
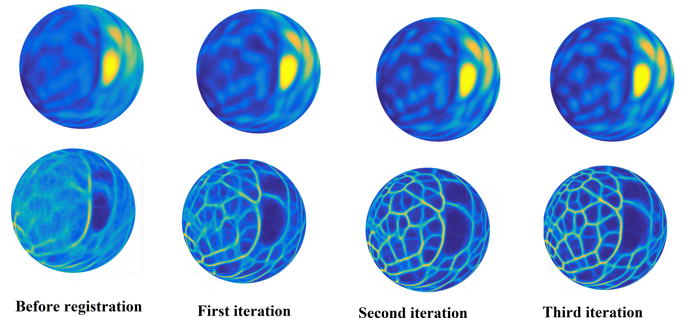
Functional map based registration improves functional alignment. Group-average functional maps in the MSM-Sulc registered space (sulcal depth based registration) were blurry (left column). Group-average functional maps became sharper after each iteration of the Spherical Demons (SD) algorithm driven by the proposed functional maps. The top row shows the registration driven by the functional density map, while the bottom row shows the registration driven by the functional edge map.
We then randomly split the 100 subjects into two independent groups and computed the average functional maps of the two groups (Figure 6, top and middle). The correlation between the average functional density maps of the two independent groups was 0.997, and the correlation between the two functional edge maps was 0.987, indicating high reproducibility of the proposed functional maps at the population level. The high reproducibility of these functional maps also ensured the robustness group-level parcellations: when the total number of parcels was set to 150 (Figure 6, bottom), a Dice coefficient of 0.916 was achieved between the parcellations derived from the two independent groups, which is comparable to those of the state-of-the-art parcellation results (Shen et al., 2013; Parisot et al., 2016; Wang and Wang, 2016).
Figure 6.
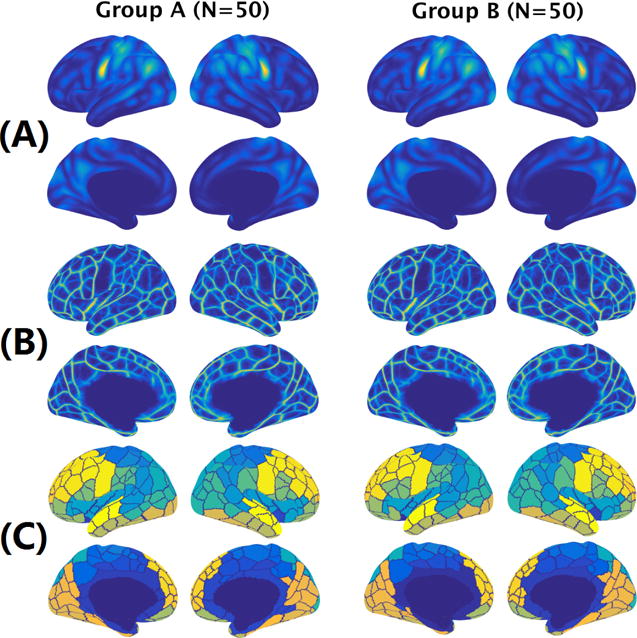
Group-average functional density and edge maps are highly reproducible. (A) The average functional density maps computed from two independent groups. The correlation between the two density maps was 0.997. (B) The average functional edge maps computed from two independent groups. The correlation between the two density maps was 0.987. (C) Cortical parcellations derived from the average functional edge maps with the number of parcels set to 150. A Dice coefficient of 0.916 was achieved between the parcellations derived from the two independent groups.
3.4. Improved correspondence with task activations
As shown in Figure 7, MSM-All registration significantly improved the alignment of task activations over MSM-Sulc registration across all the 86 contrasts (all paired t-test p < 0.01), suggesting that the additional features utilized in the MSM-All registration (i.e., the myelin map and features computed from resting-state fMRI) improved the alignment of functional organization across subjects (Robinson et al., 2014). Our proposed functional alignment method using the functional density maps computed from resting-state fMRI can further significantly improve the alignment of task data over MSM-All registration across all the 86 contrasts (all paired t-test p < 0.01). In addition, an average distortion map was calculated as described in Robinson et al. (2014). Figure 8 shows the comparison of distortion maps using different approaches. It can be seen that the three approaches, which utilized different features for registration, are very different in the amount of areal distortion. The proposed density-driven alignment has larger areal distortions over cortex than the other two approaches. However, we note that it is difficult to assess which level of distortion is needed to achieve functional homology.
Figure 7.
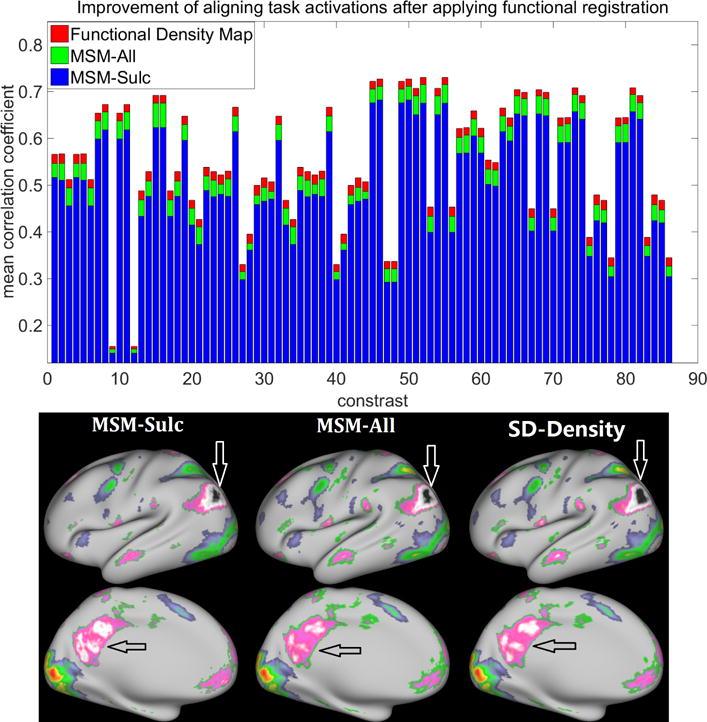
The alignment of resting-state fMRI data using the functional density map improves the alignment of task activations. The average correlations between the group-average activation map and individual activation maps after registration (MSM-Sulc, blue; MSM-All, green; proposed functional density map based registration, red) across 86 task contrasts are shown in the top panel. The bottom panel shows the group activation results for the Gambling task: reward contrast after the registration.
Figure 8.
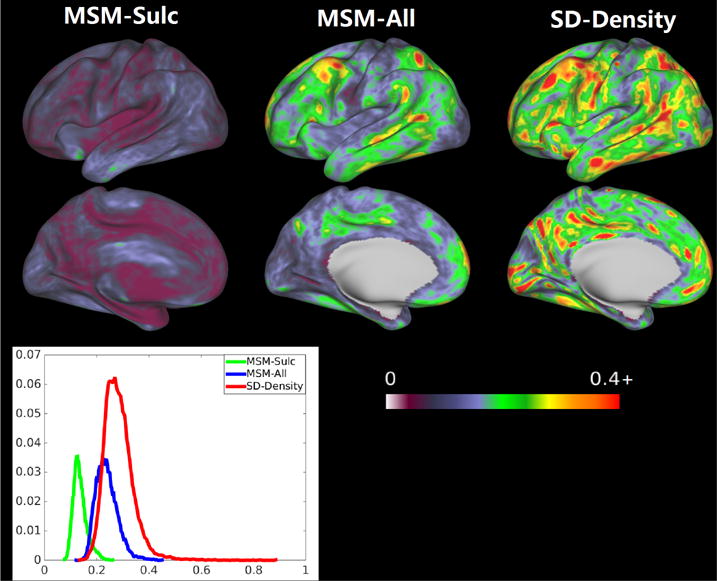
The comparison of distortion maps using different approaches. The three approaches, which utilized different features for registration, are very different in the amount of areal distortion.
4. Discussion
In this work, we have proposed functional density and edge maps and shown that they are robust and reproducible within subjects, and can capture the unique functional architecture of individuals across resting-state and different task conditions. Therefore, they can be used as functional fingerprints to identify subjects from a large population. Cross-subject registration driven by these functional maps produced robust group-average functional maps and group-level parcellations, and improved the functional correspondence between resting-state and task activations in every contrast that we tested.
4.1. Individual variability in function
The human brain of each individual is unique in anatomy and function, thus making us think or behave differently. Recent advances in fMRI acquisition (e.g., higher field strength and faster acquisition) (Setsompop et al., 2012; Feinberg and Setsompop, 2013; Kirilina et al., 2016) have improved the SNR of functional images, allowing for more reliable characterization of brain function at the individual level. Using resting-state fMRI, recent studies have shown that individual attention ability (Rosenberg et al., 2016), personality (Yarkoni, 2015), intelligence (Finn et al., 2015) and aging (Geerligs et al., 2015) are highly related with the differences of individual brain function.
In this work, we derived the functional density and edge maps to characterize the individual functional architecture and compare individual differences in function. The functional density map reflects the connectivity strength at each cortical location while the functional edge map captures the transition of functional connectivity patterns. We have shown that variation of functional maps exists both within and across subjects. Intra-subject variation is potentially due to factors such as motion, metabolic state, fluctuating hormones and fMRI acquisition settings. A recent study (Laumann et al., 2015), which repeatedly scanned a subject over one year, demonstrated that over 9 mins of fMRI data can generate respectable reproducibility at the individual level. Using the resting-state fMRI data from the HCP with approximately 30 mins for each session, the obtained intra-subject inter-session correlations of the proposed functional maps are significantly higher than inter-subject correlations. When performing a specific task, the connectivity strength and transition of the functional connectivity pattern may change dramatically. However, functional maps also capture intrinsic properties of brain function, which are stable across different conditions. Therefore, intra-subject correlations of rest-task pairs and task-task pairs are still much higher than inter-subject correlations.
4.2. Prediction of individual identity
The intra-subject reliability and inter-subject variation of functional neuroimaging data allows us to identify an individual from a large population. In (Finn et al., 2015), the connectivities between 268 regions spanning the whole brain were used as features to predict the identity of individuals. There are two drawbacks in this method: (1) it requires a group parcellation of the brain to calculate functional connectivity features for prediction, and the prediction accuracy dramatically decreased if a coarse level of group parcellation (e.g., (Yeo et al., 2011)) was used; (2) each individual has a unique functional architecture as shown in our work and other studies (Wang et al., 2015). Applying a group-level parcellation to individuals may not well capture functional variability across subjects, which is the basis of identity prediction. In this work, we computed functional density or edge maps for each subject to encode functional variability for the prediction of individual identities, while obviating the need for a group parcellation for the prediction. In different pairs of rest-rest and rest-task sessions, the prediction accuracy ranged from 83% to 98% when the functional density map was used as features. We achieved perfect accuracy when the functional edge map was used. The improvement of the prediction accuracy using the functional edge map over the functional density map may be attributable to the multi-scale information in the functional edge map in contrast to the single-level information in the functional density map. These results suggest that individuals have unique and inherent functional architectures, which are preserved in both resting-state and task conditions. We note that although the effect of anatomical difference was minimized by cross-subject registration using anatomical features, the prediction accuracy may be affected by residual anatomical difference. The proposed functional maps may contain residual anatomical variation as well. The preprocessing steps including the volume-to-surface mapping, smoothing, and motion correction can potentially affect the prediction accuracy. We carried out an additional experiment to investigate whether smoothing affects the accuracy of individual identity prediction. After removing the smoothing step in the preprocessing, the prediction accuracy was 0.97 when predicting R2 using R1 and also 0.97 when predicting R1 using R2. These results are consistent with those presented in Section 3.2, which demonstrates the robustness of the proposed functional maps.
4.3. Functional alignment for group analysis
The high inter-subject variation as described above imposes challenges on robust group-level functional analysis. It is essential to establish functional correspondence across subjects before statistical analysis at the group level. As noticed by prior studies, registrations driven by cortical folding patterns may lead to suboptimal alignment or misalignment of function in many regions of the brain (Fischl et al., 2008), and result in blurring functional maps at the group level. Weak boundaries between small areas may not be detectable if the connectivities are averaged over functionally dissimilar vertices. This will lead to less accurate analysis at the group level. In order to improve the alignment in function, Sabuncu et al. (2010) proposed to refine inter-subject alignment by using task fMRI data collected during movie watching. Although this improved functional alignment, it required consistent task activations by using a shared external stimulus. Robinson et al. (2014) showed a significant improvement in functional alignment by using resting-state fMRI measurements derived from Independent Component Analysis (ICA) (Smith et al., 2013). However, 26 ICA components as used in (Robinson et al., 2014) do not cover the entire cortex, reducing the spatial resolution of the data. Thus, features derived from ICA components may lose spatial information and not fully characterize individual functional organization. In a recent work (Nenning et al., 2017), spectral maps were derived, from functional connectivity of resting-state fMRI, which served as promising features for improving the functional alignment of task activations. In this work, the functional alignment was driven by the proposed functional density and edge maps. After registration, sharp group-average maps were obtained, which can be used in robust group-level analysis (e.g., group-level parcellation).
4.4. Functional correspondence between different tasks
The inherent properties of the brain in both resting and task conditions may manifest in the correspondence between functional connectivity measurements derived from resting-state and task data. Here we have shown that the alignment of the proposed functional density maps obtained from resting-state fMRI improved the alignment of task activations that we quantified. The correspondence between different types of data allows the prediction of individual task activations from task-free measurements such as resting-state features (Tavor et al., 2016) or diffusion measurements (Osher et al., 2016). In addition, an improvement of the alignment of task activations using the proposed method was achieved over the MSM-All registration method (Robinson et al., 2014). This indicates that the proposed functional density maps can characterize the inherent functional architecture of each individual, providing promising measures for the alignment of task activations.
4.5. Limitations and future work
Some interesting work could be further investigated in the future. First, only resting-state fMRI data was utilized in this study to establish functional correspondence across subjects. A combination of data from multiple modalities (e.g., myelin map and task fMRI data) may enhance the reliability of the functional alignment (Glasser et al., 2016), although the advantage of not using these modalities is that unbiased hypothesis testing is still possible for any measure that is not included in the registration. In addition, previous studies have shown that functional connectivity is dynamic and can change considerably over short periods of time (Hutchison et al., 2013). It would be interesting to investigate the dynamic changes of the proposed functional density maps and parcellation over time. Further, the present study only investigated the correspondence between resting-state fMRI measurements and task activations. Whether the alignment of resting-state fMRI data can improve the alignment of other imaging modalities, such as diffusion data, could be further studied in the future. Moreover, the proposed density maps can be easily computed from connectivities derived from diffusion tractography, which might further improve cross-subject registration and parcellation. Another limitation of the current study is that only 100 unrelated subjects from HCP were used for evaluation in this work. Evaluating our algorithm on a wider range of data will enhance the reproducibility of the proposed method. It would be interesting to apply the proposed method to a larger data set (e.g., the 1200 subjects released very recently by the HCP) or other data sets in future studies.
Acknowledgments
This work was supported by the National Institutes of Health (NIH) R01 grant (Principal Investigator: B. Fischl; 1R01EB019956-01A1), 1R01EB023281, P41-EB015896, R01-EB019437, NIH/NIDDK grant (K01DK101631), the Bright-Focus Foundation (A2016172S) and by the MGH/HST Athinoula A. Martinos Center for Biomedical Imaging. Computational resources were provided through NIH Shared Instrumentation Grants (S10RR023401, S10RR019307, S10RR023043). Data were provided by the Human Connectome Project, WU-Minn Consortium (Principal Investigators: David Van Essen and Kamil Ugurbil; 1U54MH091657) funded by the 16 NIH Institutes and Centers that support the NIH Blueprint for Neuroscience Research; and by the McDonnell Center for Systems Neuroscience at Washington University.
Footnotes
Publisher's Disclaimer: This is a PDF file of an unedited manuscript that has been accepted for publication. As a service to our customers we are providing this early version of the manuscript. The manuscript will undergo copyediting, typesetting, and review of the resulting proof before it is published in its final citable form. Please note that during the production process errors may be discovered which could affect the content, and all legal disclaimers that apply to the journal pertain.
References
- Andersson JL, Skare S, Ashburner J. How to correct susceptibility distortions in spin-echo echo-planar images: application to diffusion tensor imaging. NeuroImage. 2003;20(2):870–888. doi: 10.1016/S1053-8119(03)00336-7. [DOI] [PubMed] [Google Scholar]
- Barch DM, Burgess GC, Harms MP, Petersen SE, Schlaggar BL, Corbetta M, Glasser MF, Curtiss S, Dixit S, Feldt C, et al. Function in the human connectome: task-fMRI and individual differences in behavior. Neuroimage. 2013;80:169–189. doi: 10.1016/j.neuroimage.2013.05.033. [DOI] [PMC free article] [PubMed] [Google Scholar]
- Beucher S, Lantuéjoul C. International Workshop on Image Processing: Real-time Edge and Motion Detection/Estimation. Rennes, France: 1979. Use of watersheds in contour detection. [Google Scholar]
- Conroy BR, Singer BD, Guntupalli JS, Ramadge PJ, Haxby JV. Inter-subject alignment of human cortical anatomy using functional connectivity. NeuroImage. 2013;81:400–411. doi: 10.1016/j.neuroimage.2013.05.009. [DOI] [PMC free article] [PubMed] [Google Scholar]
- Dale AM, Fischl B, Sereno MI. Cortical surface-based analysis: I. Segmentation and surface reconstruction. NeuroIOmage. 1999;9(2):179–194. doi: 10.1006/nimg.1998.0395. [DOI] [PubMed] [Google Scholar]
- Feinberg DA, Setsompop K. Ultra-fast MRI of the human brain with simultaneous multi-slice imaging. Journal of Magnetic Resonance. 2013;229:90–100. doi: 10.1016/j.jmr.2013.02.002. [DOI] [PMC free article] [PubMed] [Google Scholar]
- Finn E, Shen X, Scheinost D, Rosenberg M, Huang J, Chun M, Pa-pademetris X, Constable R. Functional connectome fingerprinting: identifying individuals using patterns of brain connectivity. Nature Neuroscience. 2015;18(11):1664–1671. doi: 10.1038/nn.4135. [DOI] [PMC free article] [PubMed] [Google Scholar]
- Fischl B. FreeSurfer. NeuroImage. 2012;62(2):774–781. doi: 10.1016/j.neuroimage.2012.01.021. [DOI] [PMC free article] [PubMed] [Google Scholar]
- Fischl B, Dale AM. Measuring the thickness of the human cerebral cortex from magnetic resonance images. Proceedings of the National Academy of Sciences. 2000;97(20):11050–11055. doi: 10.1073/pnas.200033797. [DOI] [PMC free article] [PubMed] [Google Scholar]
- Fischl B, Liu A, Dale AM. Automated manifold surgery: constructing geometrically accurate and topologically correct models of the human cerebral cortex. IEEE Transactions on Medical Imaging. 2001;20(1):70–80. doi: 10.1109/42.906426. [DOI] [PubMed] [Google Scholar]
- Fischl B, Rajendran N, Busa E, Augustinack J, Hinds O, Yeo BT, Mohlberg H, Amunts K, Zilles K. Cortical folding patterns and predicting cytoarchitecture. Cerebral Cortex. 2008;18(8):1973–1980. doi: 10.1093/cercor/bhm225. [DOI] [PMC free article] [PubMed] [Google Scholar]
- Fischl B, Salat DH, Busa E, Albert M, Dieterich M, Haselgrove C, Van Der Kouwe A, Killiany R, Kennedy D, Klaveness S, et al. Whole brain segmentation: automated labeling of neuroanatomical structures in the human brain. Neuron. 2002;33(3):341–355. doi: 10.1016/s0896-6273(02)00569-x. [DOI] [PubMed] [Google Scholar]
- Fischl B, Sereno MI, Dale AM. Cortical surface-based analysis: Ii: inflation, flattening, and a surface-based coordinate system. Neuroimage. 1999a;9(2):195–207. doi: 10.1006/nimg.1998.0396. [DOI] [PubMed] [Google Scholar]
- Fischl B, Sereno MI, Tootell RB, Dale AM, et al. High-resolution intersubject averaging and a coordinate system for the cortical surface. Human Brain Mapping. 1999b;8(4):272–284. doi: 10.1002/(SICI)1097-0193(1999)8:4<272::AID-HBM10>3.0.CO;2-4. [DOI] [PMC free article] [PubMed] [Google Scholar]
- Geerligs L, Renken RJ, Saliasi E, Maurits NM, Lorist MM. A brain-wide study of age-related changes in functional connectivity. Cerebral Cortex. 2015;25(7):1987–1999. doi: 10.1093/cercor/bhu012. [DOI] [PubMed] [Google Scholar]
- Gholipour A, Kehtarnavaz N, Briggs R, Devous M, Gopinath K. Brain functional localization: a survey of image registration techniques. IEEE Transactions on Medical Imaging. 2007;26(4):427–451. doi: 10.1109/TMI.2007.892508. [DOI] [PubMed] [Google Scholar]
- Glasser M, Coalson T, Robinson E, Hacker C, Harwell J, Yacoub E, Ugurbil K, Anderson J, Beckmann C, Jenkinson M, et al. A multi-modal parcellation of human cerebral cortex. Nature. 2016;536:171–178. doi: 10.1038/nature18933. [DOI] [PMC free article] [PubMed] [Google Scholar]
- Glasser MF, Goyal MS, Preuss TM, Raichle ME, Van Essen DC. Trends and properties of human cerebral cortex: correlations with cortical myelin content. NeuroImage. 2014;93:165–175. doi: 10.1016/j.neuroimage.2013.03.060. [DOI] [PMC free article] [PubMed] [Google Scholar]
- Glasser MF, Sotiropoulos SN, Wilson JA, Coalson TS, Fischl B, Andersson JL, Xu J, Jbabdi S, Webster M, Polimeni JR, et al. The minimal preprocessing pipelines for the Human Connectome Project. NeuroImage. 2013;80:105–124. doi: 10.1016/j.neuroimage.2013.04.127. [DOI] [PMC free article] [PubMed] [Google Scholar]
- Gordon EM, Laumann TO, Adeyemo B, Huckins JF, Kelley WM, Petersen SE. Generation and evaluation of a cortical area parcellation from resting-state correlations. Cerebral Cortex. 2014 doi: 10.1093/cercor/bhu239. [DOI] [PMC free article] [PubMed] [Google Scholar]
- Greve DN, Fischl B. Accurate and robust brain image alignment using boundary-based registration. NeuroImage. 2009;48(1):63–72. doi: 10.1016/j.neuroimage.2009.06.060. [DOI] [PMC free article] [PubMed] [Google Scholar]
- Honnorat N, Eavani H, Satterthwaite T, Gur R, Gur R, Davatzikos C. Grasp: geodesic graph-based segmentation with shape priors for the functional parcellation of the cortex. NeuroImage. 2015;106:207–221. doi: 10.1016/j.neuroimage.2014.11.008. [DOI] [PMC free article] [PubMed] [Google Scholar]
- Hutchison RM, Womelsdorf T, Allen EA, Bandettini PA, Calhoun VD, Corbetta M, Della Penna S, Duyn JH, Glover GH, Gonzalez-Castillo J, et al. Dynamic functional connectivity: promise, issues, and interpretations. NeuroImage. 2013;80:360–378. doi: 10.1016/j.neuroimage.2013.05.079. [DOI] [PMC free article] [PubMed] [Google Scholar]
- Im K, Lee JM, Lyttelton O, Kim SH, Evans AC, Kim SI. Brain size and cortical structure in the adult human brain. Cerebral Cortex. 2008;18(9):2181–2191. doi: 10.1093/cercor/bhm244. [DOI] [PubMed] [Google Scholar]
- Jenkinson M, Beckmann CF, Behrens TE, Woolrich MW, Smith SM. FSL. NeuroImage. 2012;62(2):782–790. doi: 10.1016/j.neuroimage.2011.09.015. [DOI] [PubMed] [Google Scholar]
- Jiang D, Du Y, Cheng H, Jiang T, Fan Y. Groupwise spatial normalization of fMRI data based on multi-range functional connectivity patterns. NeuroImage. 2013;82:355–372. doi: 10.1016/j.neuroimage.2013.05.093. [DOI] [PubMed] [Google Scholar]
- Jovicich J, Czanner S, Greve D, Haley E, van der Kouwe A, Gollub R, Kennedy D, Schmitt F, Brown G, MacFall J, et al. Reliability in multi-site structural MRI studies: effects of gradient non-linearity correction on phantom and human data. NeuroImage. 2006;30(2):436–443. doi: 10.1016/j.neuroimage.2005.09.046. [DOI] [PubMed] [Google Scholar]
- Kirilina E, Lutti A, Poser BA, Blankenburg F, Weiskopf N. The quest for the best: The impact of different EPI sequences on the sensitivity of random effect fMRI group analyses. NeuroImage. 2016;126:49–59. doi: 10.1016/j.neuroimage.2015.10.071. [DOI] [PMC free article] [PubMed] [Google Scholar]
- Laumann TO, Gordon EM, Adeyemo B, Snyder AZ, Joo SJ, Chen MY, Gilmore AW, McDermott KB, Nelson SM, Dosenbach NU, et al. Functional system and areal organization of a highly sampled individual human brain. Neuron. 2015;87(3):657–670. doi: 10.1016/j.neuron.2015.06.037. [DOI] [PMC free article] [PubMed] [Google Scholar]
- Liu T, Shen D, Davatzikos C. Deformable registration of cortical structures via hybrid volumetric and surface warping. Neuroimage. 2004;22(4):1790–1801. doi: 10.1016/j.neuroimage.2004.04.020. [DOI] [PubMed] [Google Scholar]
- Marcus DS, Harms MP, Snyder AZ, Jenkinson M, Wilson JA, Glasser MF, Barch DM, Archie KA, Burgess GC, Ramaratnam M, et al. Human Connectome Project informatics: quality control, database services, and data visualization. Neuroimage. 2013;80:202–219. doi: 10.1016/j.neuroimage.2013.05.077. [DOI] [PMC free article] [PubMed] [Google Scholar]
- Mueller S, Wang D, Fox MD, Yeo BT, Sepulcre J, Sabuncu MR, Shafee R, Lu J, Liu H. Individual variability in functional connectivity architecture of the human brain. Neuron. 2013;77(3):586–595. doi: 10.1016/j.neuron.2012.12.028. [DOI] [PMC free article] [PubMed] [Google Scholar]
- Nenning KH, Liu H, Ghosh SS, Sabuncu MR, Schwartz E, Langs G. Diffeomorphic functional brain surface alignment: Functional demons. Neuroimage. 2017 doi: 10.1016/j.neuroimage.2017.04.028. in press. [DOI] [PMC free article] [PubMed] [Google Scholar]
- Osher DE, Saxe RR, Koldewyn K, Gabrieli JD, Kanwisher N, Saygin ZM. Structural connectivity fingerprints predict cortical selectivity for multiple visual categories across cortex. Cerebral Cortex. 2016;26(4):1668–1683. doi: 10.1093/cercor/bhu303. [DOI] [PMC free article] [PubMed] [Google Scholar]
- Parisot S, Arslan S, Passerat-Palmbach J, Wells WM, Rueckert D. Group-wise parcellation of the cortex through multi-scale spectral clustering. Neuroimage. 2016;136:68–83. doi: 10.1016/j.neuroimage.2016.05.035. [DOI] [PMC free article] [PubMed] [Google Scholar]
- Robinson EC, Jbabdi S, Glasser MF, Andersson J, Burgess GC, Harms MP, Smith SM, Van Essen DC, Jenkinson M. MSM: A new flexible framework for multimodal surface matching. Neuroimage. 2014;100:414–426. doi: 10.1016/j.neuroimage.2014.05.069. [DOI] [PMC free article] [PubMed] [Google Scholar]
- Rodriguez A, Laio A. Clustering by fast search and find of density peaks. Science. 2014;344(6191):1492–1496. doi: 10.1126/science.1242072. [DOI] [PubMed] [Google Scholar]
- Rosenberg MD, Finn ES, Scheinost D, Papademetris X, Shen X, Constable RT, Chun MM. A neuromarker of sustained attention from whole-brain functional connectivity. Nature Neuroscience. 2016;19:165–171. doi: 10.1038/nn.4179. [DOI] [PMC free article] [PubMed] [Google Scholar]
- Sabuncu MR, Singer BD, Conroy B, Bryan RE, Ramadge PJ, Haxby JV. Function-based intersubject alignment of human cortical anatomy. Cerebral Cortex. 2010;20(1):130–140. doi: 10.1093/cercor/bhp085. [DOI] [PMC free article] [PubMed] [Google Scholar]
- Ségonne F, Pacheco J, Fischl B. Geometrically accurate topology-correction of cortical surfaces using nonseparating loops. IEEE Transactions on Medical Imaging. 2007;26(4):518–529. doi: 10.1109/TMI.2006.887364. [DOI] [PubMed] [Google Scholar]
- Setsompop K, Gagoski BA, Polimeni JR, Witzel T, Wedeen VJ, Wald LL. Blipped-controlled aliasing in parallel imaging for simultaneous multislice echo planar imaging with reduced g-factor penalty. Magnetic Resonance in Medicine. 2012;67(5):1210–1224. doi: 10.1002/mrm.23097. [DOI] [PMC free article] [PubMed] [Google Scholar]
- Shen X, Tokoglu F, Papademetris X, Constable RT. Groupwise whole-brain parcellation from resting-state fMRI data for network node identification. Neuroimage. 2013;82:403–415. doi: 10.1016/j.neuroimage.2013.05.081. [DOI] [PMC free article] [PubMed] [Google Scholar]
- Smith SM, Beckmann CF, Andersson J, Auerbach EJ, Bijsterbosch J, Douaud G, Duff E, Feinberg DA, Griffanti L, Harms MP, et al. Resting-state fMRI in the human connectome project. Neuroimage. 2013;80:144–168. doi: 10.1016/j.neuroimage.2013.05.039. [DOI] [PMC free article] [PubMed] [Google Scholar]
- Stephen S. Linking cognition to brain connectivity. Nature Neuroscience. 2016;19:7–9. doi: 10.1038/nn.4206. [DOI] [PubMed] [Google Scholar]
- Tavor I, Jones OP, Mars R, Smith S, Behrens T, Jbabdi S. Task-free MRI predicts individual differences in brain activity during task performance. Science. 2016;352(6282):216–220. doi: 10.1126/science.aad8127. [DOI] [PMC free article] [PubMed] [Google Scholar]
- van der Kouwe AJ, Benner T, Salat DH, Fischl B. Brain morphometry with multiecho MPRAGE. NeuroImage. 2008;40(2):559–569. doi: 10.1016/j.neuroimage.2007.12.025. [DOI] [PMC free article] [PubMed] [Google Scholar]
- Van Essen DC, Smith SM, Barch DM, Behrens TE, Yacoub E, Ugurbil K, Consortium W-MH et al. The WU-Minn human connectome project: an overview. NeuroImage. 2013;80:62–79. doi: 10.1016/j.neuroimage.2013.05.041. [DOI] [PMC free article] [PubMed] [Google Scholar]
- Van Essen DC, Ugurbil K, Auerbach E, Barch D, Behrens T, Bucholz R, Chang A, Chen L, Corbetta M, Curtiss SW, et al. The Human Connectome Project: a data acquisition perspective. NeuroImage. 2012;62(4):2222–2231. doi: 10.1016/j.neuroimage.2012.02.018. [DOI] [PMC free article] [PubMed] [Google Scholar]
- Wang D, Buckner RL, Fox MD, Holt DJ, Holmes AJ, Stoecklein S, Langs G, Pan R, Qian T, Li K, et al. Parcellating cortical functional networks in individuals. Nature Neuroscience. 2015;18:1853–1860. doi: 10.1038/nn.4164. [DOI] [PMC free article] [PubMed] [Google Scholar]
- Wang J, Wang H. A supervoxel-based method for groupwise whole brain parcellation with Resting-State fMRI data. Frontiers in Human Neuroscience. 2016;10 doi: 10.3389/fnhum.2016.00659. in press. [DOI] [PMC free article] [PubMed] [Google Scholar]
- Yarkoni T. Neurobiological substrates of personality: a critical overview. APA Handbook of Personality and Social Psychology. 2015;4:61–83. [Google Scholar]
- Yeo BT, Krienen FM, Sepulcre J, Sabuncu MR, Lashkari D, Hollinshead M, Roffman JL, Smoller JW, Zollei L, Polimeni JR, et al. The organization of the human cerebral cortex estimated by intrinsic functional connectivity. Journal of Neurophysiology. 2011;106(3):1125–1165. doi: 10.1152/jn.00338.2011. [DOI] [PMC free article] [PubMed] [Google Scholar]
- Yeo BT, Sabuncu MR, Vercauteren T, Ayache N, Fischl B, Golland P. Spherical demons: fast diffeomorphic landmark-free surface registration. IEEE Transactions on Medical Imaging. 2010;29(3):650–668. doi: 10.1109/TMI.2009.2030797. [DOI] [PMC free article] [PubMed] [Google Scholar]