

Summary
Malignant peripheral nerve-sheath tumors (MPNSTs) are highly aggressive Schwann cell (SC)-lineage-derived sarcomas. Molecular events driving SC-to-MPNST transformation are incompletely understood. Here, we show that human MPNSTs exhibit elevated HIPPO-TAZ/YAP expression, and that TAZ/YAP hyperactivity in SCs caused by Lats1/2 loss potently induces high-grade nerve-associated tumors with full penetrance. Lats1/2 deficiency reprograms SCs to a cancerous, progenitor-like phenotype and promotes hyper-proliferation. Conversely, disruption of TAZ/YAP activity alleviates tumor burden in Lats1/2-deficient mice and inhibits human MPNST cell proliferation. Moreover, genome-wide profiling reveals that TAZ/YAP-TEAD1 directly activates oncogenic programs including PDGFR signaling. Co-targeting TAZ/YAP and PDGFR pathways inhibits tumor growth. Thus, our findings establish a previously unrecognized convergence between Lats1/2-TAZ/YAP signaling and MPNST pathogenesis, revealing potential therapeutic targets in these untreatable tumors.
Keywords: Peripheral nerve sheath tumor, MPNST, tumor suppressor, Schwann cells, Lats1/2, Hippo signaling, TAZ, YAP, murine models, PDGF signaling
eTOC blurb
Wu et al. find that HIPPO-TAZ/YAP expression is elevated in malignant peripheral nerve sheath tumors (MPNST). Lats1/2 deficiency in Schwann cells induces hyperactivation of TAZ/YAP and increased PDGFR signaling, leading to the development of MPNST in mice. Inhibition of TAZ/YAP and PDGFR reduces MPNST growth.
INTRODUCTION
Malignant peripheral nerve sheath tumors (MPNSTs) are highly aggressive nerve-associated sarcomas with strong metastatic proclivity and resistance to radiation and chemotherapy (Farid et al., 2014; Stemmer-Rachamimov et al., 2004) that account for the leading cause of death in adult neurofibromatosis type 1 (NF1) patients. MPNSTs either occur independently or in association with the NF1 mutation (Farid et al., 2014). NF1 deficiency by itself is insufficient to induce MPNST. MPNST genomes variably show additional genetic aberrations, including the amplification of PDGFRA, EGFR, or MET and the loss of CDKN2A, RB, TP53 or the PRC2 components, SUZ12 or EED (Carroll, 2016). At present, the totality of genetic alterations and pathways responsible for NF1-asssociated and sporadic MPNST formation remains enigmatic.
It is generally accepted that MPNSTs derive from the Schwann cell (SC) lineage. Activation of several signaling pathways including RAS/RAF-MEK-ERK and PI3K/AKT/mTOR signaling in SCs contribute to MPNST growth. Inhibition of these pathways, however, blocks MPNST progression only to a limited extent (Farid et al., 2014). Though clinically useful biomarkers were identified in genetic screens (Hummel et al., 2010; Rahrmann et al., 2013), targetable pathways are still much needed in MPNSTs. The signaling mechanisms underpinning MPNST initiation and progression remain poorly understood.
A signaling pathway, HIPPO-YAP/TAZ signaling, has emerged as a central player in organ growth control and tumorigenesis (Harvey et al., 2013; Zanconato et al., 2016). The HIPPO signaling components Lats1 and Lats2, each encodes a tumor suppressive serine/threonine-protein kinase, phosphorylate their effectors TAZ/YAP, and thereby inhibit TAZ/YAP activity by preventing their translocation to the nucleus (Varelas, 2014). Nuclear TAZ and YAP interact with transcriptional partners, predominantly TEAD transcription factors, to regulate cell growth and maintain cellular homeostasis (Varelas, 2014). Sustained TAZ/YAP activation endows differentiated adult cells with an array of oncogenic hallmarks, including hyper-proliferation, chemoresistance, metastasis and cancer stem cell-related traits (Harvey et al., 2013; Zanconato et al., 2016).
Recent whole exome sequencing of peripheral nerve tumors identified a nonsense mutation in LATS1 (Kim et al., 2014). In addition, loss of a copy of either LATS1 or LATS2, or their promoter hypermethylation was detected in patients with peripheral nerve sheath tumors (Kim et al., 2014; Oh et al., 2015). Furthermore, whole-genome copy number variation analysis of a cohort of MPNST tissues indicated ~25% of patient samples as exhibiting copy number changes in HIPPO component genes (e.g. LATS2, TAZ, BIRC5 and CTGF) (Yang et al., 2011). Given that LATS1 and LATS2 mutations exist in human peripheral nerve tumors, here we sought to understand whether aberrant activation of the HIPPO effectors TAZ/YAP contributes to malignant transformation in peripheral nerve sheath tumors.
RESULTS
Elevation of HIPPO-TAZ/YAP signature gene expression in human MPNSTs
Gene set enrichment analysis (GSEA) of publicly available expression data from two MPNST patient cohorts, Jessen_cohort (GSE41747) and Kolberg_cohort (GSE66743) (Jessen et al., 2013; Kolberg et al., 2015), revealed a YAP conserved signature (Cordenonsi et al., 2011) as one of the top significantly enriched oncogenic gene sets in Molecular Signatures Database (MSigDB) (Subramanian et al., 2005) in MPNSTs, compared with normal nerves or NF1-neurofibromas (a precursor lesion for MPNST) (Figure 1A–C; Figure S1A,B). Moreover, GSEA identified a strong enrichment of YAP-activated signature (Tremblay et al., 2014) in MPNSTs from both cohorts (Figure S1C–E), suggestive of HIPPO-TAZ/YAP hyperactivity in MPNSTs. This was confirmed by the elevation of YAP-conserved and YAP-activated signature expression in MPNSTs relative to normal nerves or neurofibromas (Figure 1D–F). Notably, neither the YAP-conserved signature nor the YAP-activated signature was altered in expression in neurofibromas when compared with normal nerves (Figure 1D,E; Figure S1F). Activation of the HIPPO-TAZ/YAP pathway was detected in both NF1- and non-NF1 associated sporadic MPNSTs (Figure 1B,C,F), which exhibit similar YAP signature enrichment, suggesting that TAZ/YAP hyperactivity may act as a convergence point for MPNST pathogenesis regardless of the NF1 status.
Figure 1. HIPPO-TAZ/YAP signature is elevated in human MPNSTs.

(A) GSEA plots show normalized expression signature (NES) of YAP conserved signature in human MPNSTs and neurofibromas from Jessen cohort.
(B–C) GSEA plots of YAP conserved signature in human sporadic MPNSTs (n = 13) (B) or NF1-MPNSTs (n = 17) (C) versus neurofibromas (n = 8) from the Kolberg cohort.
(D–E) Expression score of YAP conserved signature (D) and YAP activated signature (E) gene sets in MPNST (n = 6), neurofibroma (n = 26) relative to normal nerves (n = 3) from the Jessen cohort.
(F) Expression score of YAP activated signature gene set in NF1-MPNST (n = 17), sporadic MPNSTs (n = 13) and neurofibroma (n = 8).
(G) Average expression of LATS1 and LATS2 in MPNST (n = 30), neurofibroma (n = 8) from the Kolberg cohort.
(H) Immunohistochemistry (IHC) for TAZ and YAP in human MPNSTs, neurofibroma and normal sciatic nerves. Scale bars, 100 µm.
(I) Proportions of TAZ+ cells in human nerves (n = 7), neurofibroma (n = 5) and MPNSTs (n = 7).
(J) Proportions of YAP+ cells in human nerves (n = 2), neurofibroma (n = 9) and MPNSTs (n = 12). >500 cells counted per sample for J and K.
(K) Immunostaining for TAZ/YAP and DAPI in normal human nerve or Sox10 in human neurofibroma and MPNST sections. Scale bars, 50 µm.
(L) Proportions of TAZ/YAP+ cells among Sox10+ SC cells in human neurofibroma (n = 3) and MPNST (n = 3). >1,500 cells counted per sample.
(M) Immunostaining for TAZ/YAP and S100β in human SC-derived MPNST SNF02.2 and SNF96.2 cell lines. Blue in merged image shows DAPI labeling of nuclei. Scale bars, 50 µm. Each data point is presented with mean ± SEM indicated (*p < 0.05; **p < 0.01; ***p < 0.001; One-way ANOVA with Tukey’s multiple comparisons test in B, C, F, I, and J; Student’s t-test in G and L.). See also Figure S1.
Consistently, we detected significantly reduced LATS1 and LATS2 expression in MPNST, compared with neurofibroma (Figure 1G). Furthermore, array CGH analysis from 51 MPNST samples (Yang et al., 2011) revealed an increase in the copy number of HIPPO effector gene loci, including TAZ, CTGF and BIRC5 and a loss of HIPPO inhibitory gene loci, such as LATS2 and AMOTL2 (Figure S1G).
In addition, we detected abundant nuclear TAZ and YAP expression in MPNST specimens, which displayed significantly higher proportions of TAZ+ and YAP+ cells than benign neurofibromas or normal nerves (Figure 1H–J), suggesting an elevation in YAP/TAZ expression selectively in MPNSTs, but not neurofibromas. Immunolabeling further revealed robust TAZ/YAP expression in Sox10+ SCs distinctively in human MPNST versus neurofibromas (Figure 1K–L), as well as in human SC-derived MPNST cell lines, SNF96.2 and SNF02.2 (Figure 1M), suggesting a cell-intrinsic expression of TAZ/YAP in MPNST tumor cells.
Lats1/2 ablation in the Schwann cell lineage leads to peripheral nerve sheath malignancies
To investigate the consequences of activation of both TAZ and YAP in SCs, the primary cell type of origin for MPNST, we ablated Lats1/2 by breeding Lats1fl/flLats2fl/fl mice (Heallen et al., 2011) with a SC lineage-expressing desert hedgehog promoter-driven Dhh-Cre (Jaegle et al., 2003). The Lats1/2-deficient mice carrying three copies of Lats1/2 deletion alleles (Lats1fl/flLats2fl/+:Dhh-Cre [Lats1 KO], or Lats1fl/+Lats2fl/fl:Dhh-Cre [Lats2 KO], collectively defined as Lats1/2-deficient mice) developed nerve-associated tumors with 100% penetrance.
Tumors arose in the dermis, spinal nerve roots and peripheral nerves, including the sciatic nerves (SNs). Pathological classification revealed that whereas tumors were all PNST, those in the dermis were largely low-grade (grade I PNST) (Figure 2A), but did not precisely resemble benign human neurofibroma or schwannoma due to their highly cellular and invasive features. Tumors from paraspinal regions, including nerve roots or dorsal root ganglia, and peripheral nerves were classified as aggressive, rapidly growing high-grade (grade III) GEM-PNSTs (Figure 2B–E; Figure S2A,B), resembling MPNSTs in humans (Stemmer-Rachamimov et al., 2004). The high-grade PNSTs consisted of densely packed cells with high cellularity entrapping muscle fibers, indicating strong invasiveness of tumor cells (Figure 2B,E). Some cells displayed enlarged nuclei and/or heterologous epitheloid differentiation, a feature of MPNST. Thus, the grade III GEM-PNSTs developed in anatomical locations corresponding to those observed in human MPNSTs. The maximum lifespan of Lats1/2-deficient mice was 4–5 months of age (Figure 2F,G).
Figure 2. Mice with Lats1/2 deficiency in the SC lineage develop low and high grade GEM PNST tumors.

(A–B) Appearance and H&E staining of low-grade tumors on the dermis (A) and high-grade GEMPNST tumors from spinal nerve roots (B) from Lats1fl/flLats2fl/+;Dhh-Cre (Lats1 KO) mice at 3 months. Arrows: atypical nuclei.
(C) Spinal nerve root dissection harboring a tumor (arrow).
(D) An enlarged sciatic nerve (arrow) from Lats1 KO. Scale bars in A,B, 100 µm; C,D; 2 mm.
(E) Appearance and/or H&E staining of dermal tumors and paraspinal/nerve-associated GEM-PNST from Latsfl/+Lats2fl/fl:Dhh-Cre (Lats2 KO) at 2 months. Red arrows: tumor masses. Scale bar, 100 µm.
(F) Kaplan-Meier survival curves for control (n = 38), Lats1 KO (n = 37) and Lats2 KO (n = 42) mice. Control vs Lats1 or Lats2 KO mice, p < 0.0001, Log-rank tests.
(G) Quantification of tumor phenotypes in Lats1/2-deficient mice.
(H) IHC for Sox10 and Ki67 in low- and high-grade GEM-PNSTs in Lats1/2-deficient mice at 3 months. Scale bars, 100 µm.
(I) IHC for TAZ and YAP in control nerves, and low- and high-grade GEM-PNSTs in Lats1/2-deficient mice at 3 months. Scale bars, 100 µm.
(J) Immunoblotting of sciatic nerve lysates from control, Lats1 and Lats2 KO mice.
(K) Immunostaining for Ki67 and Sox10 in control and Lats1/2-deficient sciatic nerves at P21 (arrows: co-labelled cells). Scale bar, 50 µm.
(L) Quantification of Ki67+ SCs in P21 control (n = 5) and Lats1/2-deficient (n = 3) sciatic nerves. Each data point is presented with mean ± SEM (***p < 0.001; Student’s t-test).
(M) H&E staining shows control sciatic nerves and Lats1/2-deficient grade III GEM-PNST at 3 months old. Scale bar, 50 µm.
See also Figures S2 and S3.
Lats1/2-deficient tumors that robustly expressed TAZ and YAP consisted primarily of Sox10+ SC lineage cells and were highly proliferative (Figure 2H,I). Consistently, Lats1 or Lats2 KO nerves exhibited augmented levels of TAZ, YAP and their DNA-binding co-factor partners such as TEAD1 (Figure 2J), and their downstream targets Ctgf, Cyr61, and Ccnd1 (Figure S2C). These data indicate that Lats1/2 deficiency activates TAZ/YAP expression and hyperproliferation in SCs.
Although SC proliferation, differentiation and myelination in mutant mice proceeded normally in the first postnatal week at P7 (Figure S2D–E), there was an increase in proliferative SCs in Lats deficient SNs at P21 compared to control (Figure 2K,L). Mutant animals started to develop palpable tumors around 3 weeks of age. Tumors in Lats1/2-deficient SNs also exhibited characteristics of grade III GEM-PNST with hyperplasia alongside a widespread amplification of atypical and large nuclei (Figure 2M).
We evaluated SC differentiation in Lats1/2 deficient SNs by co-labeling for the mature SC marker MBP (myelin basic protein) and Sox10. Mutant SNs exhibited substantially reduced MBP+ area, increased α-SMA (fibroblast antigen) and were populated by a massive expansion of Sox10+ SCs (Figure S3A–B). Ultrastructural analysis by electron microscopy (EM) detected myelin sheath loss in the adult Lats1/2-deficient nerves, with a notable increase in extracellular matrix deposition (Figure S3C). Moreover, non-myelinated axons became dissociated from Remak bundles in Lats1/2-deficient nerves (Figure S3D), consistent with nerve sheath tumor pathogenesis observed in other mouse models (Wu et al., 2008).
In contrast to the Lats1/2-deficient mice, no tumors were detected in adult mice carrying single Lats1 or Lats2 gene deletion (Lats1fl/fl:Dhh-Cre or Lats2fl/fl:Dhh-Cre) (Figure S3E), while double Lats1 and Lats2-null mice (Lats1fl/flLats2fl/fl:Dhh-Cre) were embryonically lethal, suggesting a dosage-dependent effect on tumor formation. This is consistent with functional redundancy of Lats1 and Lats2 in the HIPPO signaling pathway (Visser and Yang, 2010).
Mature SCs with Lats1/2 deficiency in adult mice develop nerve-associated tumors
The observation that SC differentiation and myelination at early postnatal stages appeared normal prompted us to question whether tumor cells could be derived from differentiated SCs. To test this, we ablated Lats1/2 in mature SCs by a tamoxifen inducible Plp1-CreERT in adult mice (Lats1fl/flLats2fl/+:Plp1-CreERT; termed Lats1/2-iDeficient; Figure 3A). Following tamoxifen induction, Plp1-CreERT specifically and efficiently induced Tomato reporter expression in Krox20+ mature myelinating SCs in the adult peripheral nerves carrying a CAG-Tomato floxed-STOP allele (Figure 3B).
Figure 3. Lats1/2-deficient SCs are highly tumorigenic.

(A) A tamoxifen administration scheme to Lats1/2-iDeficient mice. Tumors were harvested (SAC) 9–16 weeks post injection (wpi).
(B) Tomato reporter expression in Krox20+ mature SCs in adult sciatic nerves of Plp1-CreERT at 5 weeks post tamoxifen induction. Scale bar, 50 µm.
(C) Formation of a GEM-PNST tumor (arrow) in Lats1/2-iDeficient after tamoxifen-induction at 10 wpi. Scale bar, 2 cm.
(D) Kaplan-Meier survival curves for control (n = 7) and Lats1/2-iDeficient (n = 8). Log-rank test was used to calculate p value.
(E–F) Dermal (E) or paraspinal/nerve (F) tumors in control (n = 7), Lats1/2-iDeficient (n = 8) mice. Each data point is presented with mean ± SEM (p = 0.0002; Mann-Whitney test).
(G) H&E and immunostaining for Ki67, Sox10, and TAZ/YAP in a paraspinal tumor from a Lats1/2-iDeficient mouse (9 wpi). Scale bars, 25 µm.
(H) Tumor phenotype in Lats1/2-iDeficient mice (n = 7). Low grade tumors are cellular and invading surrounding muscles/fat; high grade tumors are highly cellular, invasive and harbour mitotic figures.
(I) Diagram of allograft transplantation with Lats1/2-deficient cells. Bottom: tumor latency per number of transplanted Lats1/2-deficient cells for the primary recipients.
(J) Primary tumor growth in nude mice implanted with 1 × 10⁵ Lats1/2-deficient cells into the flanks. n = 9 mice.
(K) H&E-staining and IHC for Ki67, Sox10 or TAZ/YAP of primary Lats1/2-deficient allografts. Scale bar, 50 µm.
(L) Secondary tumor growth in nude mice implanted with 1 × 10⁶ Lats1/2-deficient tumor cells into the flanks. Data are as mean ± SEM in J and L; n = 10 mice.
(M) H&E-staining and IHC for Ki67, Sox10 or TAZ/YAP of secondary Lats1/2-deficient allografts. Scale bar, 50 µm.
See also Figure S4.
Strikingly, Lats1/2-iDeficient adult mice developed aggressive nerve-associated tumors of Sox10+ SC origin after tamoxifen administration with full penetrance and a shortened life span (Figure 3C–D). All Lats1/2-iDeficient mice analyzed developed both dermal and paraspinal/nerve GEM-PNST, of low or high grade, characterized by hypercellularity, high proliferation, and extensive Sox10 and TAZ/YAP expression (Figure 3E–H), suggesting that Lats1/2 deficiency in mature differentiated SCs leads to GEM-PNST formation. Our data indicate that Lats1/2 loss-mediated dysregulation of HIPPO signaling can potently cause peripheral nerve malignancy in both immature and mature SCs.
Schwann cells with TAZ/YAP hyperactivation are highly tumorigenic
To characterize the molecular identity of Lats1/2-deficient SC cells, we additionally introduced a CAG-CAT-EGFP (ccGFP) reporter (Nakamura et al., 2006) into Lats1/2-deficient mice driven by SC-expressing Dhh-Cre (Lats1/2-deficient;ccGFPfl/+). Tumor cells dissociated from paraspinal nerve-associated tumors from Lats1/2-deficient;ccGFPfl/+ mice were capable of propagating as an adherent monolayer. Among the GFP+ tumor cells, approximately 55.3 ± 2.8% expressed both Sox10 and the stem-cell/progenitor marker Sox2 (Figure S4A,B), indicative of an undifferentiated immature SC-like phenotype. Notably, a fraction of GFP+ cells (15.5 ± 5.2%) were Sox2+Sox10−, which might represent a stem-cell like subpopulation among the Lats1/2-deficient tumor cells (Figure S4B). Further, the majority of GFP+ cells (81.5 ± 6.4%) expressed nuclear TAZ/YAP, confirming TAZ/YAP hyperactivation in S100β-expressing SCs when Lats1/2 were ablated (Figure S4C). These tumor cells harbored a monophasic, flattened and spindle morphology with enlarged nuclei (Figure S4D), and were highly proliferative (Figure S4E).
Next, we evaluated the tumorigenicity of Lats1/2-deficient SCs in an allograft model (Figure 3I). Dissociated mutant tumor cells from an early passage generated tumors in immunodeficient nude mice with 100% penetrance within as short as 7 days (Figure 3I, J). These tumors contained predominantly Sox10+ SCs, expressed TAZ/YAP and were proliferative (Figure 3K). They were histologically similar to human MPNST, showing hypercellularity and invasiveness, permeating into surrounding muscles (Figure 3K). Serial dilutions of single cell suspensions transplanting as few as 250 cells into nude mice propagated the same type of tumors with remarkably short latency (Figure 3I). Primary allograft-derived cells, when serially transplanted into secondary recipients, also propagated tumors that resembled aggressive MPNST (Figure 3L, M), indicating a highly aggressive nature of SC-derived tumor cells lacking tumor suppressive Lats1/2.
TAZ/YAP hyperactivation reprograms SC and is required for tumor cell growth
To investigate whether persistent TAZ/YAP hyperactivation was sufficient to reprogram or transform normal SCs into tumor cells, we ectopically expressed a phosphomutant TAZ (TAZ4SA) lacking all LATS phosphorylation sites or a YAP (YAPS112A) phosphomutant into primary rat SCs (Lei et al., 2008; Xin et al., 2013). Enforced expression of nuclear TAZ4SA or YAPS112A perceptibly altered the morphology of the transfected SCs into a flattened and elaborate shape with enlarged nuclei, which mimicked Lats1/2-deficient cells (Figure S5A). Moreover, SCs overexpressing TAZ4SA or YAPS112A exhibited little if any expression of SC marker Sox10 (Figure 4A, B), and became highly proliferative (Figure 4A,C). Our data suggest that escalated TAZ and YAP activity may de-differentiate and reprogram normal SCs into to a precursor/stem-like state to promote tumorigenesis.
Figure 4. siRNA-mediated and pharmacological TAZ/YAP inhibition effectively reduces Lats1/2-deficient tumor cell growth in vitro.

(A) Immunostaining for Ki67 and Sox10 in rat SCs transfected with vectors expressing GFP, TAZ4SA or YAPS112A for 48 hr. DAPI stains nuclei. Arrowheads: reduced Sox10 immunoreactivity. Scale bars, 50 µm.
(B–C) Proportions of Sox10+ (B) and Ki67+ (C) cells among transfected cells.
(D) qRT-PCR analysis of HIPPO effectors between si-control (si-ctl) and si-Taz/Yap1 knockdown Lats1/2-deficient paraspinal tumor cells.
(E) Immunolabeling for BrdU+ (pulse-labeling for 4 hr), Ki67+ and Sox10+ cells among tumor cells dissociated from Lats1/2-deficient paraspinal tumors. Scale bars, 100 µm.
(F–G) Proportions of Ki67+ (F) and BrdU+ (G) cells among Sox10+ Lats1/2-deficient tumor cells with knockdown of TAZ, YAP or both.
(H–I) Quantification of cleaved caspase 3+ (H) and cell density (I) of Lats1/2-deficient tumor cells with combined si-Taz and si-Yap1 knockdown after 72 hr in vitro.
(J) Immunolabeling for BrdU+ (4 hr pulse), Ki67+ and Sox10+ cells among Lats1/2-deficient tumor cells treated with verteporfin 2 µM or dobutamine 30 µM, and a control drug MK-0752 20 nM for 72 hr in vitro. Scale bars, 50 µm.
(K) Immunoblots for YAP and TAZ protein levels in Lats1/2-deficient tumor cells treated with verteporfin for 3 hr.
(L–M) Quantification of Ki67+ (L) and BrdU+ (M) cells in Lats1/2-deficient tumor cells treated with DMSO, verteporfin (V) 2 µM, dobutamine (D) 30 µM, and MK-0752 20 nM for 72 hr.
(N) qRT-PCR analysis of HIPPO effector genes between si-Ctrl and si-TAZ/YAP1 knockdown in SNF02.2 cells.
(O) Quantification of BrdU+ cells (12 hr pulse) in SNF02.2 cells with si-TAZ/YAP1 knockdown.
(P) qRT-PCR analysis of HIPPO effector genes between si-Ctrl and si-TAZ/YAP1 knockdown in SNF96.2 cells.
(Q) Quantification of BrdU+ cells (12 hr pulse) in SNF96.2 cells with si-TAZ/YAP1 knockdown. Data are as mean ± SEM from at least 3 independent experiments (*p < 0.05, **p < 0.01, ***p < 0.001; Student’s t-test in D, H, I, N, O, P, Q; One-way ANOVA with Tukey’s multiple comparisons tests in B, C, F, G, L, M).
See also Figure S5.
To test whether inhibition of TAZ/YAP could impair tumor cell expansion, we knocked down Taz or Yap1 by siRNA in Lats1/2-deficient tumor cells. Efficient knockdown of Taz/Yap1 was confirmed by qPCR showing significant down-regulation of Taz, Yap1 and their target genes (Figure 4D; Figure S5B,C). Combined TAZ/YAP suppression dramatically reduced proliferation (Figure 4E–G), and induced apoptosis, resulting in an overall reduction in cell number over time (Figure 4H,I). In addition, pharmacological inhibition of TAZ/YAP by verteporfin or dobutamine (Bao et al., 2011; Liu-Chittenden et al., 2012), but not an unrelated control MK-0752, a gamma-secretase inhibitor, effectively reduced TAZ/YAP expression and activity, which impeded mutant tumor cell proliferation and survival (Figure 4J–M; Figure S5D–F).
As HIPPO-YAP/TAZ signatures were strongly upregulated in human MPNST samples (Figure 1), we then silenced TAZ/YAP in human MPNST cells, SNF02.2 and SNF96.2 by specific siRNA knockdown. We detected a robust reduction in downstream target gene expression and attenuation of proliferation in these MPNST cells (Figure 4N–Q). Moreover, TAZ/YAP silencing also resulted in tumor cell death (Figure S5G–J). These results suggest that the activity of the HIPPO effectors TAZ/YAP is critical for sustained growth of Lats1/2-deficient GEM-PNST cells and human MPNST cells.
Taz/Yap1 reduction effectively inhibits tumor progression in Lats1/2-deficient nerves
To determine whether inhibition of TAZ/YAP hyperactivity in SCs could rescue the in vivo tumor phenotype in Lats1/2-deficient mice, we genetically ablated Taz/Yap1 together with Lats1/2 in the Dhh+ SC lineage. Owing however to the requirement of Taz/Yap1 for normal SC development (Deng et al., 2017; Grove et al., 2017; Poitelon et al., 2016), concurrent loss of Tazfl/flYap1fl/fl or Tazfl/fl;Yap1fl/+ alleles in Lats1/2-deficient SCs resulted in a severe peripheral neuropathy and perinatal lethality. We therefore focused our analysis on Lats1/2-deficient mice with Taz/Yap1 haploinsufficiency, namely Lats1/2-def;Tazfl/+;Yap1fl/+;Dhh-Cre and Lats1/2-def;Tazfl/+;Yap1fl/fl;Dhh-Cre (henceforth Lats1/2-def-TazLo/LoYap1Lo/Lo), which all survived through adulthood. Downregulation of TAZ/YAP in Lats1/2-deficient peripheral nerves was confirmed by a downregulation of TAZ/YAP target genes Ctgf, Cyr61, and Ccnd1 (Figure 5A).
Figure 5. Genetic TAZ/YAP inactivation reduces tumor burden and extends life span in Lats1/2-deficient mice.

(A) qRT-PCR analysis of TAZ/YAP targets between control SNs, Lats1/2-deficient and Lats1/2-def-TazLo/LoYap1Lo/Lo paraspinal SNs. Data are as mean ± SEM (n = 3 independent experiments)
(B) Kaplan-Meier survival curves for control (n = 38), Lats1/2-deficient (n = 32) and Lats1/2-def-TazLo/LoYap1Lo/Lo mice (n = 25). p < 0.0001, between Lats1/2-deficient and Lats1/2-def-TazLo/LoYap1Lo/Lo; Log-rank test.
(C–D) Dermal tumor (C) and paraspinal/nerve tumor (D) number in control (n = 27), Lats1/2-deficient (n = 34) and Lats1/2-def-TazLo/LoYap1Lo/Lo (n = 18) mice. Green arrows: paraspinal tumors; Red arrows: dermal tumors.
(E) Immunostaining for Sox10 and Ki67 in 3-month-old control, Lats1/2-deficient and Lats1/2-def-TazLo/LoYap1Lo/Lo SNs. Scale bars, 50 µm.
(F–G) Total cell density (DAPI+ cells/mm2) (F) and Ki67+ Sox10+ SCs (G) in control, Lats1/2-deficient and Lats1/2-def-TazLo/LoYap1Lo/Lo SNs.
(H) Immunostaining for MBP and Sox10 in 3-month-old control, Lats1/2-deficient and Lats1/2-def-TazLo/LoYap1Lo/Lo SNs. Scale bars, 50 µm.
(I) The ratio of MBP+ area to total nerve area in control, Lats1/2-deficient and Lats1/2-def-TazLo/LoYap1Lo/Lo SNs.
Each data point is presented with mean ± SEM (n = 3–5 for each group; * p < 0.05, **p < 0.01, ***p < 0.001; One-way ANOVA with Tukey’s multiple comparisons test in A, F, G, I; Kruskal-Wallis test with Dunn’s multiple comparisons test in C, D).
We observed that reduced TAZ/YAP expression in Lats1/2-deficient SCs markedly extended the survival of Lats1/2-def-TazLo/LoYap1Lo/Lo mice (Figure 5B), although Lats1/2-def-TazLo/LoYap1Lo/Lo mice, recorded on the Kaplan-Meier curve, had to be ethically sacrificed prior to their natural death due to ulcers on some dermal tumors. Nevertheless, we detected significantly reduced numbers of visible tumor lesions derived from the skin and paraspinal regions in Lats1/2-deficient mice with TAZ/YAP haploinsufficiency (Figure 5C,D). TAZ/YAP inactivation in Lats1/2-deficient mice reduced SC numbers and proliferation to a low level in SNs (Figure 5E–G). In addition, Lats1/2-def-TazLo/LoYap1Lo/Lo nerves restored relatively normal MBP+ expression comparable to control nerves (Figure 5H–I). These data indicate that TAZ/YAP reduction alleviates tumor burden in Lats1/2-deficient mice.
TAZ/YAP activation drives the oncogenic transformation of Lats1/2-deficient SCs
We next sought to define the mechanisms whereby TAZ/YAP drive malignant transformation of SCs. To avoid the complexity of cell type heterogeneity and to track SC lineage cells within a tumor, we isolated cells expressing the ccGFP reporter in the SC lineage by FACS from SNs of control and paraspinal/nerve tumors of Lats1/2-deficient mice, and subjected them to RNA-sequencing profiling (Figure 6A; Figure S6A). We identified distinct transcriptome profiles between GFP+ SCs from Lats1/2-deficient and control mice (Figure 6B).
Figure 6. TAZ/YAP activation drives an oncogenic growth program in Lats1/2-deficient SCs.

(A) Isolation of GFP+ reporter-expressing SC cells by FACS from dissociated control SNs and Lats1/2-deficient paraspinal or nerve-associated tumors.
(B) Heatmap shows differentially expressed genes in Lats1/2-deficient GFP+ SCs (n = 6 mice) compared with control GFP+ SCs (n = 3 mice).
(C) Volcano plot of transcriptome profiles between control GFP+ SCs and Lats1/2-deficient GFP+ SCs. Red and blue dots represent genes significantly upregulated and downregulated in Lats1/2-deficient GFP+ SCs (p < 0.02, FDR < 0.1), respectively.
(D) Heatmap shows changes of pathway activity between control GFP+ SCs (n = 3) and Lats1/2-deficient GFP+ SCs (n = 6) based on MSigDB gene sets. Expression signature scores are the means with linkage hierarchical clustering.
(E) GSEA analysis of Lats1/2-deficient GFP+ SCs (n = 6) and control GFP+ SCs (n = 3) for top differentially regulated gene sets.
(F) GSEA plots of Lats1/2-deficient GFP+ SCs (Lats1/2-deficient tumor) show upregulation of YAP conserved signature (left) and YAP activated signature (right).
(G) GSEA plots of Lats1/2-deficient GFP+ SCs show downregulation of axon ensheathment (left) and Egr2 targets (right) gene sets.
(H) ToppCluster analysis of upregulated gene sets in Lats1/2-deficient GFP+ SCs.
See also Figure S6.
Both hierarchical correlation clustering and principal component analysis showed a strong correlation among Lats1/2-deficient tumor samples, which separately clustered from control GFP+ SCs (Figure S6B,C). Lats1/2 deficiency in SCs led to a set of significantly upregulated and downregulated genes with > 2-fold change (Figure 6C). We identified activation of tumorigenic pathways in Lats1/2-deficient SCs, including gene sets associated with the mitotic cell cycle, YAP signatures, Kras, PDGF signaling as well as RB or TP53 loss-of-function (Figure 6D,E). Consistently, GSEA revealed a marked upregulation of YAP conserved signatures alongside cell cycle-related pathways in mutant SCs (Figure 6F), virtually recapitulating molecular events underlying MPNST pathogenesis (Carroll, 2016). In contrast, gene ontology (GO) terms associated with normal SC development and myelination, such as axon ensheathment and SC differentiation regulator EGR2 targets were markedly downregulated (Figure 6E,G; Figure S6D). Conversely, among the upregulated genes were those over-represented in cell growth, cell migration, pathways in cancer and MPNST (Figure 6H). We further examined expression of tumor suppressors NF1 and P53, detecting a reduction in NF1, but not P53, in Lats1/2-deficient tumor-bearing sciatic nerves (Figure S6E,F). These results suggest that aberrant TAZ/YAP activation promotes tumorigenic transformation of SCs through controlling oncogenic and tumor suppressive pathways.
HIPPO-TEAD1 selectively targets cancer-related genes in Lats1/2-deficient tumor cells
Since TAZ/YAP do not bind DNA directly, transcriptional responses to TAZ/YAP are mediated through transcription factor partners, TEADs (Zanconato et al., 2016). TEAD1 was identified as a key TEAD family member in SCs requisite for myelin-related gene expression (Lopez-Anido et al., 2016; Poitelon et al., 2016). Therefore, to identify the genes directly regulated by TAZ/YAP, we performed chromatin-immunoprecipitation and sequencing (ChIP-Seq) to assess TEAD1 genome-wide occupancy in Lats1/2-deficient tumor cells. The majority of TEAD1 peaks were associated with active histone marks, H3K27Ac and H3K4me1 (Figure 7A–C), depicted by a bimodal distribution around TEAD1 peaks, suggesting that a large proportion of TEAD1 peaks are located in enhancer regions. Moreover, genome-wide accessibility patterns assayed by ATAC-seq robustly defined open chromatin at TEAD1 binding sites across the genome in Lats1/2-deficient tumor cells (Figure 7C), suggesting that TEAD1 occupies the enhancers with open chromatin structure, which is associated with active transcription processes.
Figure 7. Transcriptome and ChIP-seq analyses reveal direct TEAD1 targeting to cancer-related genes in Lats1/2-deficient tumor cells.

(A) ChIP-seq density heatmaps for TEAD1, H3K4me1, H3K4me3 and H3K27Ac within ± 5 kb around the TEAD1 peak center.
(B) H3K27Ac ChIP-seq enrichment profiles around the central TEAD1 binding regions.
(C) H3K4me1, H3K4me3 ChIP-seq and ATAC-seq enrichment profiles around the central TEAD1 binding regions.
(D) Distribution of TEAD1 peaks (n = 3307) to the nearest TSS.
(E) ToppGene analysis of TEAD1-targeted genes co-localized with H3K27Ac in Lats1/2-deficient tumor cells.
(F) Proportions of up- and down-regulated genes targeted by TEAD1.
(G) ToppGene analysis of differentially expressed TEAD1-targeted pathways in Lats1/2-deficient tumor cells.
(H) Heatmap shows categories of differentially expressed genes targeted by TEAD1 in Lats1/2-deficient tumor cells.
(I,J) TEAD1, ATAC-seq and histone binding profiles on HIPPO target loci (I) or oncogene loci (J) in Lats1/2-deficient tumor cells. Shaded areas: binding peaks.
See also Figure S7.
By analyzing the distribution of TEAD1-bound genomic regions, we detected a small fraction of peaks mapped close to the transcriptional start site (TSS), while the majority of peaks were located in intergenic regulatory regions (Figure 7D; Figure S7A). Gene enrichment analysis by Toppgene suite (Chen et al., 2009) identified TEAD1-bound genes marked by the active enhancer mark H3K27Ac as over-represented in HIPPO signaling pathway, PDGF signaling, cell motility, advanced cancer and tumor progression genes (Figure 7E). Remarkably, among TEAD1 target genes that were differentially expressed due to Lats1/2 ablation, ~65% were upregulated (Figure 7F), consistent with the notion that TAZ/YAP-TEAD1 chiefly functions as a transcriptional activator complex for oncogenesis (Harvey et al., 2013; Zanconato et al., 2016).
Among the top activated TEAD1 targets were those pertinent to tumor progression, MPNST, HIPPO signaling and cell migration (e.g. Fscn1, Ddr1, Epha2) (Figure 7G,H). Strikingly, we detected a strong enrichment of TEAD1 occupancy in the promoter/enhancer regions of HIPPO (e.g. Cyr61, Amotl2, Ankrd1) and pro-oncogenic genes, marked by H3K4me3 and/or H3K27Ac, including Dusp6, Ccnd1, Bcl2 and Mdm2, leading to an activation of these genes (Figure 7I–J). In addition, upregulation of TEAD1-associated genes enriched for an embryonic phenotype (e.g. Cdh2, Eya4 and Shroom3) suggests acquisition of progenitor-like or immature cell signatures by SCs upon aberrant TAZ/YAP activation (Figure 7H). ATAC-seq revealed an open chromatin conformation at TEAD1-occupied loci of cancer-related genes in mutant cells, but not in normal SCs, though chromatin structure was unaltered at SC-specific gene loci (Figure S7B–G). This suggests active transcription of oncogenic genes with TAZ/YAP hyperactivity. Consistently, ChIP assays confirmed that these sites were strongly occupied by TEAD1 in Lats1/2-deficient cells, but not in normal SCs (Figure S7H). In contrast, the functions of TEAD1-repressed genes were related to myelin sheath, cell differentiation, as well as tumor suppressive functions (Figure 7G,H).
To determine whether HIPPO co-activators TAZ/YAP can be recruited by TEAD1 for gene activation, we performed TAZ ChIP–qPCR in normal SCs and Lats1/2-deficient cells. TAZ was significantly enriched at the TEAD1 consensus binding sites in the regulatory elements of TAZ/YAP targets, cell proliferation and PDGF pathway genes in Lats1/2-deficient tumor cells (Figure S7I), suggesting that TEAD1 recruits transcriptional activator TAZ to activate a cancer cell growth program.
Motif enrichment analysis revealed overrepresentation in consensus binding sites of growth-promoting factors, Fra-1/AP1, Sox2/10 and Stat3, within TEAD1 peaks (Figure S7J). Together, these data indicate that TEAD1 transcriptionally targets the genes encoding the regulators of cancer-related processes, suggesting that HIPPO signaling dysregulation switches on the oncogenic growth program that leads to SC transformation.
Co-targeting TAZ/YAP and PDGF signaling impedes Lats1/2-deficient tumor progression
By integrating transcriptome profiling and ChIP-seq analyses, we found that HIPPO-TEAD1 selectively targeted and robustly upregulated genes in the platelet-derived growth factor (PDGF) pathway, such as Pdgfa, Pdgfb, Pdgfrb, Raf1, in Lats1/2-deficient tumor cells, but not in normal SCs (Figure 8A–B; S7F,H–I). PDGFA gene amplification and PDGFRA activating mutations have been reported in NF1-related MPNSTs (Holtkamp et al., 2006), and PDGF signaling is activated in both NF1-related and sporadic MPNSTs (Perrone et al., 2009), suggesting the relevance of PDGF signaling activation by the TAZ/YAP-TEAD1 axis to human MPNST. Consistent with the stimulation of PDGF signaling, ERK activity (p-ERK) was elevated in Lats1/2-deficient nerves (Figure 8C).
Figure 8. HIPPO-TEAD1 targets and activates PDGF signaling in Lats1/2-deficient tumor cells.

(A) TEAD1, ATAC-seq and histone binding profiles on selected gene loci in the PDGF pathway in Lats1/2-deficient tumor cells.
(B) Heatmap shows upregulation of TEAD1-targets in PDGF signaling in Lats1/2-deficient tumor cells.
(C) IHC (left) or western blot (right) of p-ERK in GEM-PNST from control SN and Lats1/2-deficient paraspinal tumor at 2.5 months. Scale bar, 50 µm.
(D–E) Immunolabeling of Sox10, BrdU (12 hr pulse) (D) and proportions of BrdU+ cells (E) in Lats1/2-deficient tumor cells treated with indicated pathway inhibitors for 72 hr. Scale bars, 50 µm.
(F) Quantification of BrdU+ cells (pulsed for the indicated times; left) and cell number (right) of Lats1/2-deficient tumor cells treated with indicated inhibitors at reduced dosages (1/3 of the highest doses indicated in E) for the indicated duration of treatment.
(G) Tumor growth of Lats1/2-deficient allografts in nude mice treated with verteporfin (n = 32 tumors), sorafenib (n = 28 tumors) and verteporfin plus sorafenib (V-S) (n = 32 tumors), as compared to vehicle (n = 49 tumors).
(H) Tumor weight of allografts from nude mice treated with TAZ/YAP, or PDGF signaling inhibitors or both at reduced doses.
(I) Representative images of tumors from nude mice treated with indicated inhibitors at reduced doses. Scale bar, 2 cm.
(J–K) Immunostaining of Ki67 and Sox10 (J) and quantification of Ki67+ cells (K) in tumors from nude mice after drug treatment at reduced dosages for 28 days. Scale bars, 50 µm. Data are as mean ± SEM (n = 4; *p < 0.05, Student’s t-test).
(L) Quantification of BrdU+ cells among SNF02.2 cells (left) and SNF96.2 cells (right) treated with indicated inhibitors at reduced (1/3) dosages, respectively, for the indicated duration of treatment.
Data are as mean ± SEM (n = 3–6 independent experiments; (*p < 0.05, ## or **p < 0.01, ### or ***p < 0.001; One-way ANOVA (E) or Two-way ANOVA (F, G, L) with Tukey's multiple comparisons test).
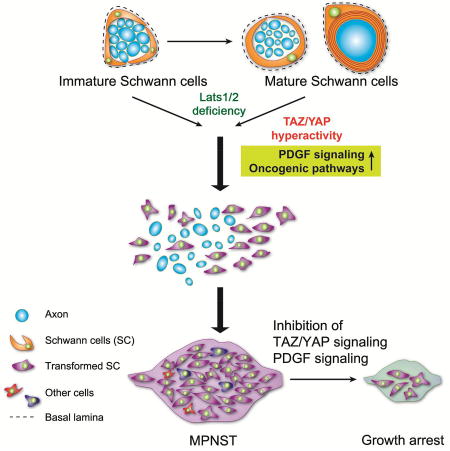
(M) Schematic diagram of SC malignant transformation induced by TAZ/YAP hyperactivity as a result of Lats1/2 loss during tumorigenesis.
See also Figure S8.
We next assessed whether tumor cells with Lats1/2 ablation were sensitive to inhibition of PDGF signaling by treating Lats1/2-deficient tumor cells with PDGFR inhibitors, imatinib or sorafenib, a dual-action inhibitor that targets PDGFR and RAF1 pathways (Adnane et al., 2006; Ohishi et al., 2013). Imatinib or sorafenib treatment exerted a dosage-dependent inhibition of the proliferation in mutant tumor cells (Figure 8D,E). The activation of both TAZ/YAP and PDGF signaling in Lats1/2-deficient nerves provides a rationale to apply combined treatments to curb tumor growth. In light of the inhibition of tumor cell proliferation by TAZ/YAP blockers, verteporfin or dobutamine (Figure 8D,E), we examined whether co-targeting HIPPO-TAZ/YAP and PDGF signaling could additively impede Lats1/2-deficient tumor cell proliferation. Although inhibition of individual pathway with a high drug dosage exhibited some efficacy on blocking cell proliferation in vitro, individual drug treatment at a reduced dose (1/3 of highest doses tested) was largely ineffective (Figure 8F). In contrast, combined inhibition of HIPPO-TAZ/YAP and PDGF signaling efficaciously attenuated Lats1/2-deficient tumor cell proliferation (Figure 8F).
To assess the therapeutic potential of these inhibitors in vivo, we treated athymic nude mice implanted with Lats1/2-deficient cells daily with a single dose of verteporfin (50 mg/kg), sorafenib (40 mg/kg) or imatinib mesylate (50 mg/kg). Although the single-agent therapy suppressed tumor growth relative to vehicle (Figure S8A), dosing mice at these high concentrations carries an increased risk of mortality due to toxicity. We therefore examined whether combination drug therapy with reduced doses could inhibit malignant tumor growth. We did not observe any significant improvement in tumor volume with sorafenib alone (12.5 mg/kg) (Figure 8G), and monotherapy of verteporfin (10 mg/kg) at a reduced dose, though efficient in inhibiting TAZ/YAP expression (Figure S8B), only showed a gradual yet modest inhibition of tumor growth (Figure 8G). Strikingly, concurrent targeting of TAZ/YAP and PDGFR signaling by combined verteporfin and sorafenib with the reduced dosage robustly decelerated SC-derived tumor cell progression much greater than the single-agent regimen, resulting in reduced tumor size and weight (Figure 8G–K). Neither sorafenib, imatinib nor verteporfin alone significantly altered mutant tumor growth (Figure 8H–I).
We further examined the effects of TAZ/YAP inhibitors on the growth of human MPNST cell lines, SNF02.2 and SNF96.2. Both verteporfin and dobutamine exhibited a concentration-dependent inhibition of MPNST cell proliferation (Figure S8C,D). We also found that targeting PDGFR signaling by imatinib or sorafenib reduced BrdU+ proliferative SNF02.2 cell number in a dose-dependent manner (Figure S8C). Strikingly, combined treatment of verteporfin with sorafenib or sorafenib/imatinib at reduced dosage was most effective when compared with single-agent treatment in both MPNST cell lines (Figure 8L). Collectively, our results indicate that pharmacological blockade of both TAZ/YAP and PDGFR signaling activity can additively attenuate the growth of Lats1/2-deficient GEM-PNST tumors and human MPNST cells.
DISCUSSION
Our analyses reveal that robust TAZ/YAP activation is prevalent in human NF1-associated and sporadic MPNSTs. Despite the rare occurrence of mutations in the HIPPO pathway, HIPPO signaling dysregulation may arise from molecular events such as epigenetic alterations of tumor suppressor genes LATS1, LATS2, MST1, or MST2 (Harvey et al., 2013; Zanconato et al., 2016). Strikingly, LATS1 or LATS2 mutations have recently been reported in human peripheral nerve sheath tumors (Kim et al., 2014; Oh et al., 2015). In the present study, we show that a deficiency in Lats1/2 in SCs induces TAZ/YAP hyperactivity and causes MPNST-like tumors with full penetrance and a latency shorter than most other animal models (Carroll, 2016). Our studies establish a unique aggressive animal model of MPNST induced by Lats1/2 deficiency, which resembles the clinically relevant genetic lesions, anatomical locations in the dermis, paraspinal and peripheral nerves, tumor grade and lineage of origin of the corresponding human tumors, suggesting that HIPPO kinases Lats1/2 may function as a hitherto unrecognized potent tumor suppressor in MPNST transformation.
Notably, mutations in NF2/Merlin, an upstream regulator of Lats1/2, lead to benign schwannomas (Guerrant et al., 2016) and occasionally high-grade tumors (Gehlhausen et al., 2015). However, Lats1/2 depletion in SCs predominantly generates malignant tumors coherent with MPNST. The exact mechanism underlying phenotypic divergence between Nf2-null and Lats1/2 deficiency is not known. It is possible that NF2 acts as one of several upstream regulators and thereby only partially affects Lats1/2 activation. Intriguingly, adult SC-specific Nf2-null mice do not exhibit TAZ/YAP activation (Mindos et al., 2017). Lats1/2 may exert a more potent tumor suppressive function through regulating multiple growth pathways (Harvey et al., 2013; Zanconato et al., 2016).
Our integrative transcriptome profiling and genome occupancy analyses reveal that Lats1/2 deficiency sustains TAZ/YAP activity at least in part through TEAD1 that pervasively activates a global network of oncogenic pathways in SCs, including RAS/ERK signaling, PDGF signaling, cell cycle and cell migration regulators, that promotes cell proliferation and metastasis. Our analyses indicate that other pathways, such as NF1 or RB pathways, could be suppressed by stochastic genetic or epigenetic mechanisms during Lats1/2-deficient tumor development. In parallel, constitutive TAZ/YAP activation enforces the de-differentiation program in SCs by upregulating progenitor/stemness gene signatures and inducing SC hyperproliferation and de-differentiation into stem/progenitor-like cells (Figure 8M), in keeping with TAZ/YAP reprogramming of benign cells to cancer stem cells for driving malignancy in other contexts (Cordenonsi et al., 2011).
Activation of the HIPPO-TAZ/YAP pathway is a shared phenomenon for both NF1-associated and sporadic MPNSTs, suggesting that TAZ/YAP hyperactivity acts as a convergence point for MPNST pathogenesis regardless of NF1 state. Notably, an elevated TAZ/YAP transcriptional response appears to distinguish MPNSTs from neurofibromas, suggesting that TAZ/YAP activation, which switches on oncogenic programs, correlates with the malignant transition of nerve sheath tumors. TAZ/YAP hyperactivation likely endows SCs with cancer stem cell-like attributes, which potentially drives tumorigenic transformation of SCs, highlighting the significance of HIPPO signaling perturbation in peripheral nerve malignancy. Our findings further point to dysregulation of HIPPO signaling as a potential predictive biomarker for malignant transformation of existing benign nerve sheath tumors.
Using spatially and temporally-regulated Cre drivers to ablate Lats1/2 in the SC lineage at various developmental time points allows us to define the cellular stage(s) of SCs conducive to GEM-PNST formation. Although Cre-mediated Lats1/2 depletion occurs in Dhh-expressing SC precursors during embryogenesis, Lats1/2 ablation does not appear to disturb SC differentiation and initiation of myelination during postnatal development (Figure S2). The effects of Lats1/2 loss only become obvious from postnatal week 3, when mature SCs start to de-differentiate and persistently proliferate. Importantly, Lats1/2 ablation in mature SCs by Plp1-CreERT in adult mice initiates high-grade GEM-PNST formation, indicating that differentiated SCs, including non-myelinating or perhaps myelinating SCs, may undergo a phenotypic shift through reprogramming into a cellular state susceptible to tumor transformation in the absence of Lats1/2. In contrast, deletion of other tumor suppressor genes such as Nf1 in SCs in adult mice rarely leads to high-grade GEM-PNST formation (Carroll, 2012). Tumorigenic transformation of mature SCs by the Lats1/2 loss challenges the notion of MPNST being mainly a disease of SC precursor cells (Hirbe et al., 2016). Our data show that sustained TAZ/YAP activation by Lats1/2 deficiency potently promotes tumorigenic conversion of mature SCs without the need for other tumor suppressor mutations, suggesting the remarkable plasticity and susceptibility of mature SCs to tumorigenic transformation.
Current therapies for MPNST are associated with long-term deleterious side effects and have not improved significantly in several decades (Bradford and Kim, 2015). Aberrant HIPPO signaling in a wide array of MPNST subtypes pinpoints TAZ/YAP as prime candidates for molecularly-targeted therapy. We demonstrate that TAZ/YAP inhibition in Lats1/2-deficient allografts or in human MPNST cells in vitro, by verteporfin, a FDA-approved compound, inhibits tumor growth. HIPPO signaling has been shown to regulate multiple cell growth pathways such as those of insulin, G-protein coupled receptors and Wnt signaling (Harvey et al., 2013). The Lats1/2-TAZ/YAP axis may serve as a nexus whereby diverse tumorigenic signals converge by orchestrating HIPPO signaling and other oncogenic pathways in regulating MPNST initiation or progression.
Our genome-wide target identification further reveals the PDGF pathway as a TAZ/YAPTEAD target upregulated in response to Lats1/2 depletion. This finding is intriguing since activation of PDGFR signaling is present in MPNST and promotes SC hyperplasia (Holtkamp et al., 2006; Ohishi et al., 2013; Perrone et al., 2009). Although effective in attenuating MPNST cell growth in vitro and in xenograft models, the use of the FDA approved PDGFR inhibitor imatinib hardly resulted in any response against MPNST in previous clinical trials (Chugh et al., 2009). A plausible explanation might be that in MPNST, activated TAZ/YAP confers resistance to chemotherapeutic agents in tumor cells, which gradually bypass dependence on their initiating oncogenic mutations, as described in other contexts (Zanconato et al., 2016). We show that attenuation of TAZ/YAP and PDGFR activity by combinatorial treatment with verteporfin and sorafenib decelerates the cell proliferation of Lats1/2-deficient tumor and human MPNST cells. In in vivo treatment studies, we observed a delay of tumor growth rather than tumor regression, suggesting that the drugs tested exerted cytostatic instead of cytotoxic effects. Since multiple oncogenic pathways are upregulated in Lats1/2-deficient tumors, further investigation into more druggable targets and combination therapeutic options is warranted for effective inhibition of tumor growth. Given the activation of the YAP/TAZ pathway in MPNST, it is conceivable that concomitant targeting of TAZ/YAP activity and growth factor receptor pathways such as PDGFRRAF/MEK/ERK, might enhance synthetic lethality towards improving treatment efficacy in MPNST.
STAR METHODS
Detailed methods are provided in the online version of this paper and include the following:
KEY RESOURCES TABLE
CONTACT FOR REAGENT AND RESOURCE SHARING
-
EXPERIMENTEL MODEL AND SUBJECT DETAILS
Animals
Human tumor samples
Human microarray sample analysis
Primary rat SCs, Mouse SCs, Mouse tumor cells and Human MPNST cell lines
-
METHOD DETAILS
Immunofluorescence staining, Immunohistochemistry (IHC) and Electron Microscopy
Transient Transfections and siRNA knockdown
In vitro drug treatment
Western blotting
RNA sequencing and data analysis
RNA Isolation and Quantitative Real Time-Polymerase Chain Reaction
ChIP-Seq, ATAC-seq and data analysis
ChIP assays
Tamoxifen injections
Allograft transplantations and In vivo drug treatment
Morphometric analysis
QUANTIFICATION AND STATISTICAL ANALYSIS
CONTACT FOR REAGENT AND RESOURCE SHARING
Further information and requests for resources and reagents should be directed to and will be fulfilled by the Lead Contact, Q. Richard Lu (Richard.lu@cchmc.org)
EXPERIMENTAL MODEL AND SUBJECT DETAILS
Animals
Lats1lox/loxLats2lox/lox mice (Heallen et al., 2011), on a mixed C57/Bl6;129Sv;FVBN background, were crossed with Dhh-Cre (Jaegle et al., 2003) mice or Plp1-CreERT (Stock 005975) mice, both on a C57/Bl6 background to obtain Lats1lox/+Lats2lox/+;Cre+/− mice (F1 generation). We bred Lats1lox/+Lats2lox/+;Cre+/− mice (F1) with Lats1lox/loxLats2lox/lox to obtain Lats1/2-deficient offspring (Lats1lox/loxLats2lox/+;Cre+/− or Lats1lox/+Lats2lox/lox;Cre+/−. Lats1/2 double knockout mice, Lats1/2lox/lox;Dhh-Cre+/− were embryonically lethal and were not analyzed. Littermates (Lats1lox/loxLats2lox/lox, Lats1lox/+Lats2lox/+ or Lats1lox/+Lats2lox/+;Cre+/−) were used as controls for experiments. Recombination in 6–8-week-old mice was achieved in Lats1lox/loxLats2lox/+;Cre+/− or Lats1lox/+Lats2lox/lox;Cre+/− with the inducible Plp1-CreERT under the control of the Plp1 promoter followed by tamoxifen injection. The reporter mice CAG-tdTomato (Stock 007909), CAG-CATEGFP (ccGFP) (Stock 024636) were obtained from the Jackson Laboratory. We bred a CAG-CAT27 EGFP (ccGFP) reporter line on C57/Bl6;FVBN with Lats1lox/loxLats2lox/lox on a mixed C57/Bl6;129Sv;FVBN background to obtain Lats1lox/loxLats2lox/lox;ccGFP or Lats1lox/+Lats2lox/+;ccGFP mice, which were then crossed with Lats1lox/+Lats2lox/+;Dhh-Cre+/− to produce Lats1/2-deficient;ccGFP mice for FACS and RNA-sequencing analysis. Littermate controls used for RNA-sequencing were ccGFPlox/+;Dhh-Cre+/−, Lats1lox/+;ccGFPlox/+;Dhh-Cre+/−, Lats2lox/+;ccGFPlox/+;Dhh-Cre+/− or Lats1lox/+Lats2lox/+;ccGFPlox/+;Dhh-Cre+/−. CAG-tdTomato reporter line on C57/Bl6 was crossed with Plp1-CreERT on C57/Bl6 to obtain CAG-tdTomato; Plp1-CreERT+/− mice. Tazlox/loxYap1lox/lox (Deng et al., 2017) mice, on a mixed C57/Bl6;129Sv;FVBN background, were bred with Lats1lox/loxLats2lox/lox to generate Tazlox/+Yap1lox/+Lats1lox/+Lats2lox/+ or with Lats1lox/+Lats2lox/+;Dhh-Cre+/− to generate Tazlox/+Yap1lox/+Lats1lox/+Lats2lox/+;Dhh-Cre+/−. The offsprings of these mice were intercrossed to generate Lats1/2-def-TazLo/Lo/Yap1Lo/Lo mice. Littermate controls were Tazlox/+Yap1lox/+Lats1lox/+Lats2lox/+ or Tazlox/loxYap1lox/loxLats1lox/loxLats2lox/lox. Littermates were used as controls for most experiments.
The Kaplan-Meier survival analysis was determined by a cohort of Lats1/2-deficient, Lats1/2-def-TazLo/Lo/Yap1Lo/Lo mice with their corresponding littermates as controls. All offsprings were maintained on mixed C57/Bl6;129Sv;FVBN background and housed in a vivarium with a 12-hour light/dark cycle. The differences in tumor progression in each Lats1/2-deficient animal might be due to the differences in Cre recombination efficiency for floxed allele deletion in individual SCs and/or genetic backgrounds. We observed full penetrance of the tumor phenotype in all Lats1/2-deficient mutants (n ≥ 104), which essentially excludes the possibility of random genetic drift on an outbred background accounting for tumor formation. All animal experiments were conducted in mice of both genders and approved by IACUC at the Cincinnati Children’s Hospital Medical Center. All experiments conform to IACUC regulatory standards.
Human tumor samples
Human neurofibroma, MPNST and normal nerves were collected according to institutional review board-approved protocols from discarded surgical specimens, and were received from the Cincinnati Children’s Hospital Bio Bank as flash-frozen or paraffin embedded samples. All human samples were obtained with consent under approval by the Institutional Review Board committees at the Cincinnati Children’s Hospital Medical Center.
Human microarray sample analysis
We collected the microarray expression profiles of human normal nerves, neurofibromas and MPNSTs from the GEO public resource (http://www.ncbi.nlm.nih.gov/geo/) and the accession numbers are GSE41747 (Jessen et al., 2013) and GSE66743 (Kolberg et al., 2015). The normalized values from these datasets were analyzed for gene expression scores. YAP signature genes are from Molecular Signatures Database v5.1 (Cordenonsi_YAP_Conserved_Signature) (Cordenonsi et al., 2011; Subramanian et al., 2005) and YAP activated signature (ERMS) was according to the list of activated genes provided in (Tremblay et al., 2014). The mean expression values of all genes within a given signature represent the expression score of the corresponding gene signature, i.e. all 57 genes within the YAP conserved signature gene set or 473 genes within the YAP activated signature gene set.
Primary rat SCs, Mouse SCs, Mouse tumor cells and Human MPNST cell lines
Rat SCs from SNs of newborn rats (1–2 days-old) were isolated as described previously (Wu et al., 2016). SCs were grown routinely in DMEM/10% FBS (Life Technologies), supplemented with 10 ng/ml Neuregulin 1 (Nrg1; R&D Systems), and 5 µM forskolin (Sigma), plus L-glutamine and penicillin/streptomycin, hereafter termed SC proliferation medium. Cells between passages 2 and 6 were used in all experiments. >95% SC purity was achieved, assessed by Sox10 and S100β staining. Lats1/2-deficient mouse paraspinal tumors were isolated, minced into 1 mm3 pieces and dissociated using collagenase type I (156 U/ml, Worthington) and dispase II protease (1.25 U/ml, Sigma) at 37°C. Tumor cells were propagated as an adherent layer on tissue culture dishes in proliferation medium composed of DMEM/10% FBS plus L-glutamine and penicillin/streptomycin. Human MPNST cell lines SNF02.2 and SNF96.2 were propagated in DMEM/10% FBS plus L-glutamine and penicillin/streptomycin. All tissue culture containers and coverslips for rat SC cultures were coated with 50 µg/ml poly-L-lysine (Sigma) in PBS for at least 30 min at room temperature and then rinsed in distilled water.
Adult mouse SCs from SNs of control mice (5 weeks to 4 months old) were isolated as follows: Briefly, adult mouse sciatic nerves were pre-degenerated in vivo by nerve crush at midthigh level. Injured nerves were harvested 5–6 days post crush. Epineurium was removed and nerves were separated into several large bundles by fine forceps. Isolated nerves were then dissociated in a cocktail of collagenase type I (0.1% w/v, Worthington) and dispase II (0.3% w/v, Sigma) in 1× HEPES buffer at 37°C for 2 hr. Small debris was filtered by a 70 µm cell strainer. SCs were plated in DMEM/10% FBS plus L-glutamine and penicillin/streptomycin overnight, followed by washes in HBSS the next day. Medium was replaced with the above-mentioned SC proliferation medium. Mouse SCs were cultured in tissue culture containers or coverslips coated with 50 µg/ml poly-Llysine and 2 µg/ml laminin (R&D Systems 3400-010-01). >90–94% SC purity was achieved, assessed by P75NTR, Sox10 and S100β staining. Primary dissociated SCs at confluency was further FACS-sorted using an anti-P75NTR antibody (Rabbit, Millipore #07-476) and a secondary antibody, APC Goat anti-rabbit IgG (H+L) (Southern Biotech 4050-11S). FACS sorted p75+ cells were propagated to generate purified SCs.
Purified rat SCs, Lats1/2-deficient tumor cells or human MPNST cell lines SNF02.2 and SNF96.2 seeded on poly-L-lysine-coated coverslips were fixed in 4% (w/v) paraformaldehyde (PFA) for 20 minutes and washed in 1x PBS 4 times prior to immunofluorescence staining. For BrdU pulse labeling, cells were incubated with 20 µM BrdU at defined lengths of time prior to fixation.
METHOD DETAILS
Immunofluorescence staining, Immunohistochemistry (IHC) and Electron Microscopy
The SNs of mice at defined ages were dissected and fixed for 45 min in 4% PFA, embedded in OCT, cryoprotected in 25% sucrose and sectioned at 9 µm as longitudinal sections. Mouse peripheral nerves, dermal and paraspinal tumors were dissected, perfused and fixed overnight in 4% PFA, embedded in paraffin and sectioned at 5 µm. For paraffin sections, slides were deparaffinized, rehydrated and subjected to citrate-based antigen retrieval, then incubated overnight with primary antibodies. After washing with PBS for three times, sections were either incubated for 1 h with biotinylated secondary antibodies, followed by ABC kit (Vector labs) application and the peroxidase/diaminobenzidine (DAB) method to visualize signals under light microscopy, or incubated with fluorophore-conjugated secondary antibodies (Jackson ImmunoResearch).
For immunofluorescence and immunoperoxidase staining, we used antibodies to TAZ (Rabbit; Proteintech 23306-1), YAP (Rabbit; Cell Signaling Technology, #4912), TAZ/YAP (Rabbit; Cell Signaling Technology, #8418), Sox10 (Goat, Santa Cruz Biotechnology, sc-17342; Rabbit, Abcam ab180862), Krox20 (Rabbit; Covance, PRB-236P), MBP (Goat; Santa Cruz Biotechnology, sc-13914), Sox2 (Goat; Santa Cruz Biotechnology, sc-17320), Ki67 (Rabbit; Thermo Fisher Scientific, RM-9106), BrdU (Rat; Abcam, ab6326), α-SMA (Mouse; Sigma, clone 1A4, A2547) cleaved Caspase 3 (Rabbit; Cell signaling, #9661), S100β (Mouse; Sigma, SAB1402349). Secondary antibodies conjugated to Cy2, Cy3 or Cy5 were from Jackson ImmunoResearch Laboratories. All immunofluorescence-labeled images were acquired using a Nikon C2+ confocal microscope.
For immunolabeled cell quantification, images were acquired using a Nikon Ti-E SpectraX wide field microscope. For immunohistochemistry, tumors were dissected and fixed overnight in 4% PFA, followed by clearing in 70% ethanol, dehydrated and embedded in paraffin. Hematoxylin and eosin (H&E) and Masson trichrome staining were in accordance with standard protocols. Images were acquired on a Nikon Eclipse 80i or Olympus BX53 bright field microscope.
For electron microscopy, mice were perfused with 4% PFA, 2.5% glutaraldehyde in 0.1 M sodium cacodylate buffer, pH 7.2. Sciatic nerves were dissected and fixed in the same fixative solution overnight. Nerves were rinsed in PBS, postfixed in 1% OsO4 in PBS for 1 hr, dehydrated in graded ethanol, infiltrated with propylene oxide, and embedded in Epon. Semithin sections were stained with toluidine blue, and thin sections were stained with lead citrate. Images of ultrathin sections were acquired on a JEOL 1200 EXII or Hitachi H7650 electron microscope.
Transient Transfections and siRNA knockdown
For plasmid transfections, rat SCs were transfected with expression vectors using Lipofectamine 3000 (Life Technologies) per the manufacturer's protocol for 48 hr and assayed for immunocytochemistry or qRT-PCR analysis. For quantitation, GFP+ were counted, and the percentage of GFP+ cells that expressed the protein of interest was determined. At least 100 GFP+ cells/coverslip were counted.
For siRNA knockdown in Lats1/2-deficient tumor cells or human MPNST cells, we used Lipofectamine RNAiMAX (Life Technologies) per manufacturer’s instructions. Cells were harvested after 72 hr for immunocytochemistry or qRT-PCR analysis. For double siRNA knockdown, tumor cells in proliferation medium were transfected with specific Taz-siRNA and Yap1-siRNA simultaneously.
In vitro drug treatment
For in vitro drug treatment, verteporfin (S1786, Selleckchem) and sorafenib p-Toluenesulfonate salt (S-8502, LC Laboratories) were dissolved in DMSO. Dobutamine hydrochloride (D0676, Sigma Aldrich) and imatinib mesylate (I-5508, LC Laboratories) were dissolved in distilled water. Tumor cells on coverslips were incubated with drugs at concentrations indicated in the text and figure legends for 72 hr and then assayed for immunocytochemistry analysis. Proliferation was assessed by immunostaining for Ki67 and BrdU.
For time-course proliferation experiments, tumor cells on coverslips in a 24-well tissue culture plate were treated with single agents or combined agents in DMEM/10% FBS, as indicated for the designated time points. BrdU (B5002, Sigma) at 20 µM was added for the course of the treatment. Medium was changed every other day with fresh drugs and BrdU. Cells were harvested by fixation in 4% PFA for 20 min and subsequently analyzed by immunofluorescence staining.
Western Blotting
For western blotting, the perineurium and epineurium were removed from SNs prior to snap-freezing and storage at −80°C. Sciatic nerves, tumors or dissociated tumor cells were lysed in RIPA buffer, containing protease and phosphatase inhibitors. Western blot analysis was performed as described previously (Wu et al., 2016). GAPDH (Millipore, MAB374) was used as an input control. we used antibodies to TAZ (Mouse, BD Pharmingen 560235), YAP (Rabbit, Cell Signaling Technology, #4912), LATS1 (Goat, Santa Cruz Biotechnology sc-12494), LATS2 (Rabbit, Bethyl Laboratories, A300-479A), TEAD1 (Mouse, Santa Cruz Biotechnology sc-393976), neurofibromin (Rabbit, Santa Cruz Biotechnology sc-67), P53 (Rabbit, Cell Signaling Technology, #9282). Secondary antibodies conjugated to HRP were from Jackson ImmunoResearch Laboratories.
RNA-Sequencing and Data Analysis
Dhh+ Schwann cell lineage-derived GFP+ cell populations from 3–4-month-old control:ccGFP SNs and Lats1/2-deficient:ccGFP paraspinal tumors were sorted by fluorescence activated cell sorting (FACS). RNA of GFP+ cells were extracted using TRIZOL (Life Technologies) followed by purification using a Direct-zol RNA MicroPrep Kit (Zymo Research).
RNA-seq libraries were prepared using Illumina RNA-Seq Preparation Kit and sequenced by a HiSeq 2500 sequencer. All RNA-Seq data were aligned to mm10 using TopHat with default settings. We used Cuff-diff to (1) estimate FPKM values for known transcripts and (2) analyze differentially expressed transcripts. In all differential expression tests, a difference was considered significant if the q value was less than 0.05 (Cuff-diff default). Heatmap of gene expression was generated using R language (http://www.r-project.org). GO-analysis of gene expression changes was performed using Gene Set Enrichment (GSEA, http://www.broadinstitute.org/gsea/index.jsp). Normalized enrichment score (NES) reflects the degree to which the gene-set is overrepresented at the top or bottom of a ranked list of genes. The GSEA summary plots in Figure S1A,B and 6E showing upregulated and downregulated pathways were plotted according to (https://www.biostars.org/p/168044/). Genes categorized with negative or positive NES are downregulated or upregulated, respectively. Circle size is proportional to the number of significant genes defined here as the number of genes represented in the leading-edge subset, i.e. the subset of members within a gene set that shows statistically significant, concordant differences between two biological states and contribute most to the NES. Gene sets with FDR q values < 0.25 are plotted as a function of NES. Circle colors represent FDR q values.
We used ToppCluster (https://toppcluster.cchmc.org/) to construct the network of genes belonging to over-represented GO-term categories. For the volcano plot, the up-regulated and down-regulated genes were represented by red or blue dots respectively (fold change >2, p < 0.02 between control GFP and Lats1/2-deficient GFP cells). Gray dots represent insignificantly changed genes with p > 0.02. The gene expression signatures for pathway analysis were from Molecular Signatures Database v5.1 (Subramanian et al., 2005). The mean expression values were calculated using all genes within a given signature for the heatmap analysis (Subramanian et al., 2005). The heatmap in Figure 7J was generated based on log2 [FPKM] by AltAnalyze (AltAnalyze.org) with normalization of rows relative to row mean.
RNA Isolation and Quantitative Real Time-Polymerase Chain Reaction
RNA from purified rat SCs, Lats1/2-deficient tumor cells, human MPNST cells or control and Lats1/2-deficient mouse SNs or tumors was extracted using TRIZOL (Life Technologies). cDNA was synthesized from 1 µg RNA using iScript Reverse Transcription Supermix (BioRad) according to the manufacturer’s instructions. QRT-PCR was performed using the StepOnePlus Real-Time PCR System (Applied Biosystems). qRT-PCR was performed using quantitative SYBR green PCR mix (BioRad). PCR primer sequences are available upon request.
ChIP-Seq, ATAC-seq and data analysis
Dissociated Lats1/2-deficient mouse tumor cells were fixed for 15 min at room temperature with 1% formaldehyde-containing medium. Nuclei were isolated and sonicated in sonication buffer (10 mM Tris-HCl pH 8.0, 1 mM EDTA, 0.5 mM EGTA and protease inhibitor cocktail). Sonicated chromatin (~300 µg) was used for immunoprecipitation by incubation with appropriate antibodies (4 µg) overnight at 4 °C. Ten per cent of chromatin used for each ChIP reaction was kept as input DNA. Pre-rinsed magnetic protein A/G beads (50 µl) were added to each ChIP reaction and reactions were incubated for 1 hr at 4 °C. The beads were then incubated in 200 µl elution buffer at 65°C for 20 min to elute immunoprecipitated materials. We performed duplicate ChIP-seq assays using chromatin from at least two different cell cultures. The ChIP-seq libraries were prepared using NEBNext ChIP-seq Library Prep Master Mix Set for Illumina (NEB catalogue number E6240L) and then run on the Illumina sequencer HS2000. The antibodies used were as follows: TEAD1 (Mouse, BD Biosciences, 610922), H3K4me1 (Rabbit, Abcam, 8895), H3K4me3 (Rabbit, Abcam, 8580) and H3K27Ac (Rabbit, Abcam, 4729).
ATAC-seq was performed as described in (Buenrostro et al., 2015). Briefly, adult mouse SCs or dissociated Lats1/2-deficient mouse tumor cells (~50,000 cells) were spun down at 500×g for 5 min at 4°C, and lysed in cold Lysis buffer (10 mM Tris-HCl, pH 7.4, 10 mM NaCl, 3 mM MgCl2, 0.1% IGEPAL CA-630). After spinning down at 500×g for 10 min at 4°C, nuclei were resuspended in transposition mix containing TD (2x reaction buffer), TDE1 (Nextera Tn5 Transposase) at 37°C for 30 min. Immediately following transposition, DNA were purified using a Qiagen MinElute PCR Purification Kit. Transposed DNA fragments were subsequently amplified and the amplified library was purified using Qiagen MinElute PCR Purification Kit. Libraries were generated using the Ad1_noMX and Ad2.1–2.4 barcoded primers and were amplified for 11 total cycles. Libraries were purified with AMPure beads (Agencourt) to remove contaminating primer dimers. All libraries were sequenced on the Illumina HiSeq 2500 with 75 bp single-end reads.
The sequencing data were mapped to the mm10 genome assembly, and peak calling was performed using Model-based analysis of ChIP-seq (MACS) version 1.4.2 (http://liulab.dfci.harvard.edu/MACS) with default parameters, to get primary binding regions. To ensure that our data were of high quality and reproducibility, we called peaks with enrichment ≥10-fold over control (p≤10−9) and compared the peak sets using the ENCODE overlap rules. These identified primary regions were further filtered using the following criteria, to define a more stringent protein–DNA interactome: (1) the p-value cutoff was set to ≤ 10−9; (2) an enrichment of 6.8-fold and peak height > 5. For all ATAC-seq and ChIP-seq data sets, WIG files were generated with MACS, which were subsequently visualized using EaSeq (Lerdrup et al., 2016). TEAD1, H3K4me3, H3K4me1 and H3K27Ac ChIPseq and ATAC-seq heatmaps were ordered by strength of binding. The heatmaps were drawn using the Heatmap tools provided by Cistrome (http://cistrome.org/ap). Motif discovery was performed by HOMER software.
Chromatin Immunoprecipitation (ChIP) Assays
Briefly, purified adult mouse SCs or Lats1/2-deficient tumor cells grown in proliferation medium (~20 million cells) were fixed for 10 min at room temperature with 1% formaldehyde-containing medium (Wu et al., 2016). Nuclei were pelleted and sonicated in sonication buffer (10 mM Tris-HCl [pH 8.0], 1 mM EDTA, 0.5 mM EGTA, and protease inhibitor cocktail). Sonicated chromatin (~300 µg) was used for immunoprecipitation by incubation with IgG or anti-TEAD1 antibody (Mouse, BD Biosciences, 610922; 4 µg) or anti-TAZ antibody (Rabbit, Novus Biologicals, NB110-58359) overnight at 4°C. 10% of chromatin used for each ChIP reaction was kept as input DNA. Pre-rinsed protein A/G plus agarose beads (50 µl) was added to each ChIP reaction and incubated for 1 hr at 4°C. The beads were then incubated in 200 µl elution buffer at 65°C for 20 minutes to elute immunoprecipitated materials. Real-time PCR was performed using quantitative SYBR green PCR mix (BioRad). The relative fold-enrichments were determined by the 2−ΔCT methods. Samples were normalized to input chromatin. Primers for ChIP-qPCR analysis were designed to flank the TEAD1 binding regions (GGAAT) at the regulatory elements of the following gene loci located at the indicated distances from the transcription start site (TSS), as revealed by TEAD1 ChIP-seq. For primers, see Table S1.
Tamoxifen Injections
Tamoxifen (T5648, Sigma) dissolved to a stock concentration of 20 mg/ml in a vehicle of ethanol and sunflower seed oil (1:9 v/v). For adult tamoxifen treatment, 100 µl (2 mg/100 µl) was administered by i.p. injection once daily for 5 consecutive days to 6–8 week-old mice. Control mice were treated identically. Mice were analyzed 9–16 weeks post tamoxifen administration when tumors were visible.
Allograft transplantations and In vivo drug treatment
Female athymic NCR nude mice of 6–8 weeks were used for allograft transplantations. Primary Lats1/2-deficient cells from paraspinal tumors were prepared as described above and cells within 2 passages were used in the study. 1–2 × 10⁵ tumor cells diluted in Matrigel (Corning) and DMEM/10% FBS: 1:2 ratio were injected subcutaneously into the flanks. Serial dilution transplantation assays were performed similarly at defined cell numbers as indicated in Figure 3E. For in vivo drug treatment, beginning at the time of tumor detection, verteporfin or sorafenib was diluted in a mixture of 1:1 Cremophor (Sigma, C5135) and EtOH (95:5 v/v). Vehicle was 1:1 Cremophor (Sigma, C5135) and EtOH (95:5 v/v). Imatinib mesylate was diluted in distilled water. For single-agent studies, 50 mg kg−1 verteporfin (Li et al., 2016), 40 mg kg−1 sorafenib (Yuen et al., 2011) or 50 mg kg−1 imatinib mesylate (Iyoda et al., 2009) were administered to mice daily. For reduced drug dose treatment, we injected into nude mice sorafenib at 12.5 mg kg−1 and/or verteporfin at 10 mg kg−1, every other day for at least 30 days. Tumor size was calculated by measuring length and width of the lesion with the formula (length) × (width)2 × 0.5.
Morphometric analysis
For quantification of labeled cells in transfection studies, since the TAZ4SA and YAPS112A expression plasmids carry a GFP-reporter, GFP+ cells represent TAZ4SA or YAPS112A-transfected cells. The quantification was performed by manually counting antibody co-labeled cells based on the total number of transfected cells indicated by GFP expression. For quantification of immunoperoxidase-stained cells, the proportion of immunopositive cells are the number of brown cells (DAB+) based on total number of cells (brown + blue). MBP+ area of total nerve area was determined using Nikon Elements General Analysis Software.
For quantification of Ki67+ or BrdU+ immunolabeled cells on coverslips, multiple images were taken from each coverslip to obtain representative images from all areas of the coverslip using a Nikon Ti-E SpectraX widefield microscope or Nikon C2+ confocal microscope, and at least 1000 cells/coverslip were counted using Nikon Elements General Analysis software.
QUANTIFICATION AND STATISTICAL ANALYSIS
All analyses were done using Microsoft Excel or GraphPad Prism 6.00 (San Diego California, www.graphpad.com). Data are shown in dot plots or histograms as mean ± SEM, p < 0.05 is deemed statistically significant. Data distribution was assumed to be normal, but this was not formally tested. Count data was assumed to be non-parametric, and appropriate statistical tests were used. Statistical analysis was performed by two-tailed unpaired Student's t tests, Mann-Whitney test, one-way ANOVA with post-hoc analysis by Tukey's multiple comparison test, or Two-way ANOVA with Tukey’s or Sidak’s multiple comparisons test, or as indicated. Survival analyses used animal death times and censoring times when animals were sacrificed or as otherwise stated. Survival curves were plotted with the Kaplan– Meier method and compared by using a two-sided log-rank test. p < 0.05 is considered to be statistically significant.
Quantifications were performed from at least three experimental groups in a blinded fashion. No statistical methods were used to predetermine sample sizes, but our sample sizes are similar to those generally employed in the field. No randomization was used to collect all the data, but they were quantified blindly. No animals or data points were excluded from analyses.
DATA AND SOFTWARE AVAILABILITY
Accession Codes: All the RNA-seq and ChIP-seq data are deposited in the NCBI Gene Expression Omnibus (GEO) GSE99040.
Supplementary Material
Significance.
MPNSTs are one of the most aggressive soft tissue sarcomas with poor prognosis. Here, we uncover TAZ/YAP hyperactivation caused by Lats1/2-deficiency as a convergent mechanism underlying the pathogenesis of MPNSTs. Lats1/2-deficient mice developed peripheral nerve sheath tumors with full penetrance, which resemble clinically relevant genetic lesions, anatomical locations, and the developmental cell of origin in the human disease. Our data further identify a set of dysregulated tumorigenic pathways targeted by the TAZ/YAP-TEAD1 axis and demonstrate the efficacy of coinhibition of TAZ/YAP and PDGFR pathways in suppression of tumor growth. These findings suggest hyperactivation of TAZ/YAP as an oncogenic signaling hub that promotes SC transformation and identify a HIPPO-PDGF dependent pathway for MPNST pathogenesis and potential therapeutic intervention.
Highlights.
Human MPNSTs exhibit elevated HIPPO-TAZ/YAP expression
TAZ/YAP hyperactivity in Schwann cells potently induces high-grade nerve tumors
Lats1/2 dysregulation activates oncogenic programs including PDGFR signaling
Co-targeting TAZ/YAP and PDGFR pathways inhibits MPNST tumor growth
Acknowledgments
We thank Dr. Dies Meijer for Dhh-Cre mice, and Drs. Edward Hurlock and Susanne Wells for suggestions and discussion. This study was funded in part by grants from NIH R37 NS096359 and R01 NS075243 to Q.R.L. and M.X. and R01 NS28840 to N.R., and Children's Tumor Foundation Young Investigator Award to L.M.W.
Footnotes
Publisher's Disclaimer: This is a PDF file of an unedited manuscript that has been accepted for publication. As a service to our customers we are providing this early version of the manuscript. The manuscript will undergo copyediting, typesetting, and review of the resulting proof before it is published in its final citable form. Please note that during the production process errors may be discovered which could affect the content, and all legal disclaimers that apply to the journal pertain.
AUTHOR CONTRIBUTIONS
L.M.W. and Q.R.L. designed the experiments, analyzed the data and wrote the manuscript with input from all authors. L.M.W, Y.D., Jin.W., C.Z., Jia.W., R.R., L.X., K.C., T.A.R. carried out the in vitro, in vivo, gene profiling or in silico analyses. W.Z., M.R., J.R., A.O.S., J.W., Y.Z., M.X., N.R. provided resources and input. R.J. and T. C. provided floxed Lats animals. Q.R.L. supervised the project.
DECLARATION OF INTERESTS
The authors declare no competing interests.
References
- Adnane L, Trail PA, Taylor I, Wilhelm SM. Sorafenib (BAY 43-9006, Nexavar), a dual-action inhibitor that targets RAF/MEK/ERK pathway in tumor cells and tyrosine kinases VEGFR/PDGFR in tumor vasculature. Methods in enzymology. 2006;407:597–612. doi: 10.1016/S0076-6879(05)07047-3. [DOI] [PubMed] [Google Scholar]
- Bao Y, Nakagawa K, Yang Z, Ikeda M, Withanage K, Ishigami-Yuasa M, Okuno Y, Hata S, Nishina H, Hata Y. A cell-based assay to screen stimulators of the Hippo pathway reveals the inhibitory effect of dobutamine on the YAP-dependent gene transcription. J Biochem. 2011;150:199–208. doi: 10.1093/jb/mvr063. [DOI] [PubMed] [Google Scholar]
- Bradford D, Kim A. Current treatment options for malignant peripheral nerve sheath tumors. Current treatment options in oncology. 2015;16:328. doi: 10.1007/s11864-015-0328-6. [DOI] [PubMed] [Google Scholar]
- Buenrostro JD, Wu B, Chang HY, Greenleaf WJ. ATAC-seq: A Method for Assaying Chromatin Accessibility Genome-Wide. Curr Protoc Mol Biol. 2015;109:21–29. doi: 10.1002/0471142727.mb2129s109. 21–29. [DOI] [PMC free article] [PubMed] [Google Scholar]
- Carroll SL. Molecular mechanisms promoting the pathogenesis of Schwann cell neoplasms. Acta neuropathologica. 2012;123:321–348. doi: 10.1007/s00401-011-0928-6. [DOI] [PMC free article] [PubMed] [Google Scholar]
- Carroll SL. The Challenge of Cancer Genomics in Rare Nervous System Neoplasms: Malignant Peripheral Nerve Sheath Tumors as a Paradigm for Cross-Species Comparative Oncogenomics. The American journal of pathology. 2016;186:464–477. doi: 10.1016/j.ajpath.2015.10.023. [DOI] [PMC free article] [PubMed] [Google Scholar]
- Chen J, Bardes EE, Aronow BJ, Jegga AG. ToppGene Suite for gene list enrichment analysis and candidate gene prioritization. Nucleic Acids Res. 2009;37:W305–311. doi: 10.1093/nar/gkp427. [DOI] [PMC free article] [PubMed] [Google Scholar]
- Chugh R, Wathen JK, Maki RG, Benjamin RS, Patel SR, Meyers PA, Priebat DA, Reinke DK, Thomas DG, Keohan ML, et al. Phase II multicenter trial of imatinib in 10 histologic subtypes of sarcoma using a bayesian hierarchical statistical model. Journal of clinical oncology : official journal of the American Society of Clinical Oncology. 2009;27:3148–3153. doi: 10.1200/JCO.2008.20.5054. [DOI] [PubMed] [Google Scholar]
- Cordenonsi M, Zanconato F, Azzolin L, Forcato M, Rosato A, Frasson C, Inui M, Montagner M, Parenti AR, Poletti A, et al. The Hippo transducer TAZ confers cancer stem cell-related traits on breast cancer cells. Cell. 2011;147:759–772. doi: 10.1016/j.cell.2011.09.048. [DOI] [PubMed] [Google Scholar]
- Deng Y, Wu LM, Bai S, Zhao C, Wang H, Wang J, Xu L, Zhou W, Xin M, Lu QR. A Reciprocal Regulatory Loop Between TAZ/YAP and G protein Gαs Regulates Schwann Cell Proliferation and Differentiation. Nature communications. 2017;8 doi: 10.1038/ncomms15161. [DOI] [PMC free article] [PubMed] [Google Scholar]
- Farid M, Demicco EG, Garcia R, Ahn L, Merola PR, Cioffi A, Maki RG. Malignant peripheral nerve sheath tumors. Oncologist. 2014;19:193–201. doi: 10.1634/theoncologist.2013-0328. [DOI] [PMC free article] [PubMed] [Google Scholar]
- Gehlhausen JR, Park SJ, Hickox AE, Shew M, Staser K, Rhodes SD, Menon K, Lajiness JD, Mwanthi M, Yang X, et al. A murine model of neurofibromatosis type 2 that accurately phenocopies human schwannoma formation. Human molecular genetics. 2015;24:1–8. doi: 10.1093/hmg/ddu414. [DOI] [PMC free article] [PubMed] [Google Scholar]
- Grove M, Kim H, Santerre M, Krupka AJ, Han SB, Zhai J, Cho JY, Park R, Harris M, Kim S, et al. YAP/TAZ initiate and maintain Schwann cell myelination. eLife. 2017;6 doi: 10.7554/eLife.20982. [DOI] [PMC free article] [PubMed] [Google Scholar]
- Guerrant W, Kota S, Troutman S, Mandati V, Fallahi M, Stemmer-Rachamimov A, Kissil JL. YAP Mediates Tumorigenesis in Neurofibromatosis Type 2 by Promoting Cell Survival and Proliferation through a COX-2-EGFR Signaling Axis. Cancer research. 2016;76:3507–3519. doi: 10.1158/0008-5472.CAN-15-1144. [DOI] [PMC free article] [PubMed] [Google Scholar]
- Harvey KF, Zhang X, Thomas DM. The Hippo pathway and human cancer. Nature reviews Cancer. 2013;13:246–257. doi: 10.1038/nrc3458. [DOI] [PubMed] [Google Scholar]
- Heallen T, Zhang M, Wang J, Bonilla-Claudio M, Klysik E, Johnson RL, Martin JF. Hippo pathway inhibits Wnt signaling to restrain cardiomyocyte proliferation and heart size. Science. 2011;332:458–461. doi: 10.1126/science.1199010. [DOI] [PMC free article] [PubMed] [Google Scholar]
- Hirbe AC, Dahiya S, Friedmann-Morvinski D, Verma IM, Clapp DW, Gutmann DH. Spatially- and temporally-controlled postnatal p53 knockdown cooperates with embryonic Schwann cell precursor Nf1 gene loss to promote malignant peripheral nerve sheath tumor formation. Oncotarget. 2016;7:7403–7414. doi: 10.18632/oncotarget.7232. [DOI] [PMC free article] [PubMed] [Google Scholar]
- Holtkamp N, Okuducu AF, Mucha J, Afanasieva A, Hartmann C, Atallah I, Estevez-Schwarz L, Mawrin C, Friedrich RE, Mautner VF, von Deimling A. Mutation and expression of PDGFRA and KIT in malignant peripheral nerve sheath tumors, and its implications for imatinib sensitivity. Carcinogenesis. 2006;27:664–671. doi: 10.1093/carcin/bgi273. [DOI] [PubMed] [Google Scholar]
- Hummel TR, Jessen WJ, Miller SJ, Kluwe L, Mautner VF, Wallace MR, Lazaro C, Page GP, Worley PF, Aronow BJ, et al. Gene expression analysis identifies potential biomarkers of neurofibromatosis type 1 including adrenomedullin. Clinical cancer research : an official journal of the American Association for Cancer Research. 2010;16:5048–5057. doi: 10.1158/1078-0432.CCR-10-0613. [DOI] [PMC free article] [PubMed] [Google Scholar]
- Iyoda M, Hudkins KL, Becker-Herman S, Wietecha TA, Banas MC, Guo S, Meyer-Bahlburg A, Kowalewska J, Liu G, Ziegler SF, et al. Imatinib suppresses cryoglobulinemia and secondary membranoproliferative glomerulonephritis. Journal of the American Society of Nephrology : JASN. 2009;20:68–77. doi: 10.1681/ASN.2008010036. [DOI] [PMC free article] [PubMed] [Google Scholar]
- Jaegle M, Ghazvini M, Mandemakers W, Piirsoo M, Driegen S, Levavasseur F, Raghoenath S, Grosveld F, Meijer D. The POU proteins Brn-2 and Oct-6 share important functions in Schwann cell development. Genes & development. 2003;17:1380–1391. doi: 10.1101/gad.258203. [DOI] [PMC free article] [PubMed] [Google Scholar]
- Jessen WJ, Miller SJ, Jousma E, Wu J, Rizvi TA, Brundage ME, Eaves D, Widemann B, Kim MO, Dombi E, et al. MEK inhibition exhibits efficacy in human and mouse neurofibromatosis tumors. J Clin Invest. 2013;123:340–347. doi: 10.1172/JCI60578. [DOI] [PMC free article] [PubMed] [Google Scholar]
- Kim YH, Ohta T, Oh JE, Le Calvez-Kelm F, McKay J, Voegele C, Durand G, Mittelbronn M, Kleihues P, Paulus W, Ohgaki H. TP53, MSH4, and LATS1 Germline Mutations in a Family with Clustering of Nervous System Tumors. The American journal of pathology. 2014;184:2374–2381. doi: 10.1016/j.ajpath.2014.05.017. [DOI] [PubMed] [Google Scholar]
- Kolberg M, Holand M, Lind GE, Agesen TH, Skotheim RI, Hall KS, Mandahl N, Smeland S, Mertens F, Davidson B, Lothe RA. Protein expression of BIRC5, TK1, and TOP2A in malignant peripheral nerve sheath tumours--A prognostic test after surgical resection. Molecular oncology. 2015;9:1129–1139. doi: 10.1016/j.molonc.2015.02.005. [DOI] [PMC free article] [PubMed] [Google Scholar]
- Lei QY, Zhang H, Zhao B, Zha ZY, Bai F, Pei XH, Zhao S, Xiong Y, Guan KL. TAZ promotes cell proliferation and epithelial-mesenchymal transition and is inhibited by the hippo pathway. Molecular and cellular biology. 2008;28:2426–2436. doi: 10.1128/MCB.01874-07. [DOI] [PMC free article] [PubMed] [Google Scholar]
- Lerdrup M, Johansen JV, Agrawal-Singh S, Hansen K. An interactive environment for agile analysis and visualization of ChIP-sequencing data. Nature structural & molecular biology. 2016;23:349–357. doi: 10.1038/nsmb.3180. [DOI] [PubMed] [Google Scholar]
- Li H, Huang Z, Gao M, Huang N, Luo Z, Shen H, Wang X, Wang T, Hu J, Feng W. Inhibition of YAP suppresses CML cell proliferation and enhances efficacy of imatinib in vitro and in vivo. Journal of experimental & clinical cancer research : CR. 2016;35:134. doi: 10.1186/s13046-016-0414-z. [DOI] [PMC free article] [PubMed] [Google Scholar]
- Liu-Chittenden Y, Huang B, Shim JS, Chen Q, Lee SJ, Anders RA, Liu JO, Pan D. Genetic and pharmacological disruption of the TEAD-YAP complex suppresses the oncogenic activity of YAP. Genes & development. 2012;26:1300–1305. doi: 10.1101/gad.192856.112. [DOI] [PMC free article] [PubMed] [Google Scholar]
- Lopez-Anido C, Poitelon Y, Gopinath C, Moran JJ, Ma KH, Law WD, Antonellis A, Feltri ML, Svaren J. Tead1 regulates the expression of Peripheral Myelin Protein 22 during Schwann cell development. Human molecular genetics. 2016 doi: 10.1093/hmg/ddw158. [DOI] [PMC free article] [PubMed] [Google Scholar]
- Mindos T, Dun XP, North K, Doddrell RD, Schulz A, Edwards P, Russell J, Gray B, Roberts SL, Shivane A, et al. Merlin controls the repair capacity of Schwann cells after injury by regulating Hippo/YAP activity. The Journal of cell biology. 2017 doi: 10.1083/jcb.201606052. [DOI] [PMC free article] [PubMed] [Google Scholar]
- Nakamura T, Colbert MC, Robbins J. Neural crest cells retain multipotential characteristics in the developing valves and label the cardiac conduction system. Circulation research. 2006;98:1547–1554. doi: 10.1161/01.RES.0000227505.19472.69. [DOI] [PubMed] [Google Scholar]
- Oh JE, Ohta T, Satomi K, Foll M, Durand G, McKay J, Le Calvez-Kelm F, Mittelbronn M, Brokinkel B, Paulus W, Ohgaki H. Alterations in the NF2/LATS1/LATS2/YAP Pathway in Schwannomas. J Neuropathol Exp Neurol. 2015;74:952–959. doi: 10.1097/NEN.0000000000000238. [DOI] [PubMed] [Google Scholar]
- Ohishi J, Aoki M, Nabeshima K, Suzumiya J, Takeuchi T, Ogose A, Hakozaki M, Yamashita Y, Iwasaki H. Imatinib mesylate inhibits cell growth of malignant peripheral nerve sheath tumors in vitro and in vivo through suppression of PDGFR-beta. BMC cancer. 2013;13:224. doi: 10.1186/1471-2407-13-224. [DOI] [PMC free article] [PubMed] [Google Scholar]
- Perrone F, Da Riva L, Orsenigo M, Losa M, Jocolle G, Millefanti C, Pastore E, Gronchi A, Pierotti MA, Pilotti S. PDGFRA, PDGFRB, EGFR, and downstream signaling activation in malignant peripheral nerve sheath tumor. Neuro-oncology. 2009;11:725–736. doi: 10.1215/15228517-2009-003. [DOI] [PMC free article] [PubMed] [Google Scholar]
- Poitelon Y, Lopez-Anido C, Catignas K, Berti C, Palmisano M, Williamson C, Ameroso D, Abiko K, Hwang Y, Gregorieff A, et al. YAP and TAZ control peripheral myelination and the expression of laminin receptors in Schwann cells. Nature neuroscience. 2016 doi: 10.1038/nn.4316. [DOI] [PMC free article] [PubMed] [Google Scholar]
- Rahrmann EP, Watson AL, Keng VW, Choi K, Moriarity BS, Beckmann DA, Wolf NK, Sarver A, Collins MH, Moertel CL, et al. Forward genetic screen for malignant peripheral nerve sheath tumor formation identifies new genes and pathways driving tumorigenesis. Nature genetics. 2013;45:756–766. doi: 10.1038/ng.2641. [DOI] [PMC free article] [PubMed] [Google Scholar]
- Stemmer-Rachamimov AO, Louis DN, Nielsen GP, Antonescu CR, Borowsky AD, Bronson RT, Burns DK, Cervera P, McLaughlin ME, Reifenberger G, et al. Comparative pathology of nerve sheath tumors in mouse models and humans. Cancer research. 2004;64:3718–3724. doi: 10.1158/0008-5472.CAN-03-4079. [DOI] [PubMed] [Google Scholar]
- Subramanian A, Tamayo P, Mootha VK, Mukherjee S, Ebert BL, Gillette MA, Paulovich A, Pomeroy SL, Golub TR, Lander ES, Mesirov JP. Gene set enrichment analysis: a knowledge-based approach for interpreting genome-wide expression profiles. Proc Natl Acad Sci U S A. 2005;102:15545–15550. doi: 10.1073/pnas.0506580102. [DOI] [PMC free article] [PubMed] [Google Scholar]
- Tremblay AM, Missiaglia E, Galli GG, Hettmer S, Urcia R, Carrara M, Judson RN, Thway K, Nadal G, Selfe JL, et al. The Hippo transducer YAP1 transforms activated satellite cells and is a potent effector of embryonal rhabdomyosarcoma formation. Cancer cell. 2014;26:273–287. doi: 10.1016/j.ccr.2014.05.029. [DOI] [PubMed] [Google Scholar]
- Varelas X. The Hippo pathway effectors TAZ and YAP in development, homeostasis and disease. Development. 2014;141:1614–1626. doi: 10.1242/dev.102376. [DOI] [PubMed] [Google Scholar]
- Visser S, Yang X. LATS tumor suppressor: a new governor of cellular homeostasis. Cell Cycle. 2010;9:3892–3903. doi: 10.4161/cc.9.19.13386. [DOI] [PubMed] [Google Scholar]
- Wu J, Williams JP, Rizvi TA, Kordich JJ, Witte D, Meijer D, Stemmer-Rachamimov AO, Cancelas JA, Ratner N. Plexiform and dermal neurofibromas and pigmentation are caused by Nf1 loss in desert hedgehog-expressing cells. Cancer cell. 2008;13:105–116. doi: 10.1016/j.ccr.2007.12.027. [DOI] [PMC free article] [PubMed] [Google Scholar]
- Wu LM, Wang J, Conidi A, Zhao C, Wang H, Ford Z, Zhang L, Zweier C, Ayee BG, Maurel P, et al. Zeb2 recruits HDAC-NuRD to inhibit Notch and controls Schwann cell differentiation and remyelination. Nature neuroscience. 2016;19:1060–1072. doi: 10.1038/nn.4322. [DOI] [PMC free article] [PubMed] [Google Scholar]
- Xin M, Kim Y, Sutherland LB, Murakami M, Qi X, McAnally J, Porrello ER, Mahmoud AI, Tan W, Shelton JM, et al. Hippo pathway effector Yap promotes cardiac regeneration. Proc Natl Acad Sci U S A. 2013;110:13839–13844. doi: 10.1073/pnas.1313192110. [DOI] [PMC free article] [PubMed] [Google Scholar]
- Yang J, Ylipaa A, Sun Y, Zheng H, Chen K, Nykter M, Trent J, Ratner N, Lev DC, Zhang W. Genomic and molecular characterization of malignant peripheral nerve sheath tumor identifies the IGF1R pathway as a primary target for treatment. Clinical cancer research : an official journal of the American Association for Cancer Research. 2011;17:7563–7573. doi: 10.1158/1078-0432.CCR-11-1707. [DOI] [PMC free article] [PubMed] [Google Scholar]
- Yuen JS, Sim MY, Siml HG, Chong TW, Lau WK, Cheng CW, Huynh H. Inhibition of angiogenic and non-angiogenic targets by sorafenib in renal cell carcinoma (RCC) in a RCC xenograft model. British journal of cancer. 2011;104:941–947. doi: 10.1038/bjc.2011.55. [DOI] [PMC free article] [PubMed] [Google Scholar]
- Zanconato F, Cordenonsi M, Piccolo S. YAP/TAZ at the Roots of Cancer. Cancer cell. 2016;29:783–803. doi: 10.1016/j.ccell.2016.05.005. [DOI] [PMC free article] [PubMed] [Google Scholar]
Associated Data
This section collects any data citations, data availability statements, or supplementary materials included in this article.