

Abstract
Background/Objectives
Few studies have the requisite phenotypic information to define metabolic patterns that may inform the pathophysiology and consequences of diabetes in older adults. We sought to characterize clusters of older adults on the basis of shared metabolic features.
Design/Setting/Participants
2231 participants taking no glucose-lowering agents in the Cardiovascular Health Study, a population-based prospective cohort study of adults aged ≥65 years from four US field centers.
Measurements
K-means cluster analysis of eleven metabolic parameters [fasting and post-load serum glucose and plasma insulin, fasting C-peptide, body-mass index, C-reactive protein, estimated glomerular filtration rate (eGFR), albuminuria, carboxy-methyllysine (an advanced glycation end-product) and procollagen III N-terminal propeptide (a fibrotic marker)] and their associations with incident cardiovascular disease, diabetes, disability, and mortality over 8–14.5 years of follow-up, and with measures of subclinical cardiovascular disease.
Results
A six-cluster solution provided robust differentiation into distinct, identifiable clusters. Cluster A (n=739) had the lowest glucose and insulin and highest eGFR and the lowest rates of all outcomes. Cluster B (n=419) had elevated glucose and insulin and intermediate rates of most outcomes. Cluster C (n=118) had the highest insulin values, while Cluster D (n=129) had the highest glucose values with much lower insulin levels. Cluster E (n=314) had the lowest eGFR and highest albuminuria, and Cluster F (n=512) had the highest CRP values. Rates of CVD, mortality, and subclinical atherosclerosis were highest among clusters C, D, and E and were similar to rates among participants with treated diabetes. Incidence of disability was highest in Cluster C.
Conclusion
Clustering by metabolic parameters identifies distinct phenotypes that are strongly associated with key clinical and functional outcomes, even at advanced age.
Keywords: Diabetes, Insulin Resistance, Aging, Chronic Kidney Disease, Inflammation, Cardiovascular Disease, Epidemiology
Introduction
Diabetes is enormously important in older adults. Its incidence and prevalence rise until late life, resulting in a high burden at this age.1 Moreover, impaired glucose tolerance markedly elevates cardiovascular disease (CVD) risk in older adults.2
Glycemia represents a balance of glucose production and utilization and insulin secretion and sensitivity. Several other factors influence these processes, including expansion of fat mass, sarcopenia, and inflammation, all central components of aging.3 Similarly, key outcomes of diabetes, such as albuminuria, overlap with the organ fibrosis and dysfunction that characterizes aging.4 Thus, different combinations of disease risk factors and downstream physiological processes can lead to phenotypic heterogeneity. With the growth of precision medicine in elders,5 recognition of heterogeneity may improve targeting of drug and lifestyle recommendations.
In identifying natural variations or groupings of individuals, cluster analysis has particular strengths. Because it is driven by clustering across individuals and not by outcomes, it fosters an unbiased approach to examine ‘natural’ metabolic phenotypes and how they relate to prognosis. We have previously shown that cluster analysis can reduce large numbers of interrelated variables into recognizable patterns for diet and structural brain abnormalities in older adults,6, 7 and it has informed the underlying pathophysiology of metabolic disorders for decades.8–11
To understand metabolic heterogeneity among older adults more fully, we conducted cluster analysis of several biomarkers measured in the Cardiovascular Health Study (CHS), a population-based longitudinal study of CVD among 5888 community-dwelling older adults. We derived clusters using key metabolic parameters and examined risk of cardiovascular, glycemic, and geriatric outcomes across these clusters.
Research Design and Methods
Study Population
CHS is a prospective study of men and women aged 65 years or older recruited from Medicare-eligibility lists in four US communities.12, 13 In 1989–1990, 5201 participants were recruited and examined (the original cohort); in 1992–1993, 687 additional African-American participants were recruited.
The study design, objectives, and collection and measurement techniques have been published.12, 13 Examinations generally included standardized questionnaires, physical examination, and laboratory examination. Follow-up contact occurred every six months, alternating between telephone calls and clinic visits through 1999 and phone calls thereafter. Participants gave written informed consent upon enrollment. The institutional review boards at all centers approved the original recruitment and its ongoing conduct.
Metabolic Parameters
A schematic illustration of measurements is shown in Supplemental Figure S1. We used the 1996–1997 examination as the baseline for these analyses, as it was the only examination in which both the original and African-American cohorts underwent oral glucose tolerance testing (OGTT) or urine collection. Participants underwent fasting phlebotomy, random urine collection, direct height and weight measurement, and (among participants who did not use glucose-lowering medication) a standard 75-gram OGTT with two-hour post-load phlebotomy.
We selected candidate measures from available covariates in three groups – measures of glycemic status, factors associated with impaired glycemic regulation, and direct consequences of hyperglycemia. The first group included fasting and post-load serum glucose and plasma insulin and fasting C-peptide. The second included body-mass index (BMI) and C-reactive protein (CRP), and the third included cystatin-based estimated glomerular filtration rate (eGFR), urinary albumin-to-creatinine ratio (ACR), carboxy-methyllysine (CML; an advanced glycation endproduct [AGE]),14 and the N-terminal propeptide of procollagen III (PIIINP, a measure of AGE-related fibrosis).15
For clustering, we included participants at the 1996–1997 examination who were not taking glucose-lowering medication and reported fasting for at least eight hours. We subsequently included participants with treated diabetes as a comparison group. Of the 4708 participants alive in 1996–97, we excluded 1035 who did not attend the clinic visit, 590 who were ineligible, 213 with missing measurements, and 639 who declined the OGTT, leaving a final sample of 2231. The participants included were about 1.5 years younger and more likely to be female and to report good to excellent health than those excluded.
Cardiovascular and Functional Outcomes
All cases of myocardial infarction, stroke, and death in CHS are adjudicated by central committees. Details of adjudication and confirmation of these events have been published.16, 17 In these analyses, our primary composite outcome included incident myocardial infarction, stroke, and coronary or cerebrovascular mortality.
We examined two measures of subclinical vascular disease performed in 1998–1999. Carotid ultrasonography was conducted to evaluate intima-media thickness (IMT) for the internal and common carotid arteries.18 The ankle-brachial index (ABI) was assessed bilaterally in standardized fashion,19 using the ratio of the average of two blood pressure measurements in the right arm and the lower of two measurements in the right and left legs.
We included two functional measures assessed every six months during follow-up. Disability was defined as self-reported inability to perform at least one activity of daily living (ADL), including walking around home, getting out of bed/chair, dressing, bathing, eating, and toileting. Mobility limitation was defined as reported difficulty walking up 10 steps or walking ½ mile on two consecutive contacts, or at the last contact.
For incident CVD, disability, and mobility limitation, we excluded individuals with prevalent CVD (angina, myocardial infarction, bypass surgery or angioplasty, congestive heart failure, stroke, or transient ischemic attack), disability, or mobility limitation at baseline in analyses of the respective outcome.
Prevalent and Incident Diabetes
We determined the prevalence of impaired fasting glucose or impaired glucose tolerance and untreated diabetes in 1996–1997 using current American Diabetes Association cutpoints.20 To evaluate the duration of these states, we examined their prevalence in 1992–1993 in the full cohort and in 1989–1990 in the original cohort.
We ascertained incident cases of diabetes from 1996–1997 forward using multiple complementary methods. These included fasting glucose measurements in 1998–1999 and 2005–2006 and incident use of glucose-lowering medication ascertained annually with a validated medication inventory.21 In addition, we identified individuals with Medicare claims for diabetes (i.e., ICD-9 250.xx) using a stringent modification of the standard algorithm,1 which required two inpatient or three outpatient claims to define cases.
Using the 0- and 120-minute time points available from the 1996–1997 OGTT, we estimated insulin sensitivity in 1996–1997 using the modified Matsuda index.22, 23 To estimate the insulin response, we used the equation proposed by Stumvoll et al.24, 25 For comparison, we examined estimated insulin sensitivity and response using the same equations among the subset of participants who underwent OGTT in 1989–1990.
Covariates
We categorized smoking as current, former, and never. Physical activity was estimated with a modified Minnesota Leisure-time Physical Activity scale.26 Alcohol intake reported as the quantity and frequency of wine, beer, and spirits was categorized as 0, >0–1, >1–7, >7–14, and >14 drinks per week. Hypertension included a systolic blood pressure ≥140 mmHg, diastolic pressure ≥90 mmHg, or reported history of hypertension with use of antihypertensive medication.
Circulating adiponectin levels were measured in 1992–1993 and albumin levels in 1996–1997. Self-reported health was ascertained yearly as poor, fair, good, very good, and excellent. Frailty, as initially defined in CHS,27 was assessed in 1996–1997.
Statistical Analysis
We used STATA 12 (College Station, TX) for analyses. We first conducted K-means cluster analysis to identify clusters of individuals with similar values on all eleven primary metabolic variables. We winsorized right-skewed variables at the upper 99th percentile (i.e., setting values above the 99th percentile to that value) to minimize the influence of outlying values.28 We log-transformed CRP and ACR to reduce their skew. To ensure comparability, we treated the eleven variables as standardized measures (i.e., in standard-deviation units from their mean). We chose the number of clusters a priori to be between 4 and 8 to ensure reasonably robust sample sizes and to avoid over-fitting. We employed the Calinski-Harabasz pseudo-F index, which represents a ratio of the variance between clusters over that within them, to inform selection of the number of clusters; we then compared the solutions with highest index values (which maximize distance between clusters) for plausibility and interpretability.29
We examined demographic and clinical characteristics across clusters using χ2 tests for categorical variables and Kruskal-Wallis tests for continuous variables. We determined the prevalence and duration of untreated prediabetes and diabetes within each cluster in 1996–1997, four years earlier, and seven years earlier in the original cohort.
We conducted multivariable Cox proportional hazards analyses to examine associations with mortality, incident CVD, disability, mobility limitation, and diabetes and examined the proportional hazards assumption using Schoenfeld residuals. We adjusted for age, sex, race, smoking, physical activity, alcohol consumption, and hypertension; in analyses of mortality, we also adjusted for baseline CVD. Follow-up time was measured from baseline to the event of interest, if it occurred; if not, participants were censored at their date of death, loss to follow-up, or December 31, 2010, whichever came first. To avoid violations of the proportional hazards assumption, we further truncated follow-up time at ten years for incident CVD and at eight years for incident disability.
Lastly, we examined ABI and carotid IMT with linear regression. We limited ABI analyses to participants with ABI<1.4. We standardized common and internal carotid IMT measurements, averaged them, and present results across clusters in standard-deviation units. For both subclinical measures, we adjusted for similar covariates as in Cox analyses.
Results
Identification of Clusters
Five- and six-cluster solutions yielded metabolic clusters with the highest Calinski-Harabasz pseudo-F index values (286 and 271). Figure 1 and Supplemental Figure S2 illustrate the six-cluster solution. Table 1 shows their characteristics according to clustering variables. Cluster A had the lowest levels of glucose, insulin, and albuminuria and the highest eGFR. Clusters B and C were characterized by elevated fasting and postload insulin; the latter cluster also manifest elevated fasting and postload glucose levels. Cluster D had markedly elevated glucose levels without corresponding elevation in insulin levels. Cluster E was characterized by diminished eGFR in the chronic kidney disease (CKD) range and increased levels of ACR, CML, and PIIINP. Cluster F was marked chiefly by high levels of CRP. For comparison, the five-cluster solution tended to group all hyperglycemic individuals into a single cluster, regardless of insulin levels. The seven-cluster solution (Calinski-Harabasz pseudo-F index value 249) identified a cluster with increased CML but no other distinguishing characteristics.
Figure 1. Six-cluster grouping of CHS participants according to levels of 11 metabolic parameters.
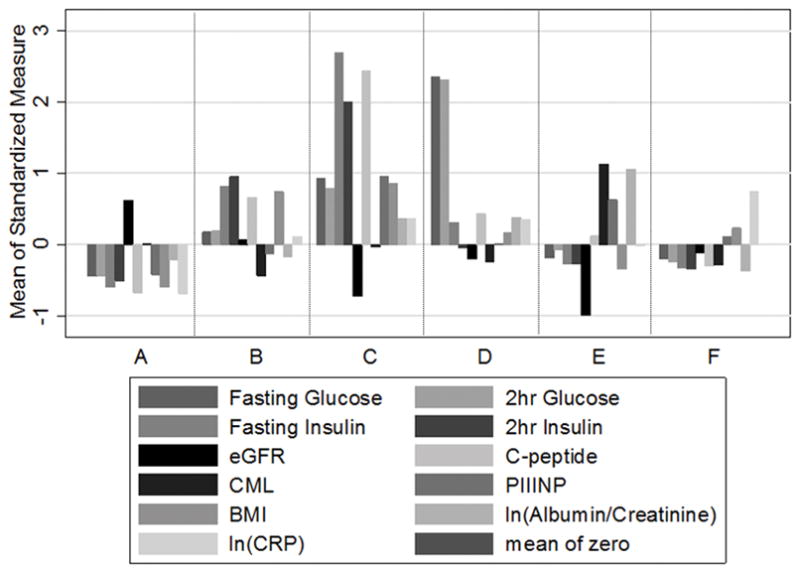
The mean standardized value of each parameter within-cluster is shown on the ordinate. Numbers in parentheses indicate cluster size.
Table 1.
Demographic and Clinical Characteristics According to Metabolic Cluster.
| Risk Factor | A N=739 |
B N=419 |
C N=118 |
C N=129 |
E N=314 |
F N=512 |
|---|---|---|---|---|---|---|
| Age (years) | 77.7 (4.4) | 76.7 (3.9) | 77.1 (3.8) | 78.3 (5.0) | 80.3 (5.0) | 77.5 (4.3) |
| Male | 273 (37) | 143 (34) | 51 (43) | 59 (46) | 162 (52) | 214 (42) |
| Black race | 91 (12) | 70 (17) | 17 (14) | 19 (15) | 40 (13) | 88 (17) |
| Current smoking | 62 (8) | 28 (7) | 3 (3) | 8 (6) | 25 (8) | 40 (8) |
| Alcohol abstention | 374 (50.6) | 227 (54.2) | 78 (66.1) | 68 (52.7) | 177 (56.4) | 277 (54.1) |
| Physical activity >median* | 225 (30) | 74 (18) | 16 (14) | 23 (18) | 49 (16) | 120 (23) |
| Waist (cm) | 89 (10) | 105 (12) | 107 (12) | 100 (11) | 94 (11) | 99 (11) |
| BMI 4 years prior† (kg/m2) | 24.2 (2.9) | 29.6 (4.3) | 30.4 (4.2) | 27.9 (3.6) | 25.6 (3.5) | 27.6 (4.0) |
| 4 yr weight change‡ (lb) | −1.56 (8.20) | 0.97 (8.99) | −1.81 (10.5) | −3.49 (11.4) | −3.80 (10.2) | −0.81 (0.92) |
| Good or better health | 627 (85) | 340 (81) | 85 (72) | 106 (82) | 228 (73) | 414 (81) |
| Frailty status | ||||||
| Not frail | 338 (51) | 136 (37) | 28 (27) | 31 (28) | 67 (26) | 179 (40) |
| Intermediate frail | 303 (45) | 199 (54) | 59 (58) | 67 (60) | 149 (57) | 227 (51) |
| Frail | 27 (4) | 34 (9) | 15 (15) | 13 (12) | 45 (17) | 40 (9) |
| Hypertension | 366 (50) | 278 (66) | 85 (72) | 91 (71) | 212 (68) | 302 (59) |
| Coronary heart disease | 121 (16) | 88 (21) | 37 (31) | 35 (27) | 105 (33) | 97 (19) |
| Congestive heart failure | 28 (4) | 26 (6) | 12 (10) | 13 (10) | 48 (15) | 20 (4) |
| Cerebrovascular disease | 41 (6) | 31 (7) | 19 (16) | 13 (10) | 43 (14) | 32 (6) |
| Albumin (gm/dl) | 3.78 (0.29) | 3.84 (0.28) | 3.84 (0.28) | 3.82 (0.30) | 3.80 (0.32) | 3.73 (0.28) |
| Adiponectin (mg/L) | 16.2 (7.6) | 10.5 (4.7) | 9.12 (4.13) | 11.1 (5.4) | 15.6 (8.1) | 13.3 (6.5) |
| CLUSTERING VARIABLES | ||||||
| Fasting glucose (mg/dl) | 88.4 (7.8) | 96.2 (8.7) | 105.7 (14.0) | 123.5 (15.5) | 91.6 (8.8) | 91.5 (8.6) |
| Fasting insulin (μU/mL) | 5.4 (2.3) | 13.3 (3.6) | 23.6 (5.5) | 10.5 (4.8) | 7.3 (3.3) | 6.9 (2.5) |
| 2-hr glucose (mg/dl) | 117 (36) | 149 (36) | 179 (54) | 255 (41) | 136 (40) | 127 (36) |
| 2-hr insulin (μU/mL) | 47.8 (27.1) | 130.5 (59.8) | 189.4 (74.8) | 73.5 (33.7) | 61.3 (33.4) | 57.5 (26.5) |
| eGFR | 82.5 (14.3) | 72.5 (15.4) | 58.3 (15.7) | 67.6 (18.1) | 53.5 (16.4) | 69.1 (13.9) |
| C-peptide (ng/mL) | 1.81 (0.49) | 3.26 (0.71) | 5.18 (0.96) | 3.01 (0.88) | 2.67 (1.02) | 2.21 (0.56) |
| CML (ng/mL) | 619 (150) | 540 (122) | 612 (191) | 573 (141) | 818 (231) | 567 (122) |
| PIIINP (ng/L) | 4.05 (1.05) | 4.48 (1.15) | 6.15 (1.97) | 4.71 (1.53) | 5.64 (1.81) | 4.86 (1.51) |
| BMI (kg/m2) | 24.1 (2.90) | 30.0 (4.46) | 30.5 (4.26) | 27.4 (3.93) | 25.3 (3.55) | 27.7 (3.91) |
| Albumin/creatinine ratio | 0.013 (0.039) | 0.014 (0.027) | 0.037 (0.089) | 0.036 (0.057) | 0.080 (0.142) | 0.010 (0.018) |
| CRP (mg/L) | 1.55 (1.52) | 3.70 (3.42) | 5.23 (5.27) | 5.99 (6.84) | 3.74 (4.65) | 6.92 (6.31) |
Results shown are mean (standard deviation) or N (percentage). All comparisons shown are statistically significant except black race. Percentages may not sum to 1 due to rounding.
Median physical activity was 1442 kcal/day.
N=2186
N=2196
Clinical, Demographic, and Glycemic Characteristics
Table 1 provides clinical and demographic characteristics of participants according to cluster. The mean age was nearly 80 years and approximately 40% were male. Albumin levels, a negative acute phase reactant, were lowest in Cluster F. Frailty was most prevalent in Cluster E.
Table 2 illustrates the prevalence of prediabetes and diabetes across the six clusters. Virtually all participants with untreated diabetes were in Cluster D. Likewise, virtually all participants in that cluster had diabetes at study baseline and either impaired glucose tolerance or frank diabetes seven years earlier.
Table 2.
Prevalent Glycemia According to Metabolic Cluster.
| A | B | C | D | E | F | P-value | |
|---|---|---|---|---|---|---|---|
| Glycemic Status at Baseline (1996–1997) | |||||||
| Normal | 530 (72) | 120 (29) | 8 (7) | 0 (0) | 164 (52) | 304 (59) | <.001 |
| Prediabetes | 186 (25) | 262 (63) | 74 (63) | 4(3) | 124 (39) | 188 (37) | |
| Diabetes | 23 (3) | 37 (9) | 36(31) | 125 (97) | 26 (8) | 20 (4) | |
| Modified Matsuda index | 8.33 (5.89) | 2.31 (0.85) | 1.34 (0.90) | 2.55 (1.23) | 5.84 (4.91) | 5.87 (3.98) | <.001 |
| Estimated insulin response | 1066 (308) | 1640 (483) | 2161 (727) | 28 (552) | 1067 (391) | 1085 (329) | <.001 |
| Glycemic Status 4–7 Years Earlier | |||||||
| 1992–93 (n=2137) | |||||||
| Normal | 561 (79) | 205 (52) | 36 (32) | 11 (9) | 202 (68) | 349 (71) | <.001 |
| Prediabetes | 145 (20) | 183 (46) | 69 (62) | 84 (67) | 94 (31) | 141 (28) | |
| Diabetes | 5 (1) | 6 (2) | 7 (6) | 31 (25) | 3 (1) | 5 (1) | |
| 1989–90 (n=1969) | |||||||
| Normal | 371 (56) | 98 (27) | 15 (15) | 1 (1) | 107 (38) | 201 (45) | <.001 |
| Prediabetes | 274 (41) | 228 (63) | 67 (66) | 50 (44) | 151 (54) | 229 (52) | |
| Diabetes | 22 (3) | 37 (10) | 20 (20) | 62 (55) | 24 (9) | 12 (3) | |
| Modified Matsuda index | 4.81 (2.40) | 2.52 (1.47) | 1.86 (1.21) | 1.99 (0.94) | 3.82 (2.00) | 4.15 (2.19) | <.001 |
| Estimated insulin response | 1242 (392) | 1685 (610) | 2045 (896) | 886 (775) | 1310 (483) | 1272 (393) | <.001 |
Prediabetes: fasting glucose 100–125 mg/dl OR 2-hour glucose 140–199 mg/dl
Diabetes: fasting glucose >=126 mg/dl OR 2-hour glucose>=200 mg/dl OR random glucose>=200 mg/dl
Insulin sensitivity estimated by the modified Matsuda index were lower in Clusters B and C than in A (Table 2). In contrast, estimated insulin secretion was profoundly lowest in Cluster D and was highest in Clusters B and C. Seven years earlier, estimated insulin secretion was again highest in those two clusters and was similar to values in 1996–1997; values in Cluster D in 1989–90 were again lowest but were much closer to the other clusters at that time.
Table 3 provides adjusted hazard ratios for risk of incident ADA-defined diabetes during follow-up. Consistent with results from Table 2, risk was 14-fold higher for incident diabetes among individuals in Cluster D than in Cluster A. Risk was graded in the remaining clusters, decreasing from Cluster D to Cluster F, but all had significantly higher risk than Cluster A.
Table 3.
Risks of Mortality, CVD, Disability, Mobility Limitation, and Diabetes According to Metabolic Cluster
| A | B | C | D | E | F | |
|---|---|---|---|---|---|---|
| Diabetes | ||||||
| Number at risk | 702 | 377 | 90 | 56 | 285 | 482 |
| Number of cases | 39 | 76 | 20 | 24 | 30 | 48 |
| Adjusted hazard ratio* (95% CI) | 1.00 (ref) | 3.87 (2.62, 5.73) | 5.67 (3.28, 9.80) | 14.15 (8.44, 23.71) | 2.98 (1.83, 4.84) | 1.92 (1.26, 2.94) |
|
| ||||||
| Mortality | ||||||
| Number at risk | 739 | 419 | 118 | 129 | 314 | 512 |
| Number of cases | 427 | 228 | 89 | 99 | 272 | 327 |
| Adjusted hazard ratio (95% CI) | 1.00 (ref) | 0.90 (0.76, 1.06) | 1.64 (1.30, 2.08) | 1.56 (1.25, 1.95) | 1.78 (1.51, 2.08) | 1.15 (0.99, 1.33) |
|
| ||||||
| CVD | ||||||
| Number at risk | 573 | 305 | 65 | 83 | 169 | 379 |
| Number of cases | 120 | 75 | 26 | 33 | 67 | 85 |
| Adjusted hazard ratio (95% CI) | 1.00 (ref) | 1.17 (0.87, 1.57) | 2.26 (1.46, 3.50) | 2.10 (1.42, 3.11) | 1.85 (1.36, 2.52) | 1.11 (0.84, 1.48) |
|
| ||||||
| Disability | ||||||
| Number at risk | 672 | 345 | 91 | 101 | 262 | 413 |
| Number of cases | 308 | 185 | 55 | 50 | 137 | 218 |
| Adjusted hazard ratio (95% CI) | 1.00 (ref) | 1.36 (1.13, 1.65) | 1.76 (1.31, 2.36) | 1.19 (0.88, 1.60) | 1.31 (1.06, 1.62) | 1.35 (1.14, 1.61) |
|
| ||||||
| Mobility Limitation | ||||||
| Number at risk | 617 | 268 | 57 | 81 | 185 | 356 |
| Number of cases | 476 | 226 | 49 | 65 | 156 | 300 |
| Adjusted hazard ratio (95% CI) | 1.00 (ref) | 1.29 (1.09, 1.51) | 1.88 (1.39, 2.54) | 1.61 (1.24, 2.10) | 1.55 (1.28, 1.87) | 1.44 (1.24, 1.67) |
Hazard ratios derived from proportional hazards regression models adjusted for age, sex, race, smoking, physical activity, alcohol consumption, and hypertension; mortality analyses further adjusted for prevalent CVD. Adjusted hazard ratios (95% CI) among participants taking diabetes medications were 1.32 (1.17, 1.49) for mortality; 1.45 (1.14, 1.84) for CVD, 1.41 (1.18, 1.68) for disability, and 1.51 (1.28, 1.77) for mobility limitation. Maximal follow-up time was 14.5 years for mortality, diabetes, and mobility limitation, 10 years for CVD, and 8 years for disability.
Mortality, CVD, Disability, and Mobility Limitation
Table 3 also demonstrates mortality, incident CVD, incident disability, and incident mobility limitation according to cluster. In general, risks for CVD and death were highest and roughly similar in magnitude in Clusters C, D, and E. In contrast, Clusters B and F did not clearly increase risk of mortality or CVD relative to Cluster A. This general pattern also extended to incident mobility limitation but differed for incident disability, where risk was not statistically significantly increased among those in Cluster D but was roughly doubled among those in Cluster C. For comparison, adjusted hazard ratios and 95% confidence intervals (CI) among participants taking diabetes medications were 1.32 (95% CI, 1.17, 1.49) for mortality; 1.45 (95% CI, 1.14, 1.84) for CVD, 1.41 (95% CI, 1.18, 1.68) for disability, and 1.51 (95% CI, 1.28, 1.77) for mobility limitation when compared with the metabolically healthy cluster.
Subclinical Atherosclerosis
Supplemental Table S1 provides differences in ABI and carotid IMT according to cluster. In both cases, Cluster A had the most desirable values, but the two measures differed in their relations with other clusters. For ABI, Cluster D had the lowest values, and only Cluster E also differed significantly from the metabolically healthy. In contrast, every cluster had higher IMT values than Cluster A, highlighted by the particularly strong association with Cluster C.
Supplemental Table S2 summarizes the relative associations of the clinical and subclinical outcomes.
Conclusions
In this prospective cohort study, we differentiated six metabolic clusters of individuals. These clusters were associated with all outcomes that we evaluated and correspond well with recognizable metabolic signatures, despite the unsupervised learning inherent in this approach. Specifically, these clusters were notable for relative metabolic health (Cluster A), elevated glucose and insulin suggestive of insulin resistance (Cluster B), greater elevations suggestive of more marked insulin resistance (Cluster C), unrecognized diabetes with low insulin values (Cluster D), CKD (Cluster E), and isolated inflammation (Cluster F).
An attractive advantage of unsupervised methods like cluster analysis is their ability to identify natural groupings of individuals and, in so doing, test the validity of traditional clinical phenotypes. In this regard, our results generally match established pathophysiology. In particular, Cluster D manifested an impaired insulin response and was virtually synonymous with diabetes, with nearly all individuals having longstanding glucose intolerance. Although this appropriately reflects the long-established recognition that type 2 diabetes occurs when insulin secretion fails to meet the increasing demands of insulin resistance,30, 31 estimated insulin secretion was dramatically reduced in that cluster. Given that estimated insulin secretion was not nearly as depressed seven years earlier, our results suggest that interim loss of β-cell function is a central feature of diabetes that occurs late in life, presumably reflecting progressive pancreatic exhaustion and possibly the superimposition of islet-cell destruction from late-life autoimmunity or amyloid deposition.32, 33
Our results also identify two clusters (Clusters B and C) in which estimated insulin resistance was higher than in Cluster A; as expected, these were associated with several-fold increases in risk of diabetes. Of note, the more Cluster C, in which glucose and insulin levels were more markedly elevated, was prospectively associated with CVD and mortality at least as strongly as treated diabetes, but Cluster B, with more modest elevations in these levels, was not. This offers the possibility that lifestyle modification similar to that found to be effective in older adults in the Diabetes Prevention Program34 may have longer-term benefits on CVD and death if it can successfully forestall progression of insulin resistance.
Cluster E contained participants with multiple features of CKD and an average eGFR in the range of moderate CKD. These individuals also had elevated levels of PIIINP, a marker of systemic fibrosis unlikely to be elevated due to reduced renal clearance alone.35 that implicates renal fibrosis in the pathogenesis of kidney disease in older adults.36 Although this cluster was associated with all the outcomes we studied, these participants were at highest risk for mortality, consistent with previous observations within CHS on the strong prognostic import of both cystatin C and albuminuria.37, 38
Cluster F, characterized by isolated inflammation, had higher levels of CRP and lower levels of albumin, suggesting that this cluster was indeed marked by systemic inflammation. This cluster was associated with increases in incident disability and diabetes but not with higher rates of CVD or death, despite the positive association of inflammation with short-term mortality in earlier analyses.39 One possible explanation is that this cluster is marked by both higher BMI and inflammation, which have competing associations with mortality in CHS.40
Our results have potential implications for mitigating metabolic risk in late life. By identifying recognizable, physiologically plausible clusters of elders, our results enable targeting of preventative strategies to specific physiological states. For example, the CKD group might be appropriate for novel antifibrotic therapies,41 while emerging efforts to reduce inflammation directly42 might target the isolated inflammation cluster.
Cluster analysis and other data-reduction approaches have long been used to study chronic metabolic disorders. Recognition that insulin resistance clustered with other CVD risk factors9, 10 led to the adoption of metabolic syndrome as a discrete entity, but these approaches have also identified subsets of individuals with type I diabetes who carry diverse prognoses43 and disentangled those risk factors that are central or peripheral to the metabolic syndrome.8, 44 Our approach extends previous efforts that defined the metabolic syndrome to older adults and new metabolic biomarkers.
Specific limitations warrant discussion. CHS has measured numerous metabolic factors that are uncommon in large cohort studies, like post-load glucose and insulin and CML. However, hemoglobin A1c was only measured at the North Carolina site in 1989–90, and erythrocytes with which to measure it were not stored, although hemoglobin A1c was unrelated to subclinical or clinical CVD within CHS.45, 46 Similarly, total cholesterol but not its subfractions were available in 1996–1997, limiting our ability to describe clusters on the basis of all metabolic syndrome components, although associations of lipid fractions with CVD are modest in CHS.47
The CHS OGTT only included fasting and two-hour measurements, and hence estimated values for insulin sensitivity and secretion rely upon equations that are imperfectly associated with gold-standard approaches and have not been specifically validated in external populations. Likewise, no insulinogenic index to integrate insulin secretion and sensitivity was available.48
Cluster analysis requires judgment regarding the numbers of clusters and candidate variables. We included several variables measured concurrently that are intimately connected with glycemic regulation. Nonetheless, the wealth of CHS data necessarily means that other variables were not included. We also examined multiple potential solutions and found that six clusters yielded meaningful information without arbitrary distinctions, but confirmation of our findings in cohorts with similar data is desirable.
In summary, even in late life, older adults can be separated into meaningful metabolic clusters defined by insulin resistance, impaired insulin response, kidney disease, and inflammation that are associated with risk of death, CVD, disability, and diabetes. Efforts to reduce the development of these risk factors in middle age may yield large benefits on the health of Americans living into their eighth decades and beyond.
Supplementary Material
Supplemental Figure S1. Schematic diagram of recruitment, measurements, and follow-up in CHS.
The original cohort was enrolled in 1989–1990 and underwent an OGTT; a second African-American cohort was enrolled in 1992–1993 but only underwent fasting blood collection. Variables used to define metabolic clusters were collected in 1996–1997. Follow-up for incident diabetes, disability, mobility limitation, cardiovascular disease, and mortality based on these clusters began in 1996. Subclinical vascular measurements were conducted in 1998–1999.
Supplemental Figure S2. Six-cluster grouping of CHS participants according to levels of 11 metabolic parameters.
The mean standardized value of each parameter within-cluster is shown on the ordinate. Numbers in parentheses indicate cluster size.
Supplemental Table S1. Measures of carotid and peripheral atherosclerosis according to metabolic cluster.
Supplemental Table S2. Summary of relative associations of metabolic clusters with incident clinical events and subclinical atherosclerosis.
Impact.
We certify that this work is novel. It characterizes the distinctive clusters into which metabolic factors such as glycemia, inflammation, and fibrosis segregate older adults.
Acknowledgments
Sponsor’s Role
This research was supported by contracts HHSN268201200036C, HHSN268200800007C, N01HC55222, N01HC85079, N01HC85080, N01HC85081, N01HC85082, N01HC85083, N01HC85086, and grants R01HL094555, U01HL080295, and U01HL130114 from the National Heart, Lung, and Blood Institute (NHLBI), with additional contribution from the National Institute of Neurological Disorders and Stroke (NINDS). Additional support was provided by R01AG053325 and R01AG023629 from the National Institute on Aging (NIA). A full list of principal CHS investigators and institutions can be found at CHS-NHLBI.org. NHLBI collaborated with CHS investigators on the original design, methods, and subject recruitment of CHS, but had no role in these analyses or preparation of this paper.
Footnotes
Author Contributions
KJM researched data, wrote manuscript. DSS researched data, contributed to discussion, reviewed/edited manuscript. IHDB contributed to discussion, reviewed/edited manuscript. JHI, JRK, LD, ALF, RPT researched data, contributed to discussion, reviewed/edited manuscript. EJB, SEK, contributed to discussion, reviewed/edited manuscript. AMA researched data, contributed to discussion, reviewed/edited manuscript.
Conflict of Interest
S.E.K. is a consultant/advisory board member for Boehringer Ingelheim, Elcelyx, Eli Lilly and Co., GlaxoSmithKline, Intarcia Therapeutics, Janssen, Merck Sharp & Dohme, Novo Nordisk, and Receptos and has received grant support from Eli Lilly and Co. No other authors have identified potential conflicts of interest relevant to this article.
References
- 1.Sloan FA, Bethel MA, Ruiz D, Jr, Shea AM, Feinglos MN. The growing burden of diabetes mellitus in the US elderly population. Arch Intern Med. 2008;168:192–199. doi: 10.1001/archinternmed.2007.35. discussion 199. [DOI] [PubMed] [Google Scholar]
- 2.Barzilay JI, Spiekerman CF, Wahl PW, et al. Cardiovascular disease in older adults with glucose disorders: comparison of American Diabetes Association criteria for diabetes mellitus with WHO criteria. Lancet. 1999;354:622–625. doi: 10.1016/s0140-6736(98)12030-5. [DOI] [PubMed] [Google Scholar]
- 3.Jensen GL. Inflammation: roles in aging and sarcopenia. JPEN J Parenter Enteral Nutr. 2008;32:656–659. doi: 10.1177/0148607108324585. [DOI] [PubMed] [Google Scholar]
- 4.Torres VE, Leof EB. Fibrosis, regeneration, and aging: playing chess with evolution. Journal of the American Society of Nephrology : JASN. 2011;22:1393–1396. doi: 10.1681/ASN.2011060603. [DOI] [PubMed] [Google Scholar]
- 5.Mohler J, Najafi B, Fain M, Ramos KS. Precision Medicine: A Wider Definition. J Am Geriatr Soc. 2015;63:1971–1972. doi: 10.1111/jgs.13620. [DOI] [PubMed] [Google Scholar]
- 6.Diehr P, Beresford SA. The relation of dietary patterns to future survival, health, and cardiovascular events in older adults. J Clin Epidemiol. 2003;56:1224–1235. doi: 10.1016/s0895-4356(03)00202-6. [DOI] [PubMed] [Google Scholar]
- 7.Longstreth WT, Jr, Diehr P, Manolio TA, Beauchamp NJ, Jungreis CA, Lefkowitz D. Cluster analysis and patterns of findings on cranial magnetic resonance imaging of the elderly: the Cardiovascular Health Study. Arch Neurol. 2001;58:635–640. doi: 10.1001/archneur.58.4.635. [DOI] [PubMed] [Google Scholar]
- 8.Sakkinen PA, Wahl P, Cushman M, Lewis MR, Tracy RP. Clustering of procoagulation, inflammation, and fibrinolysis variables with metabolic factors in insulin resistance syndrome. Am J Epidemiol. 2000;152:897–907. doi: 10.1093/aje/152.10.897. [DOI] [PubMed] [Google Scholar]
- 9.Wingard DL, Barrett-Connor E, Criqui MH, Suarez L. Clustering of heart disease risk factors in diabetic compared to nondiabetic adults. Am J Epidemiol. 1983;117:19–26. doi: 10.1093/oxfordjournals.aje.a113510. [DOI] [PubMed] [Google Scholar]
- 10.Criqui MH, Cowan LD, Heiss G, Haskell WL, Laskarzewski PM, Chambless LE. Frequency and clustering of nonlipid coronary risk factors in dyslipoproteinemia. The Lipid Research Clinics Program Prevalence Study. Circulation. 1986;73:I40–50. [PubMed] [Google Scholar]
- 11.Schmidt MI, Watson RL, Duncan BB, et al. Clustering of dyslipidemia, hyperuricemia, diabetes, and hypertension and its association with fasting insulin and central and overall obesity in a general population. Atherosclerosis Risk in Communities Study Investigators. Metabolism. 1996;45:699–706. doi: 10.1016/s0026-0495(96)90134-1. [DOI] [PubMed] [Google Scholar]
- 12.Fried LP, Borhani NO, Enright P, et al. The Cardiovascular Health Study: design and rationale. Ann Epidemiol. 1991;1:263–276. doi: 10.1016/1047-2797(91)90005-w. [DOI] [PubMed] [Google Scholar]
- 13.Cushman M, Cornell ES, Howard PR, Bovill EG, Tracy RP. Laboratory methods and quality assurance in the Cardiovascular Health Study. Clin Chem. 1995;41:264–270. [PubMed] [Google Scholar]
- 14.Miyata T, Wada Y, Cai Z, et al. Implication of an increased oxidative stress in the formation of advanced glycation end products in patients with end-stage renal failure. Kidney Int. 1997;51:1170–1181. doi: 10.1038/ki.1997.160. [DOI] [PubMed] [Google Scholar]
- 15.Keller F, Rehbein C, Schwarz A, et al. Increased procollagen III production in patients with kidney disease. Nephron. 1988;50:332–337. doi: 10.1159/000185198. [DOI] [PubMed] [Google Scholar]
- 16.Psaty BM, Kuller LH, Bild D, et al. Methods of assessing prevalent cardiovascular disease in the Cardiovascular Health Study. Ann Epidemiol. 1995;5:270–277. doi: 10.1016/1047-2797(94)00092-8. [DOI] [PubMed] [Google Scholar]
- 17.Ives DG, Fitzpatrick AL, Bild DE, et al. Surveillance and ascertainment of cardiovascular events. The Cardiovascular Health Study. Ann Epidemiol. 1995;5:278–285. doi: 10.1016/1047-2797(94)00093-9. [DOI] [PubMed] [Google Scholar]
- 18.O’Leary DH, Polak JF, Wolfson SK, Jr, et al. Use of sonography to evaluate carotid atherosclerosis in the elderly. The Cardiovascular Health Study. CHS Collaborative Research Group. Stroke. 1991;22:1155–1163. doi: 10.1161/01.str.22.9.1155. [DOI] [PubMed] [Google Scholar]
- 19.Newman AB, Siscovick DS, Manolio TA, et al. Ankle-arm index as a marker of atherosclerosis in the Cardiovascular Health Study. Cardiovascular Heart Study (CHS) Collaborative Research Group. Circulation. 1993;88:837–845. doi: 10.1161/01.cir.88.3.837. [DOI] [PubMed] [Google Scholar]
- 20.Wahl PW, Savage PJ, Psaty BM, Orchard TJ, Robbins JA, Tracy RP. Diabetes in older adults: comparison of 1997 American Diabetes Association classification of diabetes mellitus with 1985 WHO classification. Lancet. 1998;352:1012–1015. doi: 10.1016/S0140-6736(98)04055-0. [DOI] [PubMed] [Google Scholar]
- 21.Smith NL, Psaty BM, Heckbert SR, Tracy RP, Cornell ES. The reliability of medication inventory methods compared to serum levels of cardiovascular drugs in the elderly. J Clin Epidemiol. 1999;52:143–146. doi: 10.1016/s0895-4356(98)00141-3. [DOI] [PubMed] [Google Scholar]
- 22.Matsuda M, DeFronzo RA. Insulin sensitivity indices obtained from oral glucose tolerance testing: comparison with the euglycemic insulin clamp. Diabetes Care. 1999;22:1462–1470. doi: 10.2337/diacare.22.9.1462. [DOI] [PubMed] [Google Scholar]
- 23.DeFronzo RA, Matsuda M. Reduced time points to calculate the composite index. Diabetes Care. 2010;33:e93. doi: 10.2337/dc10-0646. [DOI] [PubMed] [Google Scholar]
- 24.Stumvoll M, Mitrakou A, Pimenta W, et al. Use of the oral glucose tolerance test to assess insulin release and insulin sensitivity. Diabetes Care. 2000;23:295–301. doi: 10.2337/diacare.23.3.295. [DOI] [PubMed] [Google Scholar]
- 25.Stumvoll M, Van Haeften T, Fritsche A, Gerich J. Oral glucose tolerance test indexes for insulin sensitivity and secretion based on various availabilities of sampling times. Diabetes Care. 2001;24:796–797. doi: 10.2337/diacare.24.4.796. [DOI] [PubMed] [Google Scholar]
- 26.Taylor HL, Jacobs DR, Jr, Schucker B, Knudsen J, Leon AS, Debacker G. A questionnaire for the assessment of leisure time physical activities. J Chronic Dis. 1978;31:741–755. doi: 10.1016/0021-9681(78)90058-9. [DOI] [PubMed] [Google Scholar]
- 27.Fried LP, Tangen CM, Walston J, et al. Frailty in older adults: evidence for a phenotype. J Gerontol A Biol Sci Med Sci. 2001;56:M146–156. doi: 10.1093/gerona/56.3.m146. [DOI] [PubMed] [Google Scholar]
- 28.Kadafar K. John Tukey and robustness. Stat Sci. 2003;18:319–331. [Google Scholar]
- 29.Caliński T, Harabasz J. A dendrite method for cluster analysis. Communications in Statistics. 1974;3:1–27. [Google Scholar]
- 30.Kahn SE, Hull RL, Utzschneider KM. Mechanisms linking obesity to insulin resistance and type 2 diabetes. Nature. 2006;444:840–846. doi: 10.1038/nature05482. [DOI] [PubMed] [Google Scholar]
- 31.Kahn SE, Zraika S, Utzschneider KM, Hull RL. The beta cell lesion in type 2 diabetes: there has to be a primary functional abnormality. Diabetologia. 2009;52:1003–1012. doi: 10.1007/s00125-009-1321-z. [DOI] [PMC free article] [PubMed] [Google Scholar]
- 32.Barinas-Mitchell E, Kuller LH, Pietropaolo S, Zhang YJ, Henderson T, Pietropaolo M. The prevalence of the 65-kilodalton isoform of glutamic acid decarboxylase autoantibodies by glucose tolerance status in elderly patients from the cardiovascular health study. J Clin Endocrinol Metab. 2006;91:2871–2877. doi: 10.1210/jc.2005-2667. [DOI] [PubMed] [Google Scholar]
- 33.Jurgens CA, Toukatly MN, Fligner CL, et al. beta-cell loss and beta-cell apoptosis in human type 2 diabetes are related to islet amyloid deposition. Am J Pathol. 2011;178:2632–2640. doi: 10.1016/j.ajpath.2011.02.036. [DOI] [PMC free article] [PubMed] [Google Scholar]
- 34.Crandall J, Schade D, Ma Y, et al. The influence of age on the effects of lifestyle modification and metformin in prevention of diabetes. J Gerontol A Biol Sci Med Sci. 2006;61:1075–1081. doi: 10.1093/gerona/61.10.1075. [DOI] [PMC free article] [PubMed] [Google Scholar]
- 35.Jensen LT. The aminoterminal propeptide of type III procollagen. Studies on physiology and pathophysiology. Dan Med Bull. 1997;44:70–78. [PubMed] [Google Scholar]
- 36.Karam Z, Tuazon J. Anatomic and physiologic changes of the aging kidney. Clin Geriatr Med. 2013;29:555–564. doi: 10.1016/j.cger.2013.05.006. [DOI] [PubMed] [Google Scholar]
- 37.Shlipak MG, Sarnak MJ, Katz R, et al. Cystatin C and the risk of death and cardiovascular events among elderly persons. N Engl J Med. 2005;352:2049–2060. doi: 10.1056/NEJMoa043161. [DOI] [PubMed] [Google Scholar]
- 38.Cao JJ, Biggs ML, Barzilay J, et al. Cardiovascular and mortality risk prediction and stratification using urinary albumin excretion in older adults ages 68–102: the Cardiovascular Health Study. Atherosclerosis. 2008;197:806–813. doi: 10.1016/j.atherosclerosis.2007.07.029. [DOI] [PubMed] [Google Scholar]
- 39.Jenny NS, Yanez ND, Psaty BM, Kuller LH, Hirsch CH, Tracy RP. Inflammation biomarkers and near-term death in older men. Am J Epidemiol. 2007;165:684–695. doi: 10.1093/aje/kwk057. [DOI] [PubMed] [Google Scholar]
- 40.Diehr P, O’Meara ES, Fitzpatrick A, Newman AB, Kuller L, Burke G. Weight, mortality, years of healthy life, and active life expectancy in older adults. J Am Geriatr Soc. 2008;56:76–83. doi: 10.1111/j.1532-5415.2007.01500.x. [DOI] [PMC free article] [PubMed] [Google Scholar]
- 41.Cho ME, Kopp JB. Pirfenidone: an anti-fibrotic therapy for progressive kidney disease. Expert Opin Investig Drugs. 2010;19:275–283. doi: 10.1517/13543780903501539. [DOI] [PMC free article] [PubMed] [Google Scholar]
- 42.Ridker PM, Luscher TF. Anti-inflammatory therapies for cardiovascular disease. Eur Heart J. 2014;35:1782–1791. doi: 10.1093/eurheartj/ehu203. [DOI] [PMC free article] [PubMed] [Google Scholar]
- 43.Ciampi A, Schiffrin A, Thiffault J, et al. Cluster analysis of an insulin-dependent diabetic cohort towards the definition of clinical subtypes. J Clin Epidemiol. 1990;43:701–715. doi: 10.1016/0895-4356(90)90041-m. [DOI] [PubMed] [Google Scholar]
- 44.Maison P, Byrne CD, Hales CN, Day NE, Wareham NJ. Do different dimensions of the metabolic syndrome change together over time? Evidence supporting obesity as the central feature. Diabetes Care. 2001;24:1758–1763. doi: 10.2337/diacare.24.10.1758. [DOI] [PubMed] [Google Scholar]
- 45.Chonchol M, Katz R, Fried LF, et al. Glycosylated hemoglobin and the risk of death and cardiovascular mortality in the elderly. Nutrition, metabolism, and cardiovascular diseases : NMCD. 2010;20:15–21. doi: 10.1016/j.numecd.2009.02.007. [DOI] [PMC free article] [PubMed] [Google Scholar]
- 46.Zieman SJ, Kamineni A, Ix JH, et al. Hemoglobin A1c and arterial and ventricular stiffness in older adults. PLoS One. 2012;7:e47941. doi: 10.1371/journal.pone.0047941. [DOI] [PMC free article] [PubMed] [Google Scholar]
- 47.Psaty BM, Anderson M, Kronmal RA, et al. The association between lipid levels and the risks of incident myocardial infarction, stroke, and total mortality: The Cardiovascular Health Study. J Am Geriatr Soc. 2004;52:1639–1647. doi: 10.1111/j.1532-5415.2004.52455.x. [DOI] [PubMed] [Google Scholar]
- 48.Retnakaran R, Shen S, Hanley AJ, Vuksan V, Hamilton JK, Zinman B. Hyperbolic relationship between insulin secretion and sensitivity on oral glucose tolerance test. Obesity. 2008;16:1901–1907. doi: 10.1038/oby.2008.307. [DOI] [PubMed] [Google Scholar]
Associated Data
This section collects any data citations, data availability statements, or supplementary materials included in this article.
Supplementary Materials
Supplemental Figure S1. Schematic diagram of recruitment, measurements, and follow-up in CHS.
The original cohort was enrolled in 1989–1990 and underwent an OGTT; a second African-American cohort was enrolled in 1992–1993 but only underwent fasting blood collection. Variables used to define metabolic clusters were collected in 1996–1997. Follow-up for incident diabetes, disability, mobility limitation, cardiovascular disease, and mortality based on these clusters began in 1996. Subclinical vascular measurements were conducted in 1998–1999.
Supplemental Figure S2. Six-cluster grouping of CHS participants according to levels of 11 metabolic parameters.
The mean standardized value of each parameter within-cluster is shown on the ordinate. Numbers in parentheses indicate cluster size.
Supplemental Table S1. Measures of carotid and peripheral atherosclerosis according to metabolic cluster.
Supplemental Table S2. Summary of relative associations of metabolic clusters with incident clinical events and subclinical atherosclerosis.