Abstract
We report unique bioactivity of a polycation-polyanion complex with potential utility for cancer therapy. A complex of disulfide-crosslinked polyethyleneimine (CLPEI), a polycation used for gene complexation, and dermatan sulfate (DS), an anionic polysaccharide to shield excessive cationic charge of the former, has toxicity to a specific group of cancer cell lines, including B16-F10 murine melanoma, A375SM human melanoma, and PC-3 human prostate cancer cells. These CLPEI-DS-sensitive cells express CD146, which binds to the complex via interaction with DS. There is a positive correlation between toxicity and intracellular level of CLPEI, indicating that the CLPEI-DS-sensitivity is attributable to the increased cellular uptake of CLPEI mediated by the DS-CD146 interactions. In vitro studies show that CLPEI-DS complex causes G0/G1 phase arrest and apoptotic cell death. In syngeneic and allograft models of B16-F10 melanoma, CLPEI-DS complex administered with a sub-toxic level of doxorubicin potentiates the chemotherapeutic effect of the drug by loosening tumor tissues. Given the unique toxicity, CLPEI-DS complex may be a useful carrier of gene or chemotherapeutics for the therapy of CD146-positive cancers.
Keywords: Bioactive biomaterials, polyethyleneimine, dermatan sulfate, CD146, melanoma
Table of Contents graphic
1. Introduction
Biomaterials are widely used as carriers of therapeutic agents that have difficulty in reaching target tissues. For example, nucleic acids are hard to deliver into cells due to the large size and negative charges; therefore, carriers like polyethyleneimine (PEI) and cationic liposomes are used to facilitate their cellular uptake. These carriers are used with an expectation that they have no other roles than carrier functions, but several studies reveal that the carriers possess unintended biological functions.1 For example, chitosan, an aminopolysaccharide widely used for drug delivery, is known for the wound healing2, 3 and antimicrobial activities.4 PEI used for siRNA delivery activates tumor-associated dendritic cells via Toll-like receptor (TLR)-5 and elicits antitumor immunity.5 Depending on the architecture and size, PEI can induce cytotoxicity via various modes of cellular damages, including lysosomal impairment and mitochondrial dysfunction.6 Cationic lipids are also reported to have immunostimulatory properties with either pro-7 or anti-inflammatory effects.8, 9 These studies indicate that biomaterials used for the delivery of bioactive compounds may have additional functions with therapeutic consequences.
In this study, we report new bioactivity of an electrostatic complex of a PEI derivative10 and dermatan sulfate (Figure 1a), which may be useful for cancer therapy. The PEI derivative is a disulfide-crosslinked linear PEI (CLPEI), which behaves like a high molecular weight PEI in the extracellular environment but degrades into a low molecular weight PEI in the reductive intracellular environment.11 CLPEI thus has the benefits of both high and low molecular weight PEIs in efficient gene complexation and relatively low toxicity, respectively.10, 11 Dermatan sulfate (DS, also known as chondroitin sulfate-B) is a sulfated glycosaminoglycan (GAG) consisting of two alternating monosaccharides (N-acetylgalactosamine and glucuronic acid), present on the cell surface and in the extracellular matrix in the form of proteoglycans.12 Anionic polysaccharides like chondroitin sulfate are used to shield the cationic charge of gene-polycationic complexes to avoid non-specific interactions with serum proteins.13, 14
Figure 1.
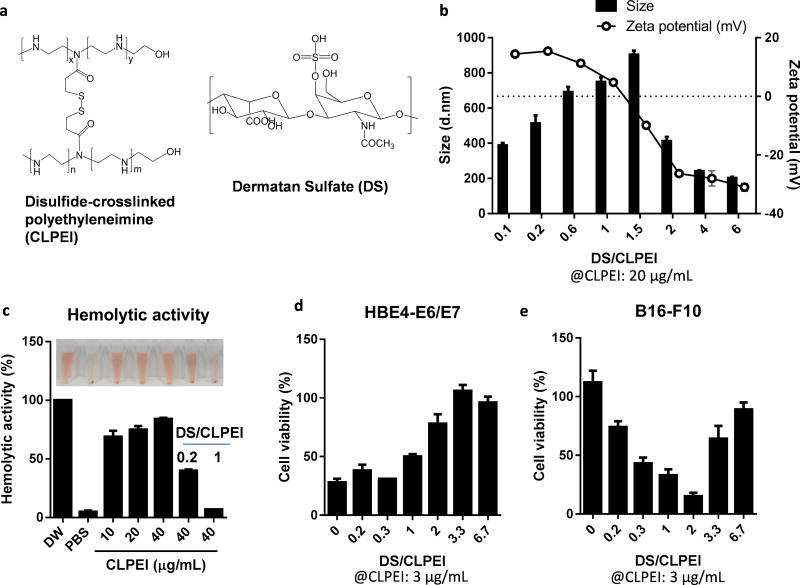
(a) Structures of CLPEI and DS. (b) Size and zeta potential of CLPEI-DS (PD) complexes. (c) Hemolytic activity of CLPEI and PD complexes. Sensitivity of (d) HBE4-E6/E7 lung epithelial cells and (e) B16-F10 melanoma cells to PD complexes prepared with 3 µg/mL of CLPEI and 0–20 µg/mL of DS (DS/CLPEI ratio: 0–6.7). Cells were treated for 6 h with PD and then incubated for 42 h prior to the cytotoxicity tests. Data are expressed as averages and standard deviations of 3 independently and identically performed tests.
Here, we produced a CLPEI-dermatan sulfate (“PD”) complex with an intention to develop a hemocompatible gene carrier. During the evaluation of the PD complex, we unexpectedly observed that the complex had a unique cytotoxic effect at a specific ratio of CLPEI and DS on a group of cancer cell lines. Each component alone had no or minor effect on cell viability, but the complex caused substantial damages to the cancer cells. We investigated the potential mechanism by which it kills specific cancer cell lines and evaluated in vivo effects of the PD complex in syngeneic and allograft models of B16-F10 subcutaneous tumor.
2. Materials and Methods
2.1. Materials
A HCl salt form of linear polyethylenimine (LPEI, MW: 2.5 kDa) was purchased from Polysciences (Warrington, PA, USA). Chondroitin sulfate A sodium salt (from bovine trachea), chondroitin sulfate B sodium salt (dermatan sulfate sodium salt from porcine intestinal mucosa), and 3,3'-dithiodipropionic acid di(N-hydroxysuccinimide ester) (DSP) were purchased from Sigma-Aldrich (St. Louis, MO, USA). Dulbecco’s Modified Eagle’s Medium (DMEM), RPMI 1640, fetal bovine serum (FBS) were purchased from Invitrogen (Carlsbad, CA, USA). Sodium hyaluronate (HA, 20kDa) was obtained from Lifecore Biomedical (Chaska, MN, USA). Fluorescence dyes Flamma FPR-553 (λabs/λem = 553/587 nm) and FPR-648 (λabs/λem = 648/672 nm) were purchased from BioActs (DKC Corp., Incheon, Korea). Anti-human CD146 antibody (αCD146) was purchased from Santa Cruz Biotechnology (Dallas, TX, USA), and anti-mouse CD146 and anti-mouse CD16/32 antibody were from BioLegend (San Diego, CA, USA). All other chemicals were purchased from Sigma-Aldrich and used as received.
2.2. Formation and Characterization of CLPEI-GAG Binary Complexes
CLPEI, disulfide-crosslinked low molecular weight linear polyethylenimine, was synthesized by reacting LPEI and DSP as previously reported.10, 11 For fluorescence or confocal microscopy of the cellular uptake of binary complexes, CLPEI was labeled with FPR-553 or FPR-648, and GAGs were labeled with fluoresceinamine (FA) using N-(3-dimethylaminopropyl)-N′-ethylcarbodiimide hydrochloride (EDC) chemistry.15 The labeled components were indicated as *, such as CLPEI*, DS*, or HA*. CLPEI-GAG binary complexes were formed by incubating CLPEI and DS, CS-A, or HA in varying ratios in phosphate buffered saline (PBS, pH 7.4) for 20 min at room temperature. CLPEI-DS binary complex was called PD complex. The size and zeta potential of the binary complexes were measured with the Nano-ZS90 Zetasizer (Malvern Instruments Ltd., Worcestershire, UK) after dilution in PBS to 50 µg/mL.
2.3. Hemolysis Assay
Blood was obtained from male Sprague Dawley (6–12 months) rats according to the protocol approved by the Purdue Animal Care and Usage Committee. Hemolysis assay was performed as previously reported.16, 17 Red blood cells (RBC) were isolated by centrifugation at 931 ×g and washed with a 210 mM NaCl solution until the supernatant was no longer red. The washed RBC were incubated with PD binary complex at different DS/CLPEI ratios in PBS at 37 °C for 1 hour. PBS and deionized water were used as a negative- and positive control, respectively. After the incubation, RBC suspension was centrifuged at 931 ×g for 5 min to separate a supernatant. The absorbance of the supernatant was measured at 541 nm with a SpectraMax M3 microplate reader (Molecular Devices, Sunnyvale, CA, USA).
2.4. Cell Culture
B16-F10 mouse melanoma cells, A375SM human melanoma cells, PC-3 human prostate adenocarcinoma cells, M109 mouse lung cancer cells, DU145 human prostate cancer cells, MCF7 human breast cancer cells, and HBE4-E6/E7 human bronchial epithelial cells were obtained from ATCC (Manassas, VA, USA). Cells were cultured in T-75 flasks (Corning Costar, Cambridge, MA, USA) in 15 mL of DMEM (B16-F10, A375SM, and M109), LHC-8 (HBE4-E6/E7), or RPMI 1640 (PC-3, DU145, and MCF7), supplemented with 100 IU/mL penicillin, 100 µg/mL streptomycin, and 5% (HBE4-E6/E7) or 10% FBS (for all other cell lines). Cells were maintained in a 5% CO2 humidified atmosphere at 37 °C.
2.5. Cytotoxicity Assay
The effect of CLPEI-GAG binary complexes on various cells was evaluated by measuring their metabolic activity with the (3-(4,5-dimethylthiazol-2-yl)-2,5-diphenyl-tetrazolium bromide) (MTT) assay after the treatment. Cells were seeded in 24-well plates and incubated overnight. Cells were treated wih CLPEI or PD complex in varying concentrations or CLPEI-GAG complexes at different DS/CLPEI ratios for 6 h. After the incubation, the medium was replaced with fresh complete medium and incubated for additional 18 h or 42 h. The MTT reagent and stop/solubilization solution were sequentially added with a 3 h interval. The formazan concentration was measured at 570 nm with a reference wavelength of 630 nm with a SpectraMax M3 microplate reader. The cell viability was normalized to the absorbance of PBS-treated control cells. In case of B16-F10 cells, the metabolic activity was evaluated with the CellTiter-Glo luminescent cell viability assay (Promega, WI, USA) measuring cellular ATP to avoid the interference of melanin with the colorimetric assay. The cell viability was calculated after correcting for the base level of luminescence due to melanin.
2.6. Melanin Content in B16-F10 Cells
B16-F10 cells were incubated in medium containing CLPEI (3 µg/mL), DS (6 µg/mL), or PD (3 µg/mL CLPEI + 6 µg/mL DS) for 6 h. Subsequently, the medium was replaced with fresh complete medium and incubated for additional 24 h. Cells were trypsinized, collected as a pellet, and lysed in 1N NaOH solution containing 10% dimethyl sulfoxide with heating at 80 °C for 1 h. The melanin content was estimated from the absorbance at 405 nm and corrected for the number of live cells determined by propidium iodide (PI) staining and flow cytometry.
2.7. Confocal and Fluorescence Microscopy
B16-F10, PC-3 and M109 cells were seeded in a 24 well plate at a density of 30,000 cells per well (fluorescence microscopy) or a 35 mm glass-bottom cell culture dishes (MatTek) at a density of 100,000 cells per dish (confocal microscopy). After overnight incubation, the cells were treated with fluorescently labeled complexes for 6 h or 24 h and observed with a Cytation 3 imaging system (Biotek, USA) or a Nikon-A1R confocal microscope (Nikon America Inc., Melville, NY). For confocal microscopy, cells were fixed with 4% paraformaldehyde for 15 min at room temperature and stained with DAPI. DS* and CLPEI* were detected at λex/λem = 488 nm/525 nm and λex/λem = 561 nm /590 nm, respectively, and DAPI was detected at λex/λem = 407 nm/ 450 nm.
2.8. Flow Cytometry
PD uptake, immunophenotyping, apoptosis, and cell cycle analysis were performed with flow cytometry. In general, cells were cultured in a 12 well plate a density of 60,000 cells per well (B16-F10 cells) or 80,000 cells per well (M109 cells). After treatment specific to each test, cells were washed with PBS twice to remove unbound components, trypsinized, washed again with PBS, fixed with 1% paraformaldehyde, and stored at 4 °C until analysis. The fixed cells were analyzed with a Cytomics FC500 (Beckman Coulter, Indianapolis, IN) or Accuri C6 flow cytometer (BD Biosciences, San Jose, CA). A total of 10,000 gated cells were analyzed using the FlowJo V10 (Ashland, OR).
To quantify PD associated with cells, B16-F10 and M109 cells were incubated with fluorescently labeled PD complexes consisting of FPR-648-labeled CLPEI (3 µg/mL) and fluoresceinamine-labeled DS (0–20 µg/mL) for 6 h and analyzed with Accuri C6. For immunophenotyping, cells were harvested after overnight culture and incubated with PE-labeled anti-CD146 antibodies (αCD146) with a matching origin (mouse or human) for 0.5 h on ice in dark and analyzed with Cytomics FC500. For mouse cell lines, anti-CD16/32 antibody was used as a blocking antibody prior to labeling with αCD146. For competition assay, cells were incubated with PE-labeled αCD146 followed by fluoresceinamine-labeled PD complex or vice versa and analyzed with Accuri C6.
For apoptosis assay, B16-F10 cells were treated with PBS control, CLPEI (5 µg/mL), DS (10 µg/mL), or PD (5 µg/mL CLPEI + 10 µg/mL DS) for 6 h followed by additional 18 h incubation in fresh medium. The treated cells were stained with PI and Alexa Fluor 488-annexin V (Life Technologies, Grand Island, NY, USA) according to the manufacturer’s instruction and analyzed with Accuri C6. Cell cycle analysis was performed with B16-F10 cells after treatment with CLPEI (5 µg/mL), DS (10 µg/mL), or PD (5 µg/mL CLPEI + 10 µg/mL DS) for 6 h followed by additional 18 h incubation in fresh medium. The treated cells were harvested, washed with cold PBS, and fixed in cold 70% ethanol for 15 min on ice. The fixed cells were stained with the FxCycle™ PI/RNase Staining Solution (Life Technologies) according to the manufacturer’s instruction and analyzed with Accuri C6. DNA histograms were analyzed with a univariate model based on the Watson Pragmatic algorithm (Ashland, OR) built in FlowJo V10 to calculate % cells in G0/G1, S, and G2/M phases.
2.9. In Vivo Application of PD Complex
All experiments with live animals were performed according to the procedures approved by the Institutional Animal Care and Use Committee, in conformity with relevant laws and institutional guidelines of Korea Institute of Science and Technology (KIST) and Purdue University.
First, systemic toxicity of PD complex was evaluated by blood chemistry analysis. PD complex was prepared by incubating 60 µg of CLPEI and 120 µg DS in 180 µL PBS for 20 min at room temperature. Samples were freshly prepared and immediately used. Healthy male Balb/c nude mice (5 week old) were administered with PD complexes or PBS by tail vein injection every other day (n=3 per group). In less than 30 min after the third administration, blood was terminally sampled by cardiac puncture. The sampled blood was collected in a heparin-coated tube and centrifuged at 1,500 ×g to separate serum, which was stored at −20 °C until analysis. The sampled serum was analyzed with biochemical analyzer (FUJI Dri-Chem, Japan) with respect to the levels of glucose, creatinine, alkaline phosphatase (ALP), gamma-glutamyl transferase (GGT), alanine aminotransferase (ALT), and total protein.
Next, the anti-tumor effect of PD complex was evaluated in syngeneic and allograft models of B16-F10 melanoma. A million B16-F10 cells were suspended in 100 µL RPMI 1640 medium and subcutaneously injected to the left flank of male CL57BL/6 or male Balb/c nude mice (6 week old). Tumor size was measured every other day with a digital caliper. The volume was calculated as L×W2/2, where L was the length (the longest tumor diameter) and W the width (the shortest tumor diameter) measured in millimeters. Mice were randomly assigned to 5 or 4 groups (n=4 or 5 per group). When the tumor volume reached approximately 50 mm3, mice were administered with PBS (180 µL) or treatments - PD (60 µg CLPEI + 120 µg DS), doxorubicin (40 µg: i.e., 2 mg/kg), CLPEI + doxorubicin, or PD + doxorubicin, suspended in 180 µL PBS, via tail vein injection three times. PBS, CLPEI, or PD were administered three times every other day, and doxorubicin was administered three times every other day with two-day interval from each PBS, CLPEI, or PD injection. Tumor growth was monitored for 12 days after the first treatment.
Additional groups of tumor-bearing nude mice, treated with PBS or PD (60 µg CLPEI + 20 µg DS) in the same way as above, were sacrificed 7 days after the third injection for histological evaluation. Tumors were excised and fixed in 4% paraformaldehyde solution. The fixed tissues were dehydrated via sequential immersion in ethanol and xylene, embedded in paraffin, sliced into 5 µm thick sections using microtome (Leica Microsystems, Germany). The sliced tissues were mounted on glass slides and stained with hematoxylin and eosin (H&E) or Masson’s trichrome and examined by light microscopy (Olympus BX51, Japan).
2.10. Statistical Analysis
All in vitro data were analyzed using GraphPad Prism 6 (La Jolla, CA) with ANOVA to determine difference among the groups and the Dunnett test for multiple comparisons. Data from the tumor growth study were analyzed after log transformation. Specific tumor growth rate was calculated for each animal, and the groups were compared with ANOVA, followed by the uncorrected Fisher's LSD test for multiple comparisons. A value of p < 0.05 was considered statistically significant.
3. Results and Discussion
3.1. Properties of PD Binary Complex
CLPEI formed an electrostatic complex with DS. The zeta potential of CLPEI-DS (PD) complex containing 20 µg CLPEI changed from +14.4 ± 0.34 mV to −31.0 ± 1.4 mV with the increase of DS content from 2 µg to 120 µg (Figure 1b). The particle size increased as the zeta potential approached zero: i.e., the complexes aggregated in the absence of electrostatic repulsion. As the complex gained negative charges with further addition of DS, the size was reduced to 400 nm or lower. This is relatively large compared to typical nanoparticles used in systemic applications. However, according to the early study by Jain et al,18 which finds the cutoff size of hyperpermeable tumor microvessels to be as large as 1.2 µm, we expect that it is possible for the 400 nm PD complex to circulate and reach tumors.
3.2. PD complex showed greater hemocompatibility than CLPEI alone
Cationic polymers tend to interact with RBC and destabilize the membrane integrity, thereby inducing hemoglobin release. As expected, CLPEI induced significant hemolysis, corresponding to 70–85% relative to deionized water (DW, an established positive control causing osmotic hemolysis19, 20), at a concentration of 10–40 µg/mL. The addition of DS reduced the hemolytic activity of CLPEI to a level comparable to the negative control (PBS) (Figure 1c). This result indicates that DS masked the cationic charge of CLPEI and protected RBC from the direct contact with CLPEI.
3.3. PD complex showed unique toxicity against B16-F10 melanoma cells
Based on the protective effect of DS, we expected that PD complex would show less cytotoxicity than CLPEI alone. As expected, HBE4-E6/E7 bronchial epithelial cells treated with PD complex indeed showed greater metabolic activity than CLPEI-treated cells with the addition of DS, especially at the DS/CLPEI weight ratio of 2 or higher (Figure 1d). Interestingly, B16-F10 melanoma cells showed a distinct trend: CLPEI alone was not toxic at 3 µg/mL, but the toxicity increased with the addition of DS, showing the maximum toxicity at the DS/CLPEI ratio of 2 (Figure 1e, Supporting Figure 1). The toxicity decreased with further increase of the DS content. The toxicity was not seen when DS and CLPEI were separately added without a PD complexation step (Supporting Figure 2), which indicates that it was the function of PD complex rather than a simple mixture of two components.
3.4. PD complex showed cytotoxicity against a specific group of cancer cell lines
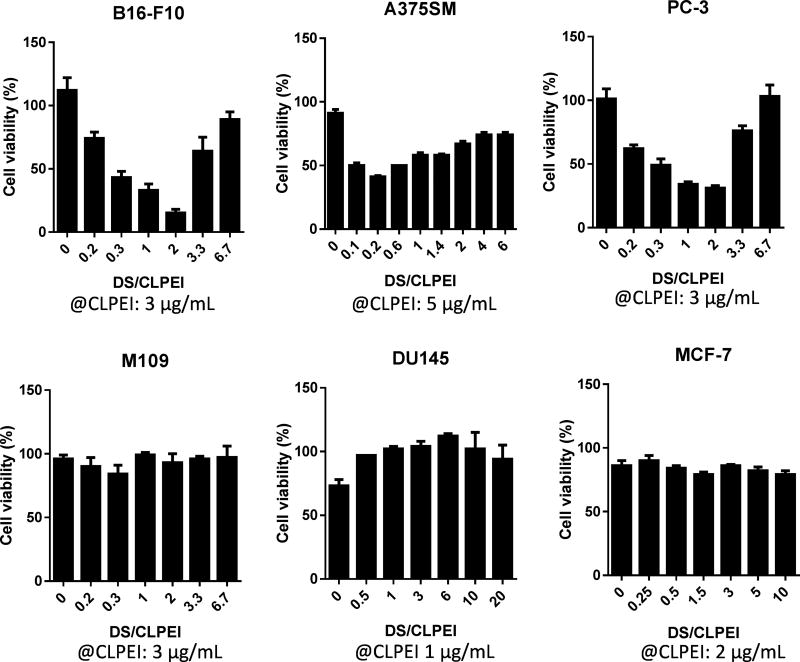
Given the cell type dependence of the toxicity profile, we tested the cytotoxicity of PD complexes with an extended collection of cell lines (Figure 2), fixing the CLPEI concentration at a level that did not cause apparent toxicity (1–5 µg/mL) and varying the DS/CLPEI weight ratio. The cell lines could be broadly categorized into two groups according to their responses to the PD complex: (i) cell lines highly sensitive to the PD complex at a specific DS/CLPEI ratio (i.e., PD-sensitive cells), similar to B16-F10 cells, such as A375SM human melanoma and PC-3 human prostate adenocarcinoma cell lines, and (ii) those either insensitive to PD complex (PD-insensitive cells), such as M109 mouse lung carcinoma, DU145 human prostate carcinoma, and MCF-7 human breast adenocarcinoma cell lines. In both cases, DS alone at comparable concentrations was not toxic at all (Supporting Figure 1). In the PD-sensitive cell lines, the DS/CLPEI ratio at which PD complex showed maximum toxicity ranged from 0.2 to 2 depending on cell lines, showing no apparent relationship with the size or net charge of the complex.
Figure 2.
PD sensitivity of different cell lines. Cells were treated with PD complexes, prepared with CLPEI and DS at the DS/CLPEI ratios and CLPEI concentrations indicated in the x-axis, for 6 h, followed by additional incubation for 18 or 42 h in fresh medium. The cell viability was tested with the MTT assay or CellTiter-Glo luminescent cell viability assay (B16-F10 cells). Top: Cells sensitive to PD complex at a specific DS/CLPEI ratio (PD-sensitive cells). Bottom: Cells insensitive to PD complexes at any ratio of DS/CLPEI (PD-insensitive cells).
3.5. DS increased cellular uptake of CLPEI in PD-sensitive cells but not in PD-insensitive cells
In an attempt to investigate the mechanism by which PD complex showed cytotoxicity, PD binding and/or uptake by selected cells were observed with fluorescence/confocal microscopy and flow cytometry. PD complexes were prepared varying the DS/CLPEI ratio at a fixed, non-toxic level of CLPEI (e.g., B16-F10 cells at ≤5 ug/mL of CLPEI, Supporting Figure 3). CLPEI and DS were labeled with distinct fluorescent dyes for individual tracking and indicated as CLPEI* (labeled CLPEI) and DS* (labeled DS), respectively. To exclude the possibility of PD permeation into dead cells, incubation with PD complex was limited to 6 h, prior to the onset of apparent toxicity (Supporting Figure 4).
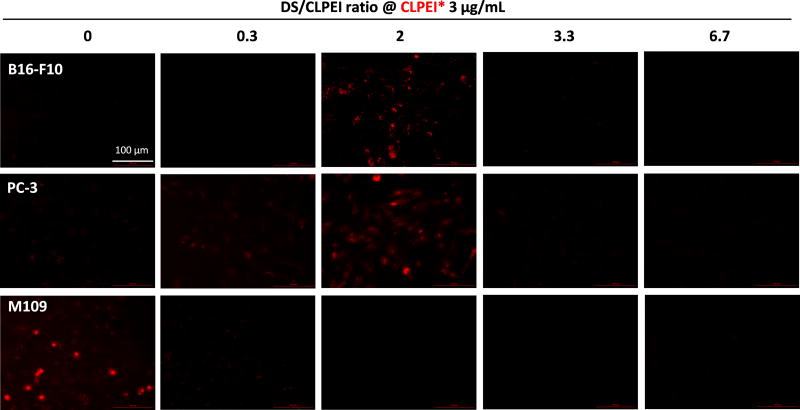
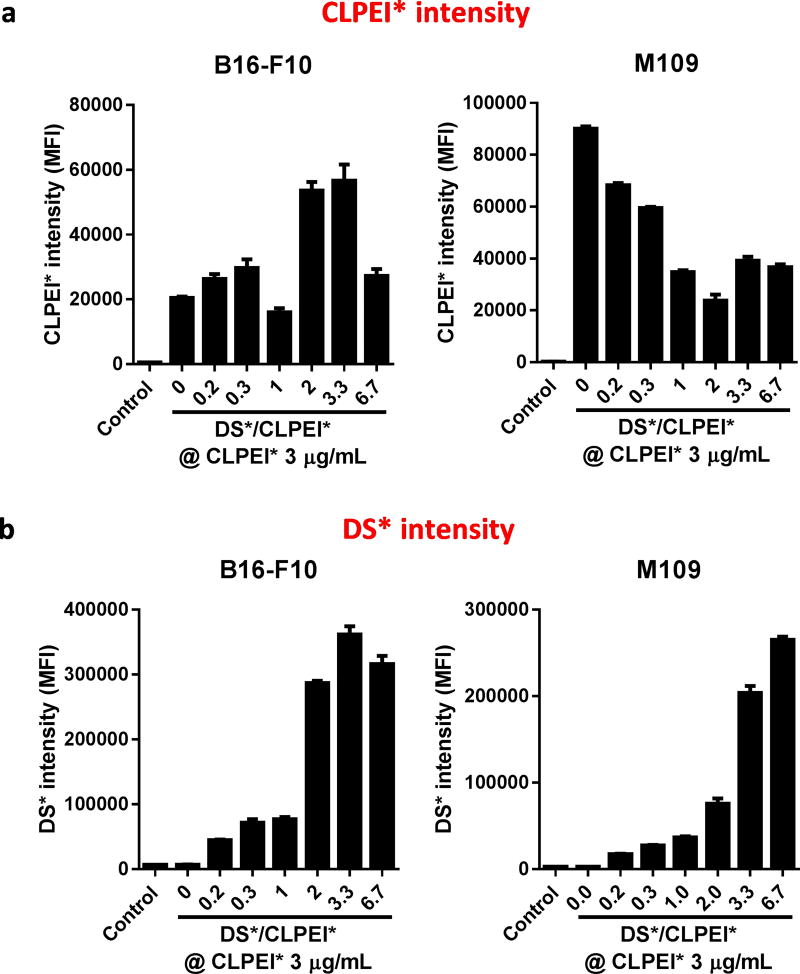
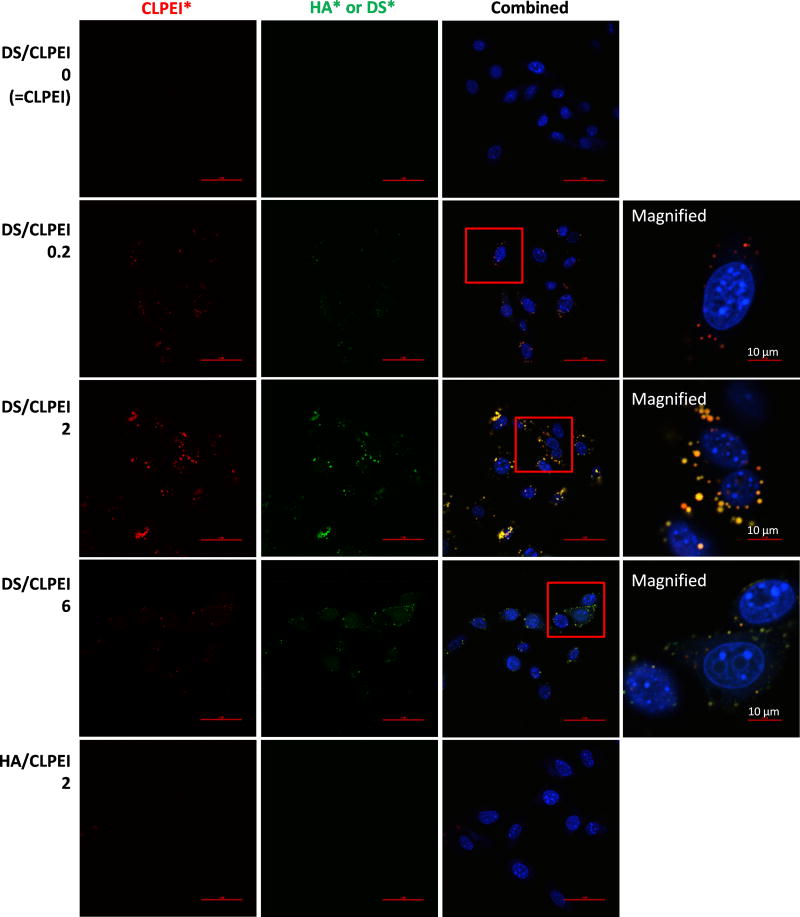
Fluorescence microscopy revealed a positive correlation between PD sensitivity and cellular fluorescence due to CLPEI* (Figure 3). PD-sensitive cells (B16-F10 and PC-3) showed the most CLPEI* signals at the DS/CLPEI ratio of 2, where the PD complex showed the maximum toxicity after additional 18–42 h incubation. In PD-insensitive cells (M109), the CLPEI* signal was most prominent in the absence of DS. This trend was quantitatively confirmed by flow cytometry (Figure 4a). CLPEI* signal in the PD-sensitive B16-F10 cells reached the maximum at an intermediate DS/CLPEI ratio (2 and 3.3), whereas the CLPEI* signal in the PD-insensitive M109 cells decreased with the increase of DS. We note that the strong CLPEI* flow cytometry signal at DS/CLPEI ratio of 3.3 (Figure 4a) is different from the microscope image (Figure 3). This may be due to the difference between two methods in detecting fluorescence signal: microscopy picking up concentrated signals above the threshold level, whereas flow cytometry detecting collective fluorescence intensity including those spreading over the cell surface. We suspect that the high flow cytometry signal at the DS/CLPEI ratio of 3.3 in B16-F10 cells reflects those diffusely associated with cell surface. DS* intensity increased with the DS content irrespective of the cell type, indicating non-specific affinity of DS for the cell surfaces (Figure 4b). Confocal microscopy showed that PD-sensitive B16-F10 cells internalized the PD complex (Figure 5). The cells treated with the PD complex at the DS/CLPEI ratio of 2 showed punctate yellow signals in the merged image of the cells, indicating the colocalization of CLPEI* and DS*. The cells treated with the PD complex at the DS/CLPEI ratio of 6 showed predominantly green signals of DS*.
Figure 3.
PD-interaction with B16-F10, PC-3, and M109 cells. Cells were incubated with PD complexes made of fluorescently labeled CLPEI* (red) and DS in the DS/CLPEI ratio of 0.3–6.7 at a concentration equivalent to CLPEI 3 µg/mL, for 6 h. Cells were imaged without fixation using a Biotek Cytation 3 cell imaging multi-mode reader.
Figure 4.
Fluorescence intensity of B16-F10 and M109 cells incubated with fluorescently-labeled PD complexes, prepared with CLPEI* and DS* in the DS/CLPEI ratios indicated in the x-axis at a concentration equivalent to CLPEI 3 µg/mL, for 6 h. Fluorescence intensity of (a) CLPEI* and (b) DS* in the cells was measured with flow cytometry and expressed as the geometric mean. MFI: Mean fluorescence intensity. Data are expressed as averages and standard deviations of 3 independently and identically performed tests.
Figure 5.
Confocal microscope images of B16-F10 cells incubated for 6 h with fluorescently labeled PD complexes, prepared with CLPEI* (red) and DS* (green) in the DS/CLPEI ratios of 0.2–6, or CLPEI*-HA* complex prepared with CLPEI* (red) and HA* (green) in the HA/CLPEI ratios of 2. The complexes were formed at a concentration equivalent to CLPEI 5 µg/mL (higher than usual 3 µg/mL to facilitate the signal detection). Both 3 and 5 ug/mL CLPEI were well tolerated by B16-F10 cells (Supporting Fig. 3). Scale bars: 50 µm unless specified otherwise.
These results provide a couple of insights into the cell-PD interactions: (i) The positive correlation between the extent of CLPEI uptake and the toxicity of PD complex indicates that CLPEI is likely the component that caused a toxic effect to the PD-sensitive cells. Indeed, its dose-dependent toxicity (Supporting Fig. 3) validates the role of CLPEI as the toxic component in the PD complex. (ii) The DS part of the complex bound to the cell surface plays differential roles according to the cell type: With the PD-sensitive B16-F10 cells, DS facilitates the uptake of the complex to a certain extent. In PD-insensitive M109 cells, DS may bind to the cell surface but does not help the complex to enter the cells and rather interferes with the adsorptive endocytosis of the cationic CLPEI. This suggests that DS is responsible for the cell specificity of the PD complex-mediated toxicity. Of note, other GAGs such as chondroitin sulfate-A (CS-A) or hyaluronic acid (HA), which are structurally similar to DS (Supporting Figures 1 and 5), did not show a similar function as DS. Confocal microscopy showed that HA did not increase the uptake of CLPEI by B16-F10 cells at the HA/CLPEI ratio of 2 (Figure 5). CLPEI-CS-A complexes did not show cytotoxicity in B16-F10 cells as PD complexes did (Supporting Figure 5). The difference between PD (CLPEI-DS) and CLPEI-CS-A complexes is intriguing, given that the only difference between DS and CS-A is the orientation of C5-carboxylate in the uronic acid unit and the two complexes showed similar charge and size profiles (Supporting Figure 5).
3.6. PD complex interacted with B16-F10 cells in a dose-dependent manner, and excess DS decreased CLPEI uptake by B16-F10 cells
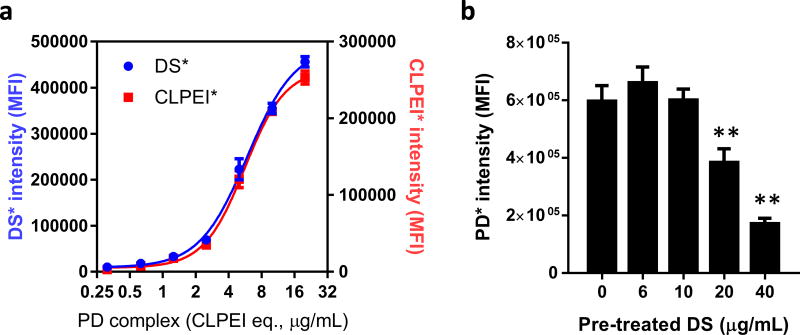
To confirm that PD complex positively interacts with PD-sensitive cells, we incubated B16-F10 cells with dual-labeled PD complex at a DS/CLPEI ratio of 2 in varying concentrations. The fluorescence signals of both DS* and CLPEI* associated with the cells increased in a dose-dependent manner (Figure 6a), indicating that the two components entered the cells as a complex. To confirm that DS mediates PD complex interaction with PD-sensitive cells, B16-F10 cells were pre-incubated with excess DS prior to the addition of PD complexes (labeled with DS*). The PD signal decreased with the increase of pre-treated DS (Figure 6b, Supporting Figure 6), indicating that the excess DS competitively inhibited the uptake of PD complex. This result verifies that DS was responsible for enhanced interaction of PD complex with B16-F10 cells. It also explains why the toxicity (Figure 2) and cellular uptake of PD complexes in B16-F10 cells (Figures 3, 4, and 5) decreased when the DS/CLPEI ratio increased beyond 2. Additional DS may not have been incorporated into PD due to its increasing negative charges and rather served as extra DS to compete with the PD complex.
Figure 6.
(a) Flow cytometry of B16-F10 cells incubated with PD complex in varying concentrations for 6 h. PD was dual-labeled with CLPEI* and DS* and prepared in the DS/CLPEI ratio of 2. (b) B16-F10 cells preincubated with DS at varying concentrations for 30 min and then treated with PD* complex for 6 h. Cells were washed twice, fixed with 1% paraformaldehyde and analyzed with Accuri C6 flow cytometer.
3.7. PD complexes were taken up by PD-sensitive cells via CD146
As the evidence indicated that DS mediated cellular uptake of PD complex, we speculated that PD-sensitive cells might express receptors for DS that favored the uptake of the complex. CD44 is a known receptor of DS21 but was not further considered, because CLPEI-HA did not show similar uptake and toxicity patterns as PD complex (Figure 5, Supporting Figure 5). Instead, we focused on CD146 because two melanoma cell lines (B16-F10 and A375SM) were sensitive to PD and CD146 is known to be highly expressed on melanoma cells.22, 23 CD146 is a transmembrane glycoprotein involved in tumor growth, angiogenesis, and metastasis.22, 24 It was first identified as a melanoma-specific cell-adhesion molecule due to the abundance in malignant melanoma but also implicated in the progression of breast, prostate, and epithelial ovarian cancers.24 For this reason, CD146 has been pursued as a molecular target for the therapy25 and imaging26, 27 of solid tumors.
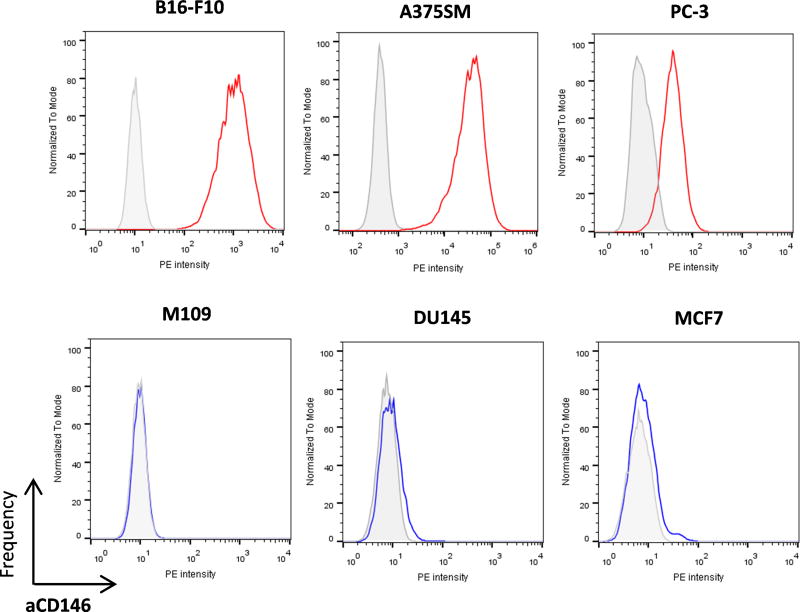
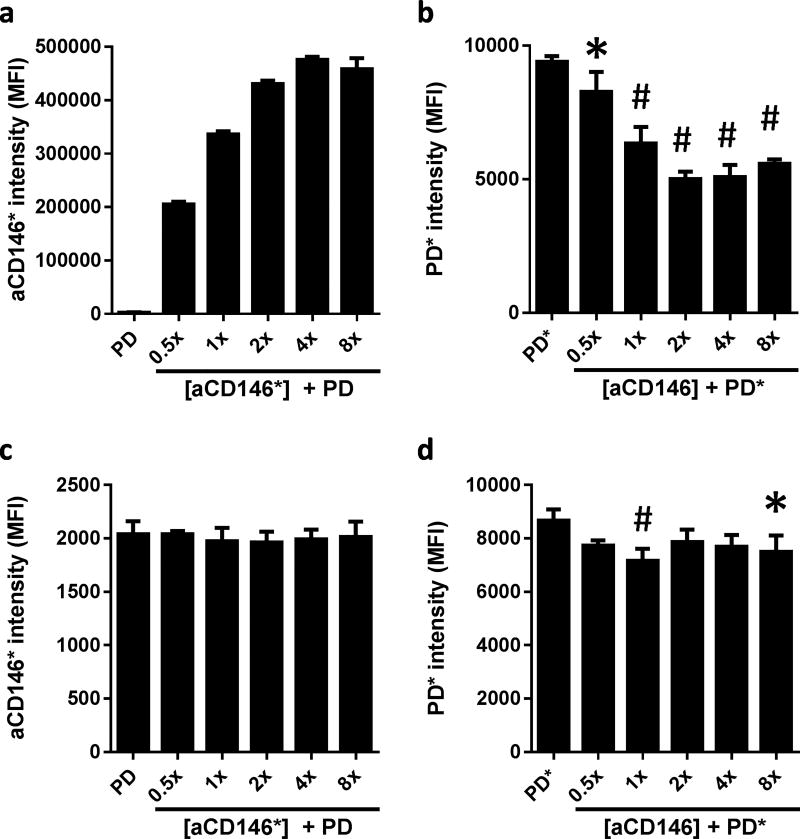
Immunophenotyping based on flow cytometry revealed a positive correlation between the PD sensitivity and the level of CD146 expression (Figure 7). PD-sensitive B16-F10, A375SM, and PC-3 cells expressed CD146, but PD-insensitive cells (M109, DU145, and MCF7 cells) did not. To confirm if CD146 served as a receptor for PD complex in PD-sensitive cells, PD uptake was evaluated after pre-treatment with anti-CD146 antibody (αCD146) (Figure 8a, 8b). In PD-sensitive B16-F10 cells, pre-incubation with phycoerythrin (PE)-labeled αCD146 increased the fluorescence signal, confirming the CD146+ phenotype of B16-F10 cells (Figure 8a). PD intensity (indicated by the DS* fluorescence) decreased with the increase of αCD146 (Figure 8b), showing that αCD146 and PD competed for CD146. In contrast, PD-insensitive M109 cells (CD146−) were not affected by the addition of αCD146 (Figure 8c, 8d). αCD146 barely bound to M109 cells (note the low fluorescence intensity) and did not influence the PD fluorescence of the cells. We note that both cell lines show a basal level of PD fluorescence that indicates a significant level of non-specific binding of DS to the cell surface, also shown in Figure 4b. Nevertheless, the decrease of PD uptake by B16-F10 cells due to αCD146 indicates that CD146-DS interaction provides an additional (and specific) mechanism of PD binding and facilitates their cellular uptake.
Figure 7.
Expression of CD146 on B16-F10, A375SM, PC-3, M109, DU145, and MCF7 cells.
Figure 8.
Fluorescence intensity of cells measured by flow cytometry showing (a) the binding of PE-labeled αCD146 to B16-F10 cells in a dose-dependent manner; (b) the inhibition of PD* binding to B16-F10 cells due to the competition with αCD146; (c) the lack of binding of PE-labeled αCD146 to M109 cells; and (d) the constant PD* binding irrespective of the increasing αCD146. The concentration of αCD146 is indicated as a multiple of the recommended dose. MFI: Mean fluorescence intensity. *: p<0.05, #: p<0.01 vs. PD* by the Dunnett’s multiple comparisons test following one-way ANOVA. Data are expressed as averages and standard deviations of 3 independently and identically performed tests.
3.8. Mechanisms of PD cytotoxicity
To investigate the mechanism by which intracellular PD kills the sensitive cells, we performed a series of in vitro experiments with B16-F10 cells. First of all, apoptosis assay was performed with annexin V-PI staining and flow cytometry after 6 h treatment followed by additional 18 h incubation in fresh medium. Cells treated with DS or CLPEI alone showed no significant difference from the PBS-treated control group in the cell populations undergoing early apoptosis and late apoptosis/death (Supporting Figure 7). PD-treated cells showed significantly increased cell populations in both early apoptosis (6.9 ± 0.8% vs. 1.6 ± 0.5% of PBS-treated cells) and late apoptosis/death (11.1±1.3% vs. 4.6 ± 0.6% of PBS-treated cells). This result is consistent with a previous study with PEI, which described its proapoptotic activity due to the damage to the mitochondrial membrane.28 Secondly, we examined the effect of PD on melanogenesis of B16-F10 cells, a unique response of melanoma cells to proapoptotic stress.29 B16-F10 cells incubated with PD for 24 h produced a greater amount of melanin than those treated with PBS, CLPEI, or DS (Supporting Figure 8), indicating cellular injury associated with PD. The increased melanin production was accompanied by the increased cell population in the G0/G1 phase (Supporting Figure 9), consistent with the literature reporting a positive correlation between melanogenesis and the G0/G1 phase arrest.30 Taken together, these results indicate that PD suppresses the B16-F10 cell proliferation by inducing G0/G1 phase arrest and promoting apoptotic cell death.
3.9. In vivo effects of PD complex
With the intriguing PD toxicity to a selected group of cancer cells, we asked if PD would serve as standalone chemotherapy and/or an assisting agent to potentiate chemotherapy. First, healthy male Balb/c nude mice were administered with PD at the DS/CLPEI ratio of 2 (60 µg CLPEI + 120 µg DS per mouse) intravenously on the q2d × 3 schedule and sacrificed after the final administration for analysis of blood chemistry. We found no significant difference in blood chemistry between PBS- and PD-treated groups (Supporting Figure 10), which indicates that PD was well tolerated by the animals without apparent systemic toxicity. The intravenously injected PD reached tumors as expected. In the Masson’s trichrome stained slides, purple specks were evident in the tumors from the PD-treated animals. The purple specks indicate DS, which is negatively charged, thus destained by phospho acids, and counter-stained with aniline blue. It is worth noting that this specimen was obtained from animals treated with PD complex containing as little as the 1/6th of the typical DS dose (20 µg as compared to typical 120 µg) (Supporting Figure 11).
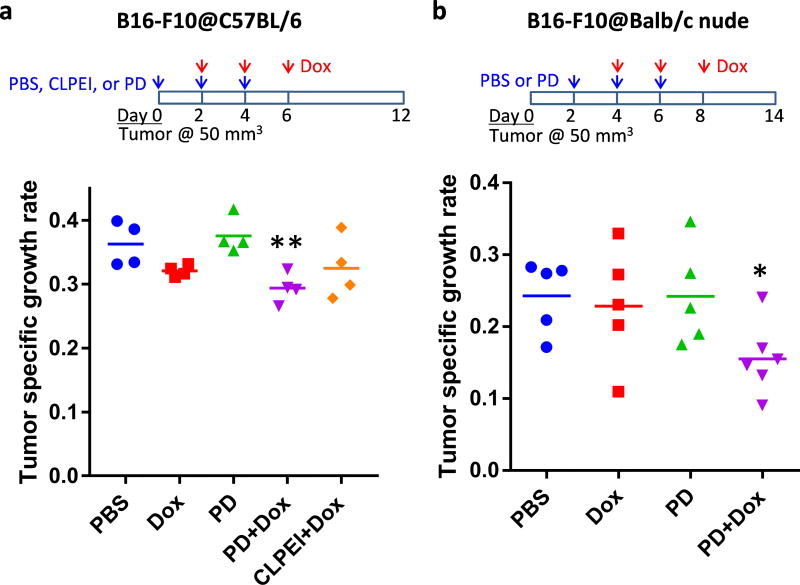
We performed in vivo tests to evaluate tumor-specific toxicity of the PD complex. At first, PD complex was directly injected into tumors by intratumoral injection to localize the effect. Upon gross examination, B16-F10 tumors treated with PD were found softer than those with PBS or CLPEI. In histological examination, the PD-treated tumors showed a wide range of cell death and a lower cell density than the PBS or CLPEI-treated ones (Supporting Figure 12). We then examined the effect of PD on the delivery of a chemotherapeutic drug that may benefit from the decreased tumor density due to PD. We administered tumor-bearing animals with PD followed by doxorubicin by tail vein injection and monitored the tumor growth to evaluate their effects (Figure 9, Supporting Figure 13). Although the size of tumors in the PD-receiving group was not significantly different than those in the PBS-receiving group, the PD-treated tumors were felt softer than those in other groups, consistent with those treated with PD via intratumoral injection. In both syngeneic and allograft models of B16-F10 tumors, doxorubicin (2 mg/kg) alone showed no significant difference from PBS in tumor growth rate due to the low dose. On the other hand, the sub-toxic level of doxorubicin induced a significant delay in tumor growth when administered after PD in both animal models (Figure 9). Doxorubicin injected after CLPEI instead of PD was not significantly different from PBS, confirming the contribution of PD complex (Figure 9a). This result supports that the PD compromised the tumor matrix and enhanced the penetration of subsequently administered doxorubicin, which would otherwise have had little access to the interior of tumor.
Figure 9.
Treatment schedules and tumor specific growth rates in (a) C57BL/6 mice and (b) Balb/c nude mice bearing B16-F10 tumors after treatment with PBS, doxorubicin (Dox), PD, PD+Dox, and CLPEI+Dox. Tumor specific growth rate31 was defined as (lnV2−lnV1)/(t2−t1), where V= tumor volume, t = time in days. *: p < 0.05 vs. PBS and PD, using ANOVA followed by the Fisher’s LSD test.
4. Conclusions
A CLPEI-DS complex, originally developed for gene delivery, was found to have unique toxicity toward a specific group of cancer cell lines. Positive correlations were observed between the toxicity and intracellular level of CLPEI and between the sensitivity to PD complex and the level of cellular expression of CD146. These correlations indicate that the observed PD sensitivity is attributable to the increased cellular uptake of cytotoxic CLPEI, mediated by DS-CD146 interactions. In vitro studies with PD-sensitive B16-F10 cells showed that PD suppressed the cell proliferation via G0/G1 phase arrest and apoptotic cell death. In mice with B16-F10 melanoma, PD complex potentiated chemotherapy by loosening tumor tissues with no apparent systemic side effects. This study illustrates how carrier materials may have biological activities with therapeutic consequences. The unique toxicity of PD complex may be exploited in gene- or chemotherapy of CD146-positive cancers in future studies.
Supplementary Material
Acknowledgments
The authors acknowledge the support of NSF DMR-1056997, NIH R01 CA199663 and Global Innovative Research Center program (2012K1A1A2A01055811) of the National Research Foundation of Korea and by the Intramural Research Program (Global RNAi Carrier Initiative) of KIST. Bieong-Kil Kim and Dongkyu Kim contributed equally to this work.
Footnotes
Supporting Information: Supporting Figures are available free of charge via the Internet at http://pubs.acs.org.
References
- 1.Yeo Y, Kim B-K. Drug carriers: Not an innocent delivery man. AAPS J. 2015;17:1096–1104. doi: 10.1208/s12248-015-9789-6. [DOI] [PMC free article] [PubMed] [Google Scholar]
- 2.Muzzarelli RAA, Mattioli-Belmonte M, Pugnaloni A, Biagini G. Biochemistry, histology and clinical uses of chitins and chitosans in wound healing. EXS. 1999;87:251–264. doi: 10.1007/978-3-0348-8757-1_18. [DOI] [PubMed] [Google Scholar]
- 3.Kojima K, Okamoto Y, Kojima K, Miyatake K, Fujise H, Shigemasa Y, Minami S. Effects of chitin and chitosan on collagen synthesis in wound healing. J. Vet. Med. Sci. 2004;66:1595–1598. doi: 10.1292/jvms.66.1595. [DOI] [PubMed] [Google Scholar]
- 4.Kong M, Chen XG, Xing K, Park HJ. Antimicrobial properties of chitosan and mode of action: a state of the art review. Int. J. Food. Microbiol. 2010;144:51–63. doi: 10.1016/j.ijfoodmicro.2010.09.012. [DOI] [PubMed] [Google Scholar]
- 5.Cubillos-Ruiz JR, Engle X, Scarlett UK, Martinez D, Barber A, Elgueta R, Wang L, Nesbeth Y, Durant Y, Gewirtz AT, et al. Polyethylenimine-based siRNA nanocomplexes reprogram tumor-associated dendritic cells via TLR5 to elicit therapeutic antitumor immunity. J. Clin. Invest. 2009;119:2231–2244. doi: 10.1172/JCI37716. [DOI] [PMC free article] [PubMed] [Google Scholar]
- 6.Parhamifar L, Andersen H, Wu L, Hall A, Hudzech D, Moghimi SM. Polycation-mediated integrated cell death processes. Adv. Genet. 2014;88:353–398. doi: 10.1016/B978-0-12-800148-6.00012-2. [DOI] [PubMed] [Google Scholar]
- 7.Lonez C, Vandenbranden M, Ruysschaert JM. Cationic liposomal lipids: from gene carriers to cell signaling. Prog. Lipid Res. 2008;47:340–347. doi: 10.1016/j.plipres.2008.03.002. [DOI] [PubMed] [Google Scholar]
- 8.David SA, Silverstein R, Amura CR, Kielian T, Morrison DC. Lipopolyamines: novel antiendotoxin compounds that reduce mortality in experimental sepsis caused by gram-negative bacteria. Antimicrob. Agents Chemother. 1999;43:912–919. doi: 10.1128/aac.43.4.912. [DOI] [PMC free article] [PubMed] [Google Scholar]
- 9.Leon-Ponte M, Kirchhof MG, Sun T, Stephens T, Singh B, Sandhu S, Madrenas J. Polycationic lipids inhibit the pro-inflammatory response to LPS. Immunol. Lett. 2005;96:73–83. doi: 10.1016/j.imlet.2004.07.019. [DOI] [PubMed] [Google Scholar]
- 10.Xu P, Quick G, Yeo Y. Gene delivery through the use of a hyaluronate-associated intracellularly degradable crosslinked polyethyleneimine. Biomaterials. 2009;30:5834–5843. doi: 10.1016/j.biomaterials.2009.07.012. [DOI] [PMC free article] [PubMed] [Google Scholar]
- 11.Breunig M, Lungwitz U, Liebl R, Goepferich A. Breaking up the correlation between efficacy and toxicity for nonviral gene delivery. Proc. Natl. Acad. Sci. U. S. A. 2007;104:14454–14459. doi: 10.1073/pnas.0703882104. [DOI] [PMC free article] [PubMed] [Google Scholar]
- 12.Wegrowski Y, Maquart FX. Chondroitin sulfate proteoglycans in tumor progression. Adv. Pharmacol. 2006;53:297–321. doi: 10.1016/S1054-3589(05)53014-X. [DOI] [PubMed] [Google Scholar]
- 13.Hamada K, Yoshihara C, Ito T, Tani K, Tagawa M, Sakuragawa N, Itoh H, Koyama Y. Antitumor effect of chondroitin sulfate-coated ternary granulocyte macrophage-colony-stimulating factor plasmid complex for ovarian cancer. J. Gene Med. 2012;14:120–127. doi: 10.1002/jgm.1647. [DOI] [PubMed] [Google Scholar]
- 14.Pathak A, Kumar P, Chuttani K, Jain S, Mishra AK, Vyas SP, Gupta KC. Gene expression, biodistribution, and pharmacoscintigraphic evaluation of chondroitin sulfate-PEI nanoconstructs mediated tumor gene therapy. ACS Nano. 2009;3:1493–1505. doi: 10.1021/nn900044f. [DOI] [PubMed] [Google Scholar]
- 15.Gajewiak J, Cai SS, Shu XZ, Prestwich GD. Aminooxy pluronics: synthesis and preparation of glycosaminoglycan adducts. Biomacromolecules. 2006;7:1781–1789. doi: 10.1021/bm060111b. [DOI] [PubMed] [Google Scholar]
- 16.Henry SM, El-Sayed ME, Pirie CM, Hoffman AS, Stayton PS. pH-responsive poly(styrene-alt-maleic anhydride) alkylamide copolymers for intracellular drug delivery. Biomacromolecules. 2006;7:2407–2414. doi: 10.1021/bm060143z. [DOI] [PubMed] [Google Scholar]
- 17.Xu P, Bajaj G, Shugg T, Van Alstine WG, Yeo Y. Zwitterionic chitosan derivatives for pH-sensitive stealth coating. Biomacromolecules. 2010;11:2352–2358. doi: 10.1021/bm100481r. [DOI] [PMC free article] [PubMed] [Google Scholar]
- 18.Hobbs SK, Monsky WL, Yuan F, Roberts WG, Griffith L, Torchilin VP, Jain RK. Regulation of transport pathways in tumor vessels: Role of tumor type and microenvironment. Proc. Nat. Acad. Sci. USA. 1998;95:4607–4612. doi: 10.1073/pnas.95.8.4607. [DOI] [PMC free article] [PubMed] [Google Scholar]
- 19.Anand VP, Cogdill CP, Klausner KA, Lister L, Barbolt T, Page BF, Urbanski P, Woss CJ, Boyce J. Reevaluation of ethylene oxide hemolysis and irritation potential. J. Biomed. Mater. Res. A. 2003;64:648–654. doi: 10.1002/jbm.a.10422. [DOI] [PubMed] [Google Scholar]
- 20.Guowei D, Adriane K, Chen X, Jie C, Yinfeng L. PVP magnetic nanospheres: Biocompatibility, in vitro and in vivo bleomycin release. Int. J. Pharm. 2007;328:78–85. doi: 10.1016/j.ijpharm.2006.07.042. [DOI] [PubMed] [Google Scholar]
- 21.Kawashima H, Hirose M, Hirose J, Nagakubo D, Plaas AH, Miyasaka M. Binding of a large chondroitin sulfate/dermatan sulfate proteoglycan, versican, to L-selectin, P-selectin, and CD44. J. Biol. Chem. 2000;275:35448–35456. doi: 10.1074/jbc.M003387200. [DOI] [PubMed] [Google Scholar]
- 22.Wang Z, Yan X. CD146, a multi-functional molecule beyond adhesion. Cancer Lett. 2013;330:150–162. doi: 10.1016/j.canlet.2012.11.049. [DOI] [PubMed] [Google Scholar]
- 23.Wang HF, Chen H, Ma MW, Wang JA, Tang TT, Ni LS, Yu JL, Li YZ, Bai BX. miR-573 regulates melanoma progression by targeting the melanoma cell adhesion molecule. Oncol. Rep. 2013;30:520–526. doi: 10.3892/or.2013.2451. [DOI] [PubMed] [Google Scholar]
- 24.Zeng Q, Li W, Lu D, Wu Z, Duan H, Luo Y, Feng J, Yang D, Fu L, Yan X. CD146, an epithelial-mesenchymal transition inducer, is associated with triple-negative breast cancer. Proc. Natl. Acad. Sci. U. S. A. 2012;109:1127–1132. doi: 10.1073/pnas.1111053108. [DOI] [PMC free article] [PubMed] [Google Scholar]
- 25.Todorovic V, Sersa G, Cemazar M. Gene electrotransfer of siRNAs against CD146 inhibits migration and invasion of human malignant melanoma cells SK-MEL28. Cancer Gene Ther. 2013;20:208–210. doi: 10.1038/cgt.2013.3. [DOI] [PubMed] [Google Scholar]
- 26.Yang Y, Hernandez R, Rao J, Yin L, Qu Y, Wu J, England CG, Graves SA, Lewis CM, Wang P, Meyerand ME, Nickles RJ, Bian XW, Cai W. Targeting CD146 with a 64Cu-labeled antibody enables in vivo immunoPET imaging of high-grade gliomas. Proc. Natl. Acad. Sci. U. S. A. 2015;112:E6525–6534. doi: 10.1073/pnas.1502648112. [DOI] [PMC free article] [PubMed] [Google Scholar]
- 27.Hernandez R, Sun H, England CG, Valdovinos HF, Barnhart TE, Yang Y, Cai W. ImmunoPET imaging of CD146 expression in malignant brain tumors. Mol. Pharmaceutics. 2016;13:2563–2570. doi: 10.1021/acs.molpharmaceut.6b00372. [DOI] [PMC free article] [PubMed] [Google Scholar]
- 28.Moghimi SM, Symonds P, Murray JC, Hunter AC, Debska G, Szewczyk A. A A two-stage poly(ethylenimine)-mediated cytotoxicity: implications for gene transfer/therapy. Mol. Ther. 2005;11:990–995. doi: 10.1016/j.ymthe.2005.02.010. [DOI] [PubMed] [Google Scholar]
- 29.Pinon A, Limami Y, Micallef L, Cook-Moreau J, Liagre B, Delage C, Duval RE, Simon A. A novel form of melanoma apoptosis resistance: melanogenesis up-regulation in apoptotic B16-F0 cells delays ursolic acid-triggered cell death. Exp. Cell Res. 2011;317:1669–1676. doi: 10.1016/j.yexcr.2011.04.014. [DOI] [PubMed] [Google Scholar]
- 30.Cunha ES, Kawahara R, Kadowaki MK, Amstalden HG, Noleto GR, Cadena SM, Winnischofer SM, Martinez GR. Melanogenesis stimulation in B16-F10 melanoma cells induces cell cycle alterations, increased ROS levels and a differential expression of proteins as revealed by proteomic analysis. Exp. Cell Res. 2012;318:1913–1925. doi: 10.1016/j.yexcr.2012.05.019. [DOI] [PubMed] [Google Scholar]
- 31.Mehrara E, Forssell-Aronsson E, Ahlman H, Bernhardt P. Specific growth rate versus doubling time for quantitative characterization of tumor growth rate. Cancer Res. 2007;67:3970–3975. doi: 10.1158/0008-5472.CAN-06-3822. [DOI] [PubMed] [Google Scholar]
Associated Data
This section collects any data citations, data availability statements, or supplementary materials included in this article.


