Abstract
A magnificent repository of Late Pleistocene terrestrial megafauna fossils is contained in ice-rich loess deposits of Alaska and Yukon, collectively eastern Beringia. The stable carbon (δ13C) and nitrogen (δ15N) isotope compositions of bone collagen from these fossils are routinely used to determine paleodiet and reconstruct the paleoecosystem. This approach requires consideration of changes in C- and N-isotope dynamics over time and their effects on the terrestrial vegetation isotopic baseline. To test for such changes between the Late Pleistocene and modern time, we compared δ13C and δ15N for vegetation and bone collagen and structural carbonate of some modern, Yukon, arctic ground squirrels with vegetation and bones from Late Pleistocene fossil arctic ground squirrel nests preserved in Yukon loess deposits. The isotopic discrimination between arctic ground squirrel bone collagen and their diet was measured using modern samples, as were isotopic changes during plant decomposition; Over-wintering decomposition of typical vegetation following senescence resulted in a minor change (~0–1 ‰) in δ13C of modern Yukon grasses. A major change (~2–10 ‰) in δ15N was measured for decomposing Yukon grasses thinly covered by loess. As expected, the collagen-diet C-isotope discrimination measured for modern samples confirms that modern vegetation δ13C is a suitable proxy for the Late Pleistocene vegetation in Yukon Territory, after correction for the Suess effect. The N-isotope composition of vegetation from the fossil arctic ground squirrel nests, however, is determined to be ~2.8 ‰ higher than modern grasslands in the region, after correction for decomposition effects. This result suggests a change in N dynamics in this region between the Late Pleistocene and modern time.
1 Introduction
The terminal Pleistocene ~13,000 years ago was a time of dynamic changes in large mammal communities [1], climate [2], ice sheet extent [3], and range and composition of vegetation [4], all of which was accompanied by a large global rise in atmospheric CO2 concentration (pCO2) [5]. Given the strong feedback mechanisms among herbivores, plant nutrient contents and ecosystem nutrient cycling [6], a comparable shift in nutrient dynamics likely accompanied such major environmental changes. Faith [7] suggested that a mode transition in N cycling was the main cause of megafauna extinction in North America after the terminal Pleistocene, driven mainly by a change in the N content of plants. He argued that environmental changes including rising atmospheric CO2 concentrations and possibly elevated temperature and precipitation amounts shifted the nutrient cycle from an accelerating to a decelerating mode. In the accelerating mode, abundant, excess plant N was returned to the soil by herbivores in readily bioavailable forms. By comparison, the decelerating mode was associated with lower plant N contents–a feedback reflecting lower soil N contents arising in large part by reduced returns of easily bioavailable nitrogen to the soil via herbivore excreta. Consequences of this shift included lower plant and soil N contents, reduced rates of nutrient cycling through the food web, reduced forage production, a lower biomass carrying capacity of the ecosystem, and ultimately collapse of megafauna populations. A study of lake sediment δ15N from a wide range of ecosystems also reported a gradual decrease in N availability of terrestrial ecosystems between ~15,000 to 7,000 years ago, which suggests a shift in the nature of terrestrial N cycling [8].
A change in N dynamics and availability should be traceable using the δ15N of plants [9] and animals. Higher plant δ15N generally reflects higher N availability and a more open N cycle [10]. This higher δ15N is passed on to the second trophic level (consumers) through the food chain [11]. Several studies have reported significantly different δ15N for herbivores over different Quaternary time periods (pre-, full- and post-Last Glacial Maximum (LGM)) in Alaska [12] and Eurasia [13–18], and some related those differences to a possible shift in the δ15N of herbivore diet in response to climate change. Considering these studies and empirical evidence for the influence of environmental factors on terrestrial N dynamics [19–21], some changes in N-isotope dynamics should be expected between the Late Pleistocene and modern time. If this prediction is accurate, then a suitably calibrated N-isotope baseline for vegetation should be utilized for Late Pleistocene ecosystems when comparing the δ15N of fossil bone collagen with modern counterparts [22].
In this study, we combine the stable carbon- and nitrogen-isotope compositions of modern [9] and fossil plants and animals to test for changes in N-isotope dynamics in Yukon Territory, northwest North America, between the Late Pleistocene and present time. Our study was focused in the Yukon, including portions that were not glaciated during the Pleistocene. This unglaciated region, known as Beringia, was an important terrestrial biotic refugium. It was home to a large community of flora and megafauna, and was a migration route for animals and people between Asia and North America during fully glacial times [23, 24]. At the end of the Pleistocene, significant changes in soil, plant and animal communities greatly affected the face of Beringia [4, 25–28].
We measured the stable carbon- and nitrogen-isotope compositions of modern Yukon arctic ground squirrel (Urocitellus parryii) bone collagen and structural carbonate, and compared these results to isotopic data for modern Yukon plants collected earlier by Tahmasebi et al. [9]. From this comparison, we have established the C- and N-isotope discrimination between arctic ground squirrel bone collagen and diet. We also determined the post-senescence, over-winter changes in δ13C and δ15N of six species of the most common Beringian plants. We then compared these results with those for an archive of Late Pleistocene flora contained in permafrost-preserved nests of ancient arctic ground squirrels (Urocitellus parryi). This allowed us to determine the effects of decomposition on the isotopic composition of fossil plants recovered from fossil nests. We used the δ13C and δ15N of these plant macrofossils and fossil bones to establish the differences between modern and Late Pleistocene C- and N-isotope baselines for vegetation in this portion of eastern Beringia.
1.1 Terrestrial N cycling and plant δ15N
A higher rate of N loss processes (denitrification and volatilization) relative to internal N cycling (nitrification, plant uptake, mineralization and immobilization) produces a more open N cycle [29, 30]. The increased N supply for N loss reactions, and associated large isotopic fractionations, leaves the soil system enriched in 15N [31–33]. Higher plant δ15N reflects higher N availability and a more open N cycle in terrestrial ecosystems [8, 10], and provides an index of N availability [20]. The main differences between more and less open N cycles are illustrated in Supporting Information S1 Fig [9].
1.2 Plant and soil δ13C
Plant δ13C is a function of photosynthetic pathway (C3, C4, CAM) and environmental factors including CO2 source, pCO2, water availability, latitude, altitude and irradiation [34, 35]. Generally, plant δ13C is affected by changing the δ13C of source CO2 or by modifying the ratio of intercellular to ambient pCO2 (Ci/Ca) [36]. Wooller et al.’s [37] study of modern grasses and sedges from Alaska and Yukon Territory reported higher δ13C for plants from dry habitats than wet habitats. Plants respond to water stress through stomatal closure, which results in reduced discrimination again 13C [34].
A decrease in stomatal density and plant δ13C during the deglacial period of the Late Pleistocene (~15,000–12,000 years ago), when pCO2 increased from 190 to 280 ppm, has been reported for fossil limber pine needles from western USA rat middens [38]. This effect may have been further amplified since the Industrial Revolution (~ AD 1850) by an additional increase in pCO2 and decrease in δ13Catm resulting from anthropogenic activities (known as the Suess effect) [39]. During the LGM δ13Catm was ‒6.4 ‰ but has decreased steadily since the Industrial Revolution to ‒8.6 ‰ in AD 2013 [40].
Vegetation following different photosynthesis pathways imparts different δ13C signals to organic carbon (OC) transferred to sediments and soils [41], and this signal can be used to track vegetation changes [42, 43]. Decomposition, however, can cause changes in original OC-δ13C, as discussed below.
1.3 Bone δ15N and δ13C
Bone collagen is one of the most common tissues analyzed in trophic ecology and paleodietary reconstruction. The most widely observed isotopic discriminations between collagen and diet range from +3 to +6 ‰ for C (Δ13CCol-diet) [44, 45] and +2 to +5 ‰ for N (Δ15NCol-diet) [46–48]. The 13C-enrichment (+9 to +11 ‰) reported for rodents from diet to bioapatite structural carbonate [49, 50] can also be used for dietary reconstruction. The C-isotope spacing between structural carbonate and collagen (Δ13CSc-Col) decreases with increasing trophic level [51] with a mean Δ13CSc-Col of +6 to +7 ‰ for herbivores, +5 ‰ for omnivores and +4 ‰ for carnivores [45]. This change may reflect different macromolecular compositions of diet among animals and/or different digestive physiologies of animals at different trophic levels [52].
1.4 Changes in δ15N and δ13C during plant decomposition
Several studies have reported 13C- and 15N-enrichment of decomposed plants, resulting in soil and sediment organic matter (OM) with higher δ13C and δ15N than fresh plant inputs (e.g. [53–56]). Possible causes include (i) kinetic isotopic fractionation during microbial respiration for C [57] and microbial metabolism for N, which results in contribution of 13C- and 15N-enriched microbial biomass to residual OM, and (ii) release of 13C-depleted CO2 during decomposition [57–59].
Microorganisms typically have higher δ13C (by 1–3 ‰) than fresh plants [58, 60, 61]. A key role for microbes in plant decomposition is supported by a general decrease in C/N for OM, approaching that of microbes [62], and an increased abundance of microbially derived compounds [63] with increasing soil depth. Enrichment in 15N of decomposed OM also has been explained by the higher δ15N of microbial products relative to fresh plant tissues; a metabolism-related positive trophic shift in δ15N (from 1.5 to 6 ‰) has been reported for soil microorganisms [58, 61]. Along with changes in isotopic composition, a decrease in total mass and C/N, and an increase in N content of plant detritus and soil OM, have been observed in most studies of decomposition under both aerobic and anaerobic conditions [64–67].
The permafrost-preserved ancient arctic ground squirrel nests, which are the focus of this study, are a mixture of plant remains, fungal hyphae, fecal pellets, seeds, hairs, insects and faunal remains [68]. Because of their originally high content of fresh OC, the nests can be considered as hot spots for microbial activity. Plant decomposition may occur on the land surface prior to gathering by squirrels, after collection and during storage in the active nest [69], and following burial and incorporation into the permafrost. Plant decomposition was likely very limited once in the permafrost zone, but probably not halted completely, given the possibility of sub-zero adapted microbes [70].
1.5 Study area
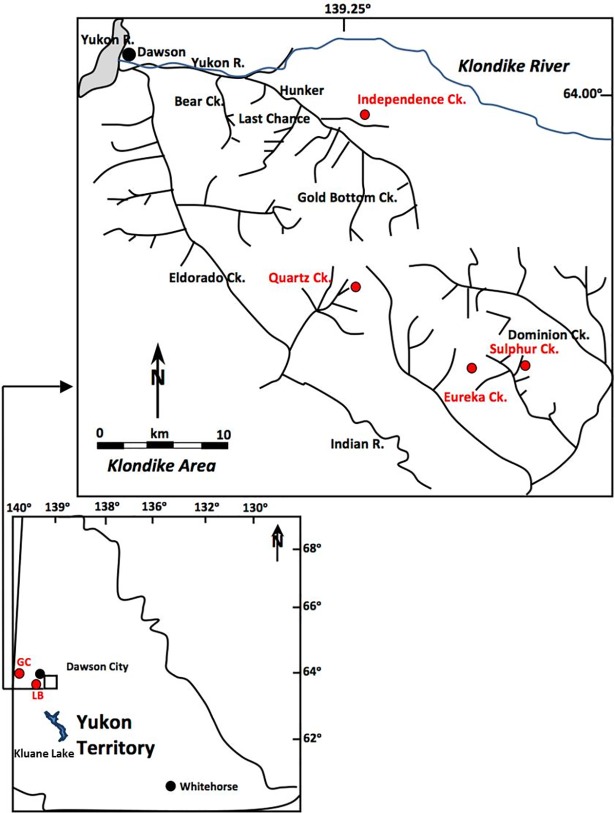
The Klondike area of west-central Yukon Territory, Canada, is part of the unglaciated interior regions of Alaska and Yukon that comprise eastern Beringia. Placer gold mining in the Klondike area has exposed perennially frozen ice and organic-rich loess deposits that contain a wealth of information about Pleistocene ecosystems [71, 72]. The majority of loess and colluviated loess was deposited within valley bottom after 27ka BP followed by an accumulation of peaty organic material in the early Holocene [73]. The loess was likely derived from a combination of the floodplains of the Yukon and Klondike Rivers and local creek sources during Late Pleistocene dry periods [73]. Paleosols showing evidence of mild chemical weathering are preserved within these frozen sediments [74]. The loess deposits generally overlay gold-bearing valley bottom gravels. The loess deposits are rich in Pleistocene vertebrate remains, dominated by megaherbivores such as steppe bison (Bison priscus), woolly mammoth (Mammuthus primigenius) and horse (Equus spp.) [71]. Permafrost-preserved nests of ice age arctic ground squirrels from the loess deposits provide detailed floristic data on the paleoenvironment during cold and dry phases of Late Pleistocene glacial periods [68, 75, 76]. For the current study, we examined ancient arctic ground squirrel nests collected from placer gold mines at Quartz Creek (QC), Independence Creek (IC), Sulphur Creek (SC) and Eureka Creek (EC) (Fig 1). A few samples were also obtained from Glacier Creek (GC) in the Sixty Mile River area and Little Blanche Creek (LB) (Fig 1).
Fig 1. Sample locations.
GC = Glacier Creek; LB = Little Blanche Creek. Adapted after Kotler and Burn [77].
2 Materials and methods
2.1 Sampling
Thirty-six (36) fossil arctic ground squirrel nests were collected, 24 from two main sites QC and IC in summer 2013, and 12 from these and other sites prior to 2013 and maintained in frozen condition in the collections of the Yukon Palaeontology Program, Department of Tourism and Culture (Table 1). Eight loess samples were collected in summer 2013 at sites QC and IC. Sample collection and field work did not involve any endangered or protected species. The fossil bones collected were fully consumed by the isotopic analyses. Remaining fossil plant material is being utilized in related a biomarker investigation. Unused loess is stored at the University of Western Ontario. It will be returned to Yukon Territory in accordance with our research permit once all investigations are completed.
Table 1. General data for sampling sites.
| Site | Site | Latitude | Longitude | Year of | # Nest | # Loess | ka BPa |
|---|---|---|---|---|---|---|---|
| ID | Location | Sampling | Samples | Samples | |||
| QC | Quartz Creek | 63.7513 | ‒139.1252 | 2012/2013 | 11 | 7 | >49.9 |
| IC | Independence Creek | 63.9831 | ‒139.0212 | 2013 | 16 | 1 | >41.2 to 22.52 |
| LB | Little Blanche Creek | 63.8312 | ‒139.0872 | 2009 | 1 | - | >40.3 |
| EC | Eureka Creek | 63.6300 | ‒138.8251 | 2011 | 2 | - | 26.53 |
| GC | Glacier Creekb | 64.0368 | ‒140.8195 | 2013 | 1 | - | 16.58 |
| SC | Sulphur Creekc | 63.6480 | ‒138.6710 | 2011 | 5 | - | 21.18 |
a Site dates are based on the oldest and youngest radiocarbon dates obtained at each location (details in S1 Table).
b Sixty Mile River area.
c Dan Klipper/Rod Smith Placer mine.
At all sites, placer gold mining provided a series of cuts (25–500 m length) that presented frozen sediments, from which fossil nests and loess were collected at different depths. Some sites (QC, EC and SC; Fig 1) contain marker horizons in the form of the Dawson tephra (ca. 25.3 ka BP, [78]) and the Sheep Creek tephra (ca. 80 ka BP, [74, 79]).
Most fossil nests were completely frozen at the time of sampling (labeled ‘F’). Samples or portions of samples that had thawed were labeled ‘T’. In some cases, parts of a single nest were frozen, but had thawed recently where exposed by the mining cut. Frozen and thawed portions were analyzed separately. An average composition was reported, if no significant isotopic differences were observed between the ‘F’ and ‘T’ portions. All nests were kept frozen until prepared for analyses, at which time they were freeze-dried.
Distinctive macrofossils were collected from the freeze-dried nests, including seeds, leaves, stems, rodent bones, insects and hair. Plant macrofossils were identified to the closest possible taxonomic resolution by comparison with Zazula et al. [68, 75, 80]. Radiocarbon dates of plant tissues (leaf, stem) and/or bone samples from 10 nests plus two wood samples from the QC and IC sites were obtained (S1 Table) from the NSF-Accelerator Mass Spectrometry facility at the University of Arizona, Tucson, Arizona, USA.
Tahmasebi et al. [9] described collection and analysis of modern plants from east of Kluane Lake and the Whitehorse area of Yukon Territory (Fig 1). Modern ground squirrel bones were also collected from these areas (3 bones from Kluane Lake in 2013; 11 individuals from Erik Nielsen Whitehorse International Airport in 2014).
Microscopic examination of plant tissues was performed using a Leica S8APO-MDG41 dissecting microscope. Some samples were also mounted on an Al-stub, coated with Au-Pd alloy, and examined using a Hitachi S3400N scanning electron microscope operated at 25.0 kV.
2.2 Decomposition experiment
Above-ground portions of six modern plant species (Poa glauca, Elymus trachycaulus, Artemisia frigida, Calamagrostis purpurascens, Festuca altaica, Elymus spicatus) were collected from loess-fed grasslands east of Kluane Lake. These species were among the most common plants in eastern Beringia during the Late Pleistocene [68, 81–84]. Six wooden boxes were prepared and divided in half using a layer of polystyrene. The bottom of each box was covered with loess (2 cm) from site QC. Air-dried tissues of each plant species were then cut into ~2–3 cm-long pieces, and a layer (2 cm) placed on top of the loess, one species per box. The plants in half of each box were then covered with 2 cm of loess (‘buried condition’) to simulate underground nest conditions, while the other half of each box remained uncovered (‘not buried’ condition).
The boxes were placed outside in London, ON, Canada from October 21, 2013 to September 2, 2014. The plant tissues sampled at the start of the experiment (day 1), and then after 164, 253 and 317 days. Monthly mean temperature and total precipitation data for this period were obtained from Environment Canada for the weather station closest (~8 km) to the site of the decomposition experiment (S2 Table). The day-164 sampling (April 2, 2014) followed a very cold winter; samplings at days-253 and -317 occurred during summer (June 30 and September 2, 2014). To test for reproducibility, three aliquots of plant tissue were taken from different locations in each ‘not buried’ and each ‘buried’ portion of each box during each sampling. The samples were washed with distilled water (DW), dried at 90°C, ground and stored in glass vials prior to analysis.
2.3 Sample preparation
Visibly well-preserved fossil plant materials were sampled from each nest and soaked in DW three times, each time for 1–2 minutes, to disperse attached sediment. The samples were then washed with DW, dried overnight at 90°C, ground using a Wig-L-Bug® (Crescent), and stored in small sealed glass vials while awaiting analysis. A similar preparation was used for modern plant samples [9].
Collagen was extracted from bone following Metcalfe et al. [85]. Bone bioapatite structural carbonate was assessed for post-mortem alteration using the Crystallinity Index (CI) and carbonate/phosphate ratio (C/P) obtained by Fourier Transform Infrared Spectroscopy (FTIR), following Webb et al. [86]. Precision was ± 0.11 for CI and ± 0.08 for C/P. Secondary carbonate was not detected in the FTIR spectra of any sample, and therefore no treatment for secondary carbonate removal was performed prior to isotopic analysis.
About 0.5–1 mg of crushed bone was reacted with ortho-phosphoric acid (H3PO4) under vacuum at 90°C for 25 minutes using a Micromass MultiPrep automated sampling device. The CO2 released was automatically transferred to a VG Optima isotope ratio mass spectrometer (IRMS), operated in dual-inlet mode, for measurement of δ13C, following the protocol of Metcalfe et al. [87] without any pretreatment for removing OM.
The preparation and analysis of loess for grain size, OM content, pH and mineralogy followed methods described by Tahmasebi et al. [9]. Carbonate removal from the loess was performed using acid fumigation [88].
2.4 OC and TN abundances and stable isotope analyses
Abundances of OC and total nitrogen (TN) in fossil plants and loess (after carbonate removal), and their carbon- and nitrogen-isotope compositions, were determined using an Elemental Analyzer (EA) (Costech Analytical Technologies, Valencia, CA, USA) coupled to a Thermo Scientific DeltaPLUS XL IRMS (Thermo Scientific, Bremen, Germany). The average C and N contents for the keratin standard was 47.74 ± 0.97 wt. % (n = 58) and 14.26 ± 0.44% (n = 113), respectively, which compare well to their expected values of 48.22 ± 1.07 wt. % and 14.85 ± 0.43 wt. %. The average N content for NIST 1547 was 2.72 ± 0.07 wt. % (n = 50), which compares well with its accepted value of 2.94 wt. %. Sample reproducibility for C was ± 0.43 wt. % (23 replicates) and for N was ± 0.02 wt. % (30 replicates).
All stable isotope results are presented using δ-notation [89], and related to VPDB for carbon and AIR for nitrogen using two-point calibrations. Plant and collagen C- and N-isotope compositions were calibrated using USGS40 and USGS41 [90]. Using this calibration, the average δ13C and δ15N obtained for an internal keratin standard were ‒24.04 ± 0.07 ‰ (n = 75) and +6.42 ± 0.12 ‰ (n = 113), respectively, which compare well with their accepted values of –24.05 ± 0.15 ‰ and +6.36 ± 0.22 ‰, respectively. The average δ13C obtained for IAEA-CH-6 was ‒10.50 ± 0.09 ‰ (n = 26), which compares well with its accepted value of ‒10.45 ± 0.03 ‰. Sample reproducibility was ± 0.15 ‰ for δ13C (26 replicates) and ± 0.08 ‰ for δ15N (32 replicates).
Structural carbonate C-isotope compositions (δ13CSc) were calibrated to VPDB using NBS 19 and LSVEC [91]. Using this calibration, the average δ13C obtained for internal calcite standards WS-1 and Suprapur were +0.69 ± 0.11 ‰ (n = 3) and ‒35.78 ± 0.01 ‰ (n = 2), respectively, which compare well with their accepted values of +0.76 ‰ and ‒35.55 ‰, respectively.
2.5 Statistical analysis
Changes in δ13C and δ15N of plant detritus during the decomposition experiment were tested using repeated measures ANOVA (general linear model) and applying the Greenhouse-Geisser correction. When the time effect on δ13C and δ15N was significant, the Bonferroni post hoc test was used to perform Pairwise Comparisons to determine at what interval the significant difference occurred. Possible correlations between decomposed plant δ15N and C/N or C content were assessed using Pearson’s rank correlation coefficient (R). All statistical analyses were performed in SPSS 20.
3 Results
3.1 Loess
Loess δ15N ranges from +1.3 ‰ in QC-4 to +4.8 ‰ in IC-9 and QC-5; variation in δ13C is smaller (‒26.1 to ‒25.4 ‰) (Table 2). Physical and chemical properties of the loess are given in Table A in S1 Text.
Table 2. Isotopic composition of loess TN and OC.
| Sample ID | δ15N (‰, AIR) | δ13C (‰, VPDB) |
|---|---|---|
| QC-2 | +4.6 | ‒25.8 |
| QC-3 | +3.4 | ‒25.7 |
| QC-4 | +1.3 | ‒26.1 |
| QC-5 | +4.8 | ‒25.6 |
| QC-6 | +4.7 | ‒25.4 |
| QC-7 | +4.3 | ‒25.4 |
| QC-8 | +4.5 | ‒25.4 |
| IC-9 | +4.8 | ‒25.4 |
3.2 Plants
3.2.1 Fossil plant botanical composition
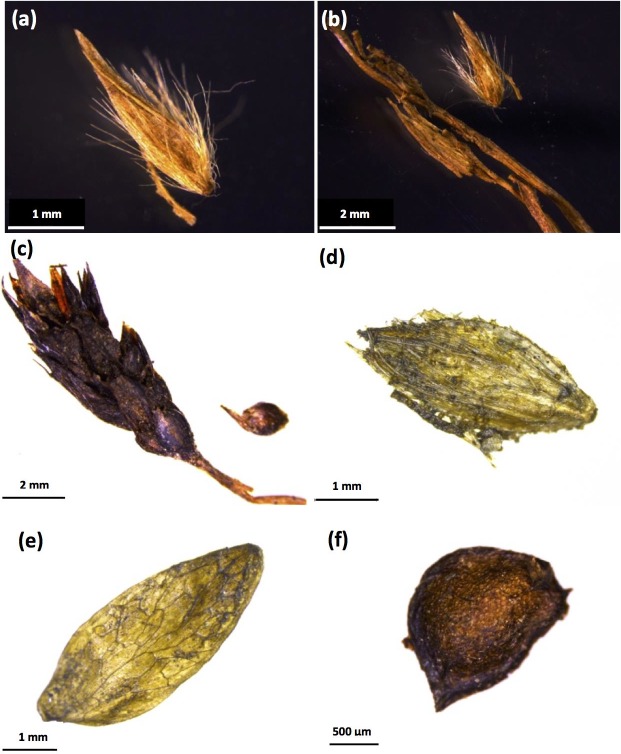
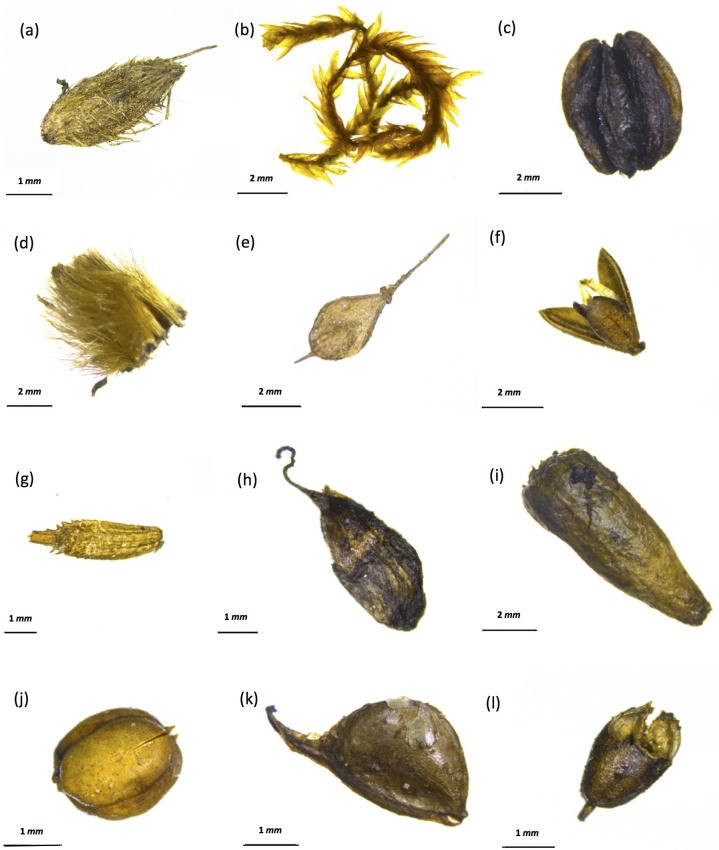
Plant macrofossils recovered from the nests are dominated by grass florets (Alopecurus sp., Deschampsia caespitose and Carex spp.) and the dried fruits of forbs (Taraxacum sp., Draba sp., Ranunculus sp., Lepidium densiflorum and Plantago cf. canescens) (Figs 2 and 3). These observations are consistent with previous descriptions of Late Pleistocene Beringia as a grass- and forb-dominated ecosystem [68, 83, 84, 92].
Fig 2. Typical plant macrofossils recovered from fossil nests.
(a) Deschampsia cespitose floret; (b) Deschampsia cespitosa floret with stem; (c) Carex albonigra floret and seed; (d) Alopecurus sp. floret; (e) Draba sp. Silique; (f) Ranunculus eschscholtzii-sulphureus type achene.
Fig 3. Typical plant macrofossils recovered from fossil nests.
(a) Carex floret; (b) Campylium stellatum stem with leaves; (c) Conioselinum cnidii folium carpel; (d) Asteracea achenese, pappus; (e) Lepidium densiflorum; (f) Phlox hoodii capsule; (g) Taraxacum ceratophorum achene; (h) Pedicularis sp. achene; (i) Silene cf. taymirensis capsule with seeds inside; (j) Polemonium capsule; (k) Ranunculuc pensylvanicus-macounii type achene; (l) Plantago cf. canescens capsule.
3.2.2 Plant C and N contents, stable isotope compositions and dating
The δ13C of the fossil plant samples ranges from ‒27.7 to ‒24.1 ‰ (avg. ‒26.1 ‰); values of δ15N exhibit much larger variation (+1.0 to +13.6 ‰; avg. +5.5 ‰) (Table 3). The N and C contents of all samples range from 1.0 to 2.8 wt. % and 21.2 to 39.5 wt. %, respectively, and have an average atomic C/N of 24.0 ± 6.0 (Table 3). Dates obtained for 10 selected samples from fossil nests (S1 Table) range from >49.9ka BP to 16.58ka BP. An age range for each sampling site was estimated based upon the oldest and youngest radiocarbon date obtained at each site (Table 1).
Table 3. C and N contents and isotopic compositions for fossil plants.
| Nest ID | δ13C | δ15N | C | N | Atomic C/N |
|---|---|---|---|---|---|
| (‰) | (wt. %) | ||||
| QC-1-T* | ‒26.6 | +4.6 | 29.5 | 1.7 | 20.8 |
| QC-2-F | ‒24.1 | +2.1 | 31.4 | 1.4 | 25.8 |
| QC-3-F | ‒26.2 | +1.1 | 28.1 | 1.6 | 20.4 |
| QC-3-T | ‒26.1 | +2.4 | 33.5 | 1.8 | 21.8 |
| QC-4-T | ‒26.1 | +1.9 | 31.4 | 1.6 | 22.4 |
| QC-5-F | ‒26.1 | +1.8 | 32.2 | 2.0 | 19.0 |
| QC-5-T | ‒27.7 | +2.1 | 32.1 | 2.0 | 18.5 |
| QC-7-F | ‒26.2 | +2.6 | 38.7 | 1.1 | 39.6 |
| QC-8-F | ‒25.6 | +7.5 | 36.0 | 1.8 | 22.9 |
| QC-9-F | ‒25.6 | +9.3 | 32.3 | 2.8 | 13.4 |
| QC-GZ-2-3 | ‒26.1 | +6.6 | 39.5 | 1.3 | 36.2 |
| QC-GZ-5-9 | ‒26.4 | +3.9 | 37.9 | 1.4 | 32.3 |
| QC-GZ-1 | ‒25.7 | +3.3 | 29.8 | 1.3 | 26.9 |
| IC-1-F | ‒26.7 | +10.3 | 31.5 | 1.9 | 19.8 |
| IC-1-T | ‒25.6 | +9.0 | 39.2 | 2.2 | 20.4 |
| IC-2-F | ‒26.6 | +6.2 | 30.8 | 1.6 | 22.2 |
| IC-3-F | ‒26.4 | +10.6 | 36.2 | 2.1 | 20.2 |
| IC-4-F | ‒26.9 | +1.2 | 28.6 | 1.6 | 21.3 |
| IC-5-F | ‒26.5 | +9.2 | 35.8 | 1.8 | 23.7 |
| IC-6-F | ‒27.6 | +10.0 | 30.2 | 1.4 | 26.1 |
| IC-7-F | ‒25.7 | +4.6 | 38.1 | 1.4 | 31.1 |
| IC-7-T | ‒25.3 | +4.3 | 25.4 | 1.6 | 18.9 |
| IC-8-F | ‒25.9 | +6.3 | 36.0 | 1.6 | 25.6 |
| IC-8-T | ‒26.8 | +8.5 | 33.5 | 1.7 | 22.7 |
| IC-9-F | ‒27.0 | +2.4 | 34.9 | 1.8 | 22.6 |
| IC-9-T | ‒26.3 | +1.9 | 36.1 | 1.7 | 24.2 |
| IC-10-F | ‒26.0 | +2.7 | 33.6 | 1.7 | 23.8 |
| IC-11-F | ‒26.4 | +4.2 | 32.8 | 1.4 | 28.3 |
| IC-12-F | ‒26.3 | +5.2 | 34.0 | 1.7 | 23.7 |
| IC-13-T | ‒25.2 | +3.4 | 36.5 | 1.8 | 24.1 |
| IC-14-F | ‒26.2 | +4.4 | 36.0 | 1.7 | 24.2 |
| IC-14-T | ‒26.1 | +3.6 | 30.8 | 1.6 | 23.1 |
| IC-15-T | ‒25.9 | +2.1 | 25.8 | 1.5 | 19.8 |
| IC-19-T | ‒26.2 | +6.3 | 35.8 | 1.7 | 24.6 |
| LB-GZ-1 | ‒26.3 | +7.1 | 31.4 | 2.0 | 18.5 |
| GC-GZ-3 | ‒25.7 | +7.4 | 21.2 | 2.1 | 11.8 |
| EC-GZ-6 | ‒25.6 | +7.5 | 36.6 | 1.7 | 24.8 |
| EC-GZ-2 | ‒26.8 | +4.8 | 29.0 | 1.9 | 18.1 |
| SC-GZ-8 | ‒24.9 | +5.8 | 29.3 | 1.7 | 20.7 |
| SC-GZ-7 | ‒26.5 | +1.0 | 38.7 | 1.0 | 44.3 |
| SC-GZ-4 | ‒26.2 | +5.2 | 30.1 | 1.3 | 27.8 |
| SC-GZ-2 | ‒24.7 | +8.5 | 38.9 | 1.7 | 27.3 |
| SC-GZ-10 | ‒26.0 | +13.6 | 33.4 | 1.5 | 26.3 |
*T: Thawed at the time of sampling; F: Frozen at the time of sampling.
Average δ13C and δ15N of all modern plant parts reported by Tahmasebi et al. [9] vary as follows: (i) Kluane Lake, δ13C = ‒27.1 ± 1.2 ‰ (n = 207), and δ15N = ‒0.1 ± 2.2 ‰ (n = 207); Whitehorse area, δ13C = ‒27.8 ± 1.2 ‰ (n = 115), and δ15N = +0.2 ± 2.2 ‰ (n = 115).
3.3 Bone isotopic compositions
Fossil bones recovered from the fossil nests consisted mostly of Arctic ground squirrels (IC-3, IC-19, IC-9-2, IC-14) and lemmings (GZ-1, GZ-3-1, IC-9-1, QC-4). Two bone samples, which differed in size and morphology, were selected from each of nests GZ-3 and IC-9. Specimen GZ-3-2 most probably belongs to a megaherbivore (unknown species), and was not included in isotopic averages for the rodents.
Bone collagen N contents (N >10 wt. %), atomic C/N (3.2 to 3.6) and extraction yields (>2%) (Table 4) indicate excellent collagen preservation [93]. Fossil rodent bone δ13CCol and δ15NCol range from ‒21.9 to ‒19.9 ‰ (avg. ‒21.3 ‰), and +3.9 to +5.6 ‰ (avg. +4.6 ‰), respectively (Table 4). Modern bone δ13CCol and δ15NCol are lower, ranging from ‒24.2 to ‒21.4 ‰ (avg. ‒23.2 ‰), and +1.1 to +3.2 ‰ (avg. +2.1 ‰), respectively (Table 4). The average Δ13CCol-Bulk plant and Δ15NCol-Bulk plant for the modern bone collagen samples are +4.7 ‰ and +1.9 ‰, respectively, based on the average δ13C and δ15N obtained for the modern plants from each site (Whitehorse and Kluane Lake; see Tahmesabi et al. [9]).
Table 4. Bone δ13CCol, δ13CSc, δ15NCol, CCol and NCol.
| ID | δ13CCol | δ13CSc | Δ13CSc-Col |
δ15NCol |
C | N | C/N | Collagen |
|---|---|---|---|---|---|---|---|---|
| (‰ VPDB) | (‰, AIR) | (wt. %) | (atomic) | Yield (%) | ||||
| Fossil bone | ||||||||
| QC-4 | ‒21.4 | ‒13.1 | +8.3 | +4.8 | 37.6 | 13.2 | 3.3 | 8.5 |
| IC-3 | ‒21.4 | ‒14.5 | +6.9 | +5.1 | 32.8 | 11.5 | 3.3 | 4.5 |
| IC-9-1 | ‒21.7 | ‒14.3 | +7.4 | +4.0 | 42.4 | 14.7 | 3.4 | 5.1 |
| IC-9-2 | ‒21.5 | ‒14.0 | +7.6 | +4.2 | 39.6 | 13.8 | 3.4 | 6.5 |
| IC-14 | ‒21.2 | ‒12.5 | +8.7 | +3.9 | 28.7 | 9.3* | 3.6 | 2.3 |
| IC-19 | ‒21.2 | ‒13.2 | +8.0 | +4.6 | 43.8 | 15.9 | 3.2 | 15.3 |
| LB-GZ-1 | ‒21.9 | ‒14.5 | +7.4 | +4.5 | 43.6 | 15.2 | 3.4 | 8.6 |
| GC-GZ-3-1 | ‒19.9 | ‒12.0 | +7.9 | +5.6 | 42.4 | 15.0 | 3.3 | 9.1 |
| GC-GZ-3-2 | ‒19.5 | - | - | +5.3 | 32.5 | 11.4 | 3.3 | 4.4 |
| Modern | ||||||||
| M-1-female1 | ‒23.8 | ‒18.3 | +5.4 | +1.3 | 48.3 | 16.8 | 3.4 | 15.4 |
| M-2-male1 | ‒24.2 | ‒18.7 | +5.6 | +2.8 | 41.7 | 14.7 | 3.3 | 16.5 |
| M-3-male1 | ‒23.8 | ‒17.7 | +6.1 | +2.8 | 47.9 | 16.7 | 3.4 | 15.7 |
| M-5-male1 | ‒23.9 | ‒17.6 | +6.2 | +2.1 | 41.0 | 14.6 | 3.3 | 17.2 |
| M-6-male1 | ‒22.7 | ‒16.9 | +5.9 | +2.3 | 42.2 | 14.7 | 3.4 | 16.4 |
| M-7-male1 | ‒23.5 | ‒17.6 | +6.0 | +1.1 | 46.4 | 15.9 | 3.4 | 14.6 |
| M-8-female1 | ‒23.7 | ‒18.3 | +5.4 | +1.9 | 47.5 | 16.5 | 3.4 | 15.3 |
| M-9-male1 | ‒23.4 | ‒17.7 | +5.7 | +3.2 | 40.5 | 14.4 | 3.3 | 14.3 |
| M-10-male1 | ‒23.3 | ‒18.3 | +5.0 | +2.4 | 41.1 | 14.6 | 3.3 | 16.7 |
| M-11-male1 | ‒23.5 | ‒17.9 | +5.6 | +1.8 | 39.9 | 14.1 | 3.3 | 16.9 |
| M-12-male1 | ‒23.9 | ‒18.9 | +5.0 | +2.0 | 42.2 | 15.0 | 3.3 | 15.3 |
| M-142 | ‒21.7 | ‒9.6 | +11.6 | +1.8 | 43.9 | 15.6 | 3.3 | 7.0 |
| M-152 | ‒22.7 | ‒8.9 | +13.8 | +1.8 | 41.8 | 14.3 | 3.4 | 12.9 |
| M-162 | ‒21.4 | ‒8.8 | +12.6 | +1.9 | 36.2 | 12.8 | 3.3 | 8.9 |
1 Sampling site: Whitehorse.
2 Sampling site: East of Kluane Lake.
* Only 0.06 mg of the sample was available for analysis because of the small size of the bone fragment.
Mean FTIR-CI values of modern and fossil bone bioapatite are 2.5 ± 0.1 (n = 14) and 2.6 ± 0.2 (n = 8), respectively (S3 Table), typical of unaltered material [94]. The mean C/P of both modern and fossil bones is 0.7 ± 0.1 (S3 Table), which is only slightly higher than well-preserved bone (~0.5) [95]. No secondary calcite or francolite was observed in the FTIR spectra. Hence, the δ13CSc results are considered to reflect in vivo conditions. The δ13CSc of fossil bone ranges from ‒14.5 to ‒12.0 ‰ (avg. ‒13.5 ‰), and the Δ13CSc-Col varies from +6.9 to +8.7 ‰ (avg. +7.8 ‰) (Table 4). For the modern bone samples, the δ13CSc varies considerably between the two study areas, ranging from ‒9.6 to ‒8.8 ‰ (avg. ‒9.1 ‰) at Kluane Lake vs. ‒18.9 to ‒16.9 ‰ (avg. ‒18.0 ‰) at Whitehorse (Table 4). The Δ13CSc-Col at Kluane Lake varies from 11.6 to 13.8 ‰ (avg. +12.7 ‰) vs. +5.0 to +6.2 ‰ (avg. +5.6 ‰) at Whitehorse.
3.4 Modern plant decomposition
3.4.1 Isotopic data
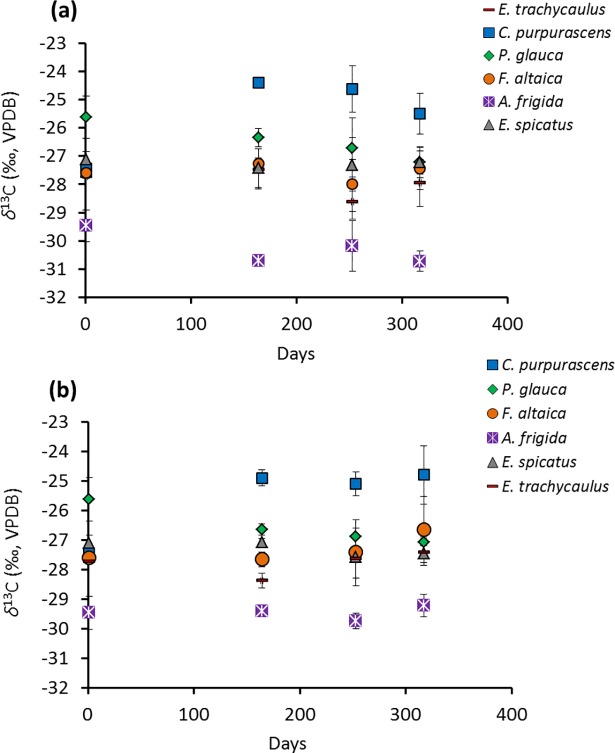
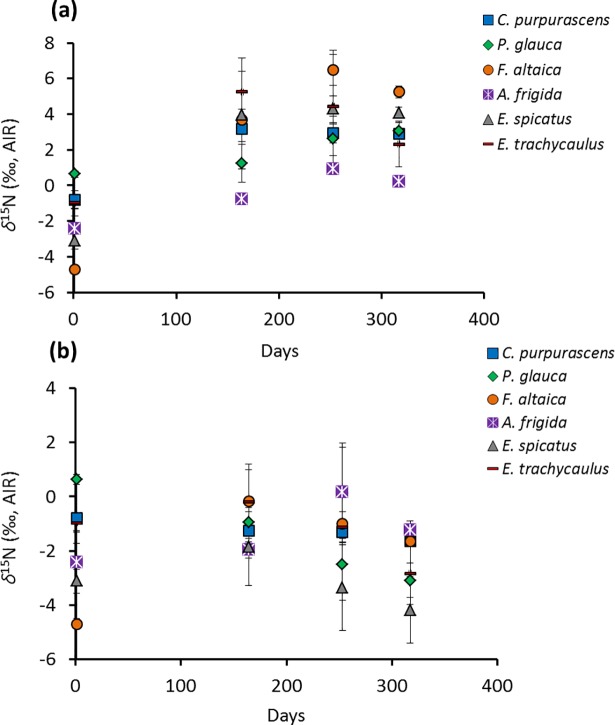
Figs 4A and 4B and 5A and 5B illustrate the change in average plant litter δ13C (δ13Clitter) and δ15N (δ15Nlitter), respectively, over 317 days, for ‘buried’ and ‘not buried’ samples, respectively (See Table A in S1 File for all data). Table 5 summarizes the repeated measure ANOVA results for the time effect on δ13Clitter and δ15Nlitter during this experiment. For samples showing a significant time effect on their isotopic compositions, the Benferroni post hoc test results are summarized in Supporting Information (Table A for δ13C and Table B for δ15N in S2 File).
Fig 4.
Values of δ13Clitter vs. time during decomposition: (a) ‘buried’ and (b) ‘not buried’.
Fig 5.
Values of δ15Nlitter vs. time during decomposition: (a) ‘buried’ and (b) ‘not buried’.
Table 5. Repeated measure ANOVA test results for time effects on δ13Clitter and δ15Nlitter.
| Plant ID | Treatments | δ13C (‰, VPDB) | δ15N (‰, AIR) | ||
|---|---|---|---|---|---|
| p | F(X,Y) | p | F(X,Y) | ||
| E. trachycaulus | B | 0.210 | F(1.69,3.38) = 2.54 | 0.042 | F(1.53,3.07) = 10.94 |
| NB | 0.241 | F(1.22,0.52) = 2.48 | 0.256 | F(1.29,2.57) = 2.26 | |
| C. purpurascens | B | 0.021 | F(1.53,3.06) = 17.92 | 0.008 | F(1.67,3.34) = 29.95 |
| NB | 0.052 | F(1.10,1.93) = 14.94 | 0.795 | F(1.32,2.64) = 0.14 | |
| P. glauca | B | 0.148 | F(1.08,2.16) = 4.95 | 0.034 | F(1.98,3.96) = 8.96 |
| NB | 0.131 | F(1.25,2.50) = 5.04 | 0.004 | F(1.87,3.74) = 34.91 | |
| F. altaica | B | 0.351 | F(1.20,2.40) = 1.44 | 0.012 | F(1.98,3.96) = 16.46 |
| NB | 0.316 | F(1.00,2.01) = 1.76 | 0.327 | F(1.00,2.01) = 1.65 | |
| A. frigida | B | 0.230 | F(1.37,2.73) = 2.52 | 0.050 | F(1.03,2.07) = 17.53 |
| NB | 0.480 | F(1.97,3.95) = 0.89 | 0.227 | F(1.43,2.86) = 2.51 | |
| E. spicatus | B | 0.842 | F(1.12,2.23) = 0.07 | 0.079 | F(1.06,2.11) = 10.38 |
| NB | 0.589 | F(1.06,2.12) = 0.43 | 0.371 | F(1.44,2.88) = 1.30 | |
B: Buried
NB: Not Buried
Values in boldface are statistically significant (p ≤ 0.05).
C. purpurascens is the only species showing a significant shift in δ13C (from ‒27.5 ‰ to ‒25.5 ‰ for the ‘buried’ sample), particularly in the first 164 days (Table A in S2 File). A much larger change is observed in δ15Nlitter for the buried samples, ranging from an increase of ~2.4 ‰ for P. glauca to an increase of ~10.0 ‰ for F. altaica (Fig 5A). This change is statistically significant for all species except E. spicatus (Table 5). For all samples, most of the 15N-enrichment occurred in the first 164 days. For ‘not buried’ samples, only P. glauca shows a significant change in δ15N, which is characterized by a progressive decrease in 15N (Table 5; Table B in S2 File).
3.4.2 C and N contents, atomic C/N, and SEM
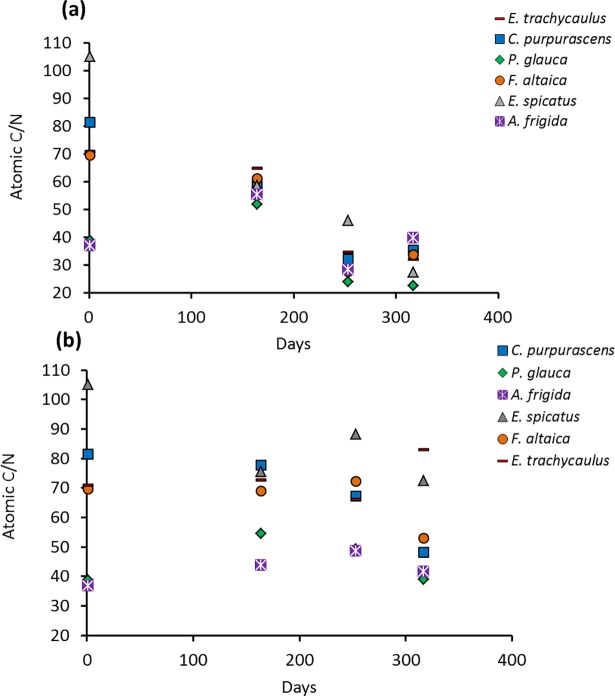
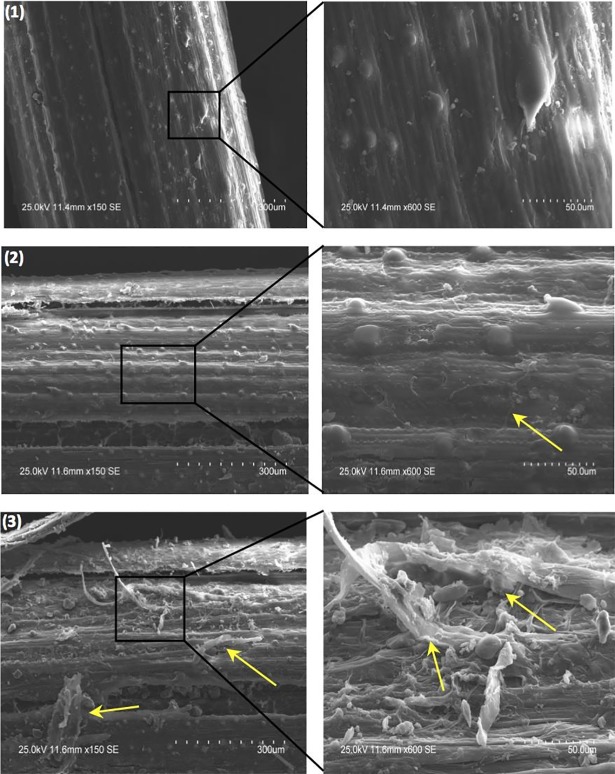
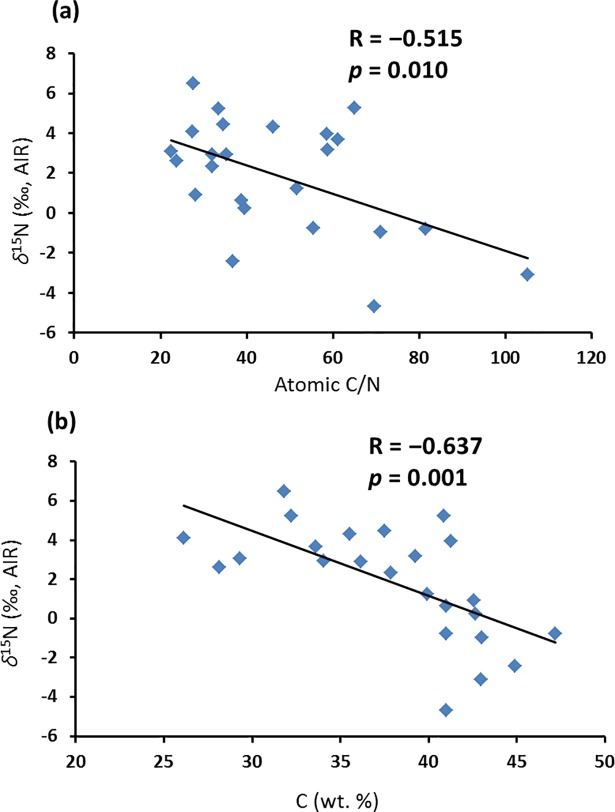
All data are listed in Supporting Information Tables A, B and C in S1 File. Atomic C/N of the starting materials ranges from 36.9 to 105.2 (Fig 6A and 6B), with P. glauca and A. frigida having the lowest ratio (<50), mainly because of their higher N contents relative to other species. During the burial experiment, the atomic C/N of all species decreased, except for A. frigida (Fig 6A). P. glauca and E. spicatus show the smallest (16.3) and largest (77.7) changes, respectively. For ‘not buried’ samples, there is no consistent pattern of change in atomic C/N (Fig 6B). ‘Buried’ plant detritus has higher visible abundances of fungal hyphae than ‘not buried’ equivalents (Fig 7).
Fig 6.
Atomic C/N vs. time during decomposition: (a) ‘buried’ and (b) ‘not buried’.
Fig 7.
SEM images of F. altaica: (1) before decomposition, (2) after 317 days of decomposition without a covering of loess (‘not buried’), and (3) after 317 days of decomposition under a thin covering of loess (‘buried’). (Yellow arrows point to fungal hypha).
4 Discussion
4.1 Modern plant decomposition experiment
In general, the δ13Clitter does not show a clear time-dependent pattern during decomposition, either for ‘buried’ or ‘not buried’ samples. C. purpurascens is the only species showing a significant change (13C-enrichment), which occurs in the first 164 days of the ‘buried’ treatment.
The large increase in δ15Nlitter (2.5–10 ‰; Fig 5A) observed here for ‘buried’ vs. ‘not buried’ samples (Fig 5B), coupled with the decrease in C/N (16–78; Fig 6A) and the abundance of fungal hyphae on the surfaces of the former (Fig 7), suggests a link with microbially mediated decomposition of the litter. Greater decomposition of ‘buried’ vs. ‘not buried’ plant detritus can be explained by a buffering role for soil in balancing pH, water and oxygen availability, all of which would favour decomposers [96]. In particular, soil water content undergoes greater fluctuation at the soil surface because of the former’s direct exposure to wind, light and rain.
The appearance of earthworms in the ‘buried’ plant detritus at sampling days 253 and 317 is a potential complication. Earthworms are rare in Yukon Territory at present, and their importance in Beringia over the time span considered here is unknown. Relative to other detritivores, earthworms can accelerate OM decomposition rates [97–99]. Earthworms are also known to lower SOM C/N via digestion driven by their gut microbial community [100]. The abundant fungal hyphae observed in our experiment, however, suggest that bacterial communities related to earthworm arrival had not become dominant relative to fungal decomposers, and hence our analogy to an earthworm-free system remains valid. We note also that most change in C/N of the ‘buried’ plant detritus occurred prior to earthworm arrival.
Most 15N-enrichment of ‘buried’ samples occurred during the first 164 days (Fig 5A), when the most labile plant material would have been in greatest abundance. The samples also received the most precipitation during this time and were insulated from the coldest surface temperatures by loess and snow cover, which are both conditions that favour decomposition.
Dried P. glauca and A. frigida, which had much lower initial C/N than other species examined, showed much less change in C/N during decomposition, and in ‘buried’ treatment they showed only minor variation in δ13Clitter or δ15Nlitter. ‘Not buried’ samples behaved similarly, except for a significant lowering of δ15Nlitter for P. glauca. Why P. glauca and A. frigida did not show greater 15N enrichment during early decomposition may be related to litter quality [101], which can affect microbially mediated decomposition. Artemisia contains essential oils, anti-herbivory alkaloids and anti-fungal secondary metabolites, which inhibit bacterial and fungal processes [102, 103].
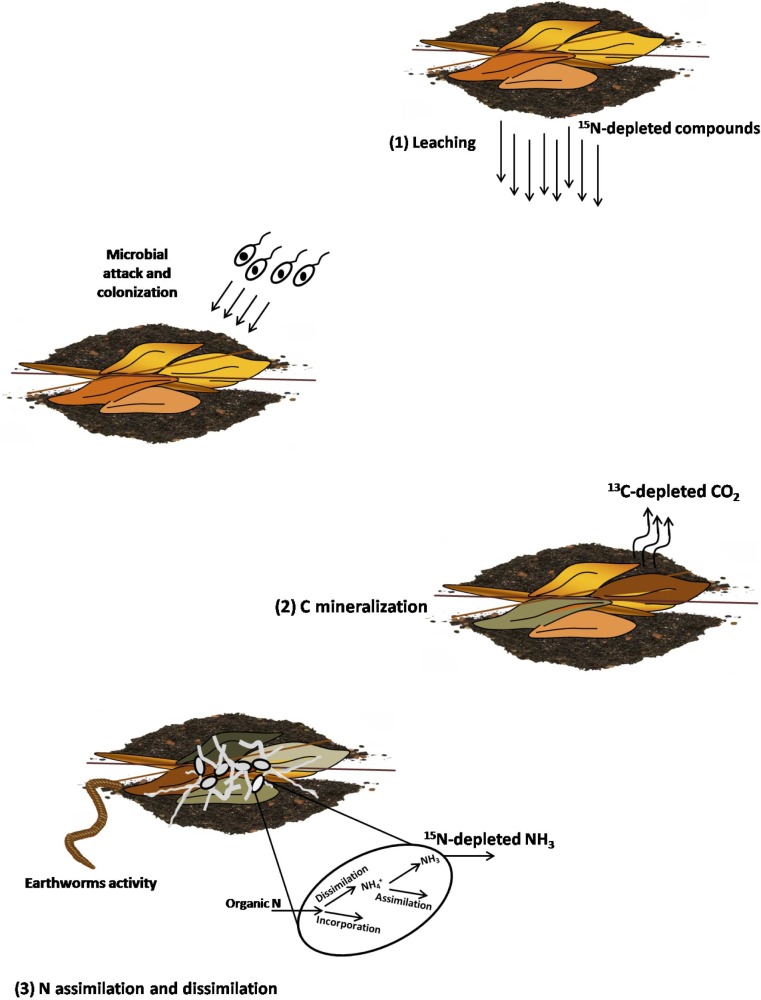
Fig 8 presents a model for 13C-enrichment of ‘buried’ C. purpurascens and 15N-enrichment of most species examined. Leaching early in decomposition [104] enriches the system in 15N by removal of low-15N compounds [105]. Microbial respiration releases 13C-depleted CO2, leaving microbial products enriched in 13C and causing a decrease in atomic C/N. The negative correlation between δ15N and both atomic C/N and C (wt. %) for all six species over 317 days (Fig 9) is similar to that between microbial 15N-enrichment and soil-soluble C/N reported by Dijkstra et al. [106]. They suggested that early stages of plant decomposition are characterized by microbial assimilation of N, while N dissimilation is more prevalent in later stages. Once labile C-compounds are consumed during early decomposition, microbes then consume more N-rich compounds, dissimilating portions of organic N into NH4+. After some NH4+ is assimilated, the remainder is released as NH3 (Fig 8). N-isotope fractionation during these processes leads to 15N-enrichment of microbes and release of 15N-depleted NH3 [31]. While the putative effect of earthworm gut contents on δ15Nlitter is unknown, their nutrient-rich casts most probably contribute N, adding further complexity to the simple system described above. Based on the pattern of change in C/N, which can be explained mostly by C loss (Fig 8), significant change in bulk N content of the decomposed plant tissues plus microbial biomass is unlikely. A few patterns remain unexplained, such as the decrease in δ15N of ‘not buried’ P. glauca as decomposition progressed. This experiment may not have reached steady state by the end of 317 days.
Fig 8.
Processes causing 13C- and 15N-enrichment of ‘buried’ decomposing plants: (1) leaching of 15N-depleted compounds [104, 105]; (2) C mineralization and release of 13C-depleted CO2, and (3) microbial N metabolism (release of 15N-depleted NH3; enrichment of microbes in 15N [106]).
Fig 9.
Bivariate plot of (a) δ15N vs. atomic C/N, and (b) δ15N vs. C (wt. %) of decomposed plant debris.
We suggest that plant tissues underwent similar isotopic alteration following incorporation into Pleistocene arctic ground squirrel nests. Therefore, consideration of decomposition isotopic effect in interpreting isotopic data from fossil plants is necessary. Decomposition of senesced plants at the ground surface, however, likely had little effect on plant isotopic compositions.
4.2 Loess
The loess samples are dominated by silt (Table A in S1 Text), characteristic of other Klondike loess and associated paleosols [73, 74], and their mineralogy (quartz, feldspar, calcite) (Table B in S1 Text) is typical of Quaternary loess worldwide [107]. The OM content (5–20 wt. %) and high abundance of fine and very fine roots in all loess samples suggest a base-rich environment during the Late Pleistocene and that below-ground plant parts were a major source of OM [74]. As also noted by Sanborn et al. [74], the presence of ground squirrel nests and the lack of peat layers (OC >17 wt. %) indicate well-drained conditions in the past. The average loess δ13C of ‒25.6 ‰ is typical of pre-Industrial Revolution C3 vegetation. Most loess samples have a high and tight range of δ15N (+3.4 to +4.8 ‰). The one outlier (QC-4; δ15N = +1.3 ‰) represents a dark layer between two lighter loess layers, and has the highest OM (20.4 wt. %) and OC (9.5 wt. %) contents of the samples analyzed (Table A in S1 Text). These features may indicate a very cold period during which decomposition was limited.
4.3 Plant macrofossils
The δ13C of plant macrofossils (‒27.7 to ‒24.1 ‰) from the Pleistocene ground squirrel nests indicates C3 vegetation and is consistent (after Suess effect correction) with earlier results for modern [9, 37] and Late Pleistocene fossil plants from eastern Beringia [92, 108]. The positive δ15N (majority >+2 ‰) of the arctic ground squirrel nests is higher on average than reported for modern plants [9] and Late Pleistocene plant macrofossils (avg. ‒2.8 ‰) [92] from eastern Beringia. The N contents of the squirrel nest plants lie in the range known for modern subarctic plants [9, 37]. The C contents are lower than reported for modern plants [9, 37], but similar to Late Pleistocene fossil plants from eastern Beringia [37]. These results point to possible changes in the original isotopic and elemental compositions of the fossil plants comprising the arctic ground squirrel nests.
4.4 Fossil and modern bone collagen and bioapatite structural carbonate
The average δ13CCol of fossil bones (‒21.3 ± 0.7 ‰) is similar to the range reported by Bocherens et al. [109] for four post-LGM ground squirrels (‒21.0 to ‒20.3 ‰) from Switzerland, which date to 14–12 ka BP. Assuming Δ13CCol-diet of +3 to +4 ‰ [110] and Δ13CSc-diet of +9.9 ‰ [49], the average δ13CCol (‒21.3 ± 0.7 ‰) and δ13CSc (‒13.5 ± 1.0 ‰) of these fossil bones suggest an entirely C3 diet. This result is consistent with previous paleovegetation reconstructions for eastern Beringia [37, 92].
The average δ13CCol of the modern ground squirrel bones (‒23.2 ± 0.8 ‰) also compares well with results for the fossil bones (after Suess effect correction (~+2.2 ‰)). The average δ13CSc for these samples, however, differs between localities. At Whitehorse, the average δ13CSc (‒18.0 ± 0.6 ‰) indicates an entirely C3 diet, whereas the average δ13CSc (‒9.1 ± 0.4 ‰) at Kluane Lake suggests a mixed diet of C3 plants and more 13C-rich vegetation. The Kluane Lake δ13CSc can be explained if protein (represented by collagen) was derived mainly from the C3 portion of the diet, whereas whole diet (represented by structural carbonate), which includes carbohydrates and lipids, came from a C4 source or 13C-rich macrophytes. The high Δ13CSc-Col of Kluane Lake ground squirrels (+12.7 ± 1.1 ‰) is similar to that of captive rats raised on a mixed diet of C3-proteins and C4-carbohydrates and lipids [49, 50]. A significant presence of C4 plants in subarctic regions is not expected [111], although C4 plants (e.g. Muhlenbergia richardsonis) are known from the Kluane Lake area (Consortia of Pacific Northwest Herbaria: B. A. Bennett Herbarium). Wooller et al. [37] also reported a few C4 grasses from Alaska and Yukon with δ13C ranging from ‒14 to ‒12 ‰. Consumption of high-13C macrophytes is also possible given the study area’s proximity to Kluane Lake at its junction with the Slims River. There, very shallow water provides an ephemeral home for submergent macrophytes, which are exposed on river/delta flats during seasonal dry conditions. Consumption of high-13C macrophytes or C4 plants that likely have low protein content (as reported for M. richardsonis by Dittberner and Olsen [112]), could increase consumer’s δ13CSc, without significantly changing δ13CCol.
The δ15NCol of the fossil bones (+3.9 to +5.6 ‰) is much higher than reported by Bocherens et al. [109] (+1.7 to +2.5 ‰) for the post-LGM ground squirrels from Switzerland. Much of this greater enrichment in 15N is unlikely to be related to significant consumption at higher trophic levels, given the largely herbivorous nature of arctic ground squirrels, a condition also implied by the Beringian samples’ Δ13CSc-Col (+6.9 to +8.7 ‰) [45]. That said, minor consumption of insects, small invertebrates, and other carrion cannot be ruled out. The implications of this difference in N-isotope composition are discussed next.
4.5 Late Pleistocene Beringia and modern comparisons
There is no exact modern analogue for Late Pleistocene Beringia [4, 27]. Some portions of west-central Yukon, however, such as the eastern shoreline of Kluane Lake, may be broadly comparable in climatic conditions (windy, arid, low temperature), sediment and soils (continuous loess deposition, high pH, high OM) and vegetation (an Artemisia-Festuca grassland) [73, 81] [9, 68, 83, 84]. Local factors including elevation, topography, strength of loess deposition, drainage, aspect, slope and water content, which are superimposed upon the regional patterns, have determined the ecological mosaics at both modern Kluane Lake and ancient eastern Beringia [80, 81]. The south-central Whitehorse valley, located farther to the east from Kluane Lake, has similar continental, cold and dry climate and grassland vegetation.
4.6 Modern and ancient C and N isotope baselines
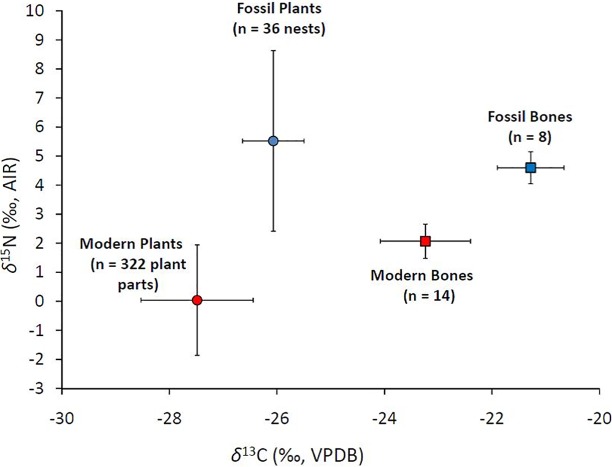
The higher average δ13C and δ15N of fossil plants and bone collagen relative to their modern equivalents (Fig 10) could point to a change in N- and C-isotope food web baselines in this ecosystem between the Late Pleistocene and present time. The lower average δ13C of modern plants (by ~1.4 ‰) and modern arctic ground squirrel bone collagen (by ~2.0 ‰) relative to their ancient counterparts can be largely explained by the ~2.2 ‰ decrease in δ13Catm arising from the Suess effect. The difference between modern and ancient plant δ13C, however, is ~0.8 ‰ smaller than predicted from the change in δ13Catm. One possible explanation is that low-level microbial processes further modified the δ13C of ancient vegetation during its residence in permafrost.
Fig 10. Average δ15N vs. δ13C of fossil and modern samples.
The fossil plants and fossil bone collagen also have higher average δ15N than their modern counterparts (Fig 10). The difference for plants (~5.5 ‰), however, is twice as large as for bones (+2.5 ‰). Part of the higher plant δ15N could indicate a different rate of N dynamics in Beringia during the Late Pleistocene than at present time. The much larger size of this difference between fossil and modern plants compared to fossil and modern bone collagen, however, suggests that fossil plant δ15N was also affected by other factors.
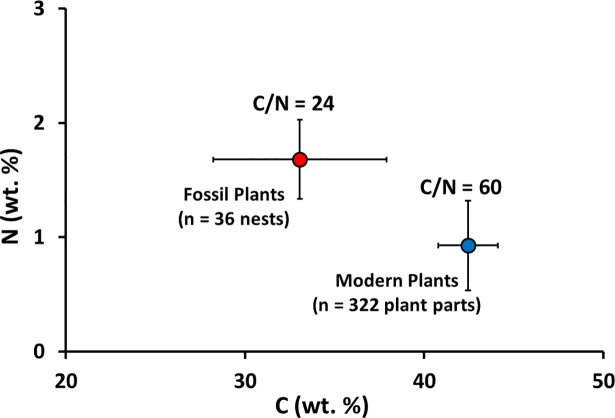
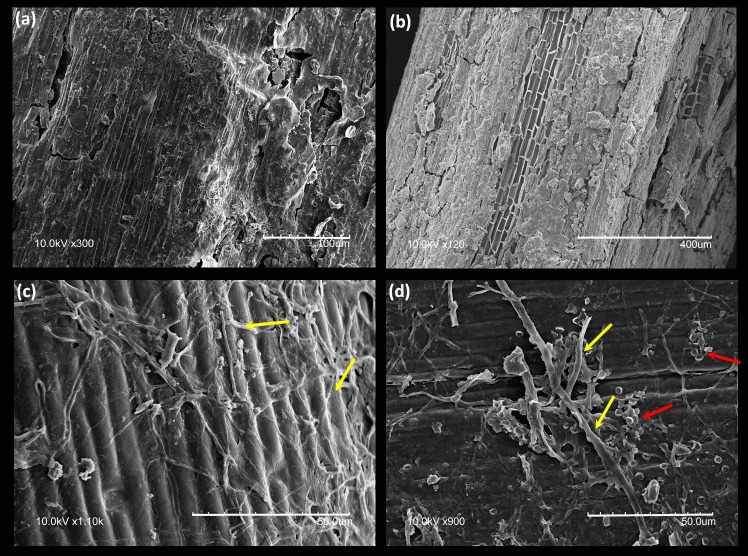
Three lines of evidence suggest that microbially mediated decomposition modified the original N-isotope composition of fossil plants. First, the fossil plants have higher N contents, lower C contents, and significantly lower atomic C/N than the modern plants (Fig 11), consistent with the results of the decomposition experiment. Second, SEM images of plant macrofossils indicate plant tissue alteration and establishment of fungal hyphae and bacteria (Fig 12). Third, if ground squirrels/lemmings ate similar plant material to that stored in their nests, then the δ-values for their diet should match those measured for these plants, assuming modern values for Δ13CCol-bulk plant (4.7 ‰) and Δ15NCol-bulk plant (1.9 ‰).
Fig 11. Average N vs. C contents of fossil and modern plants.
Fig 12.
SEM images of plant macrofossils: (a, b) typical decomposed surface of fossil stems, and (c, d) fungal hypha (yellow arrows) and bacteria cells (red arrows) on fossil stem surfaces.
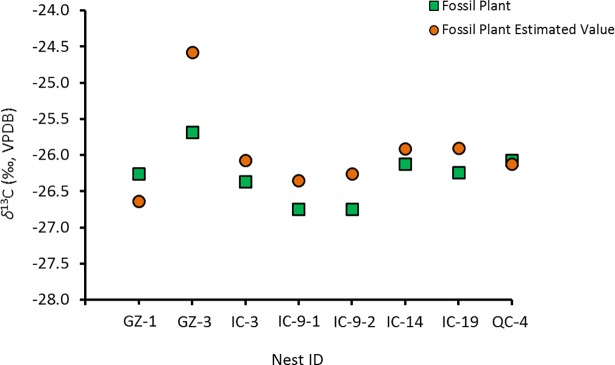
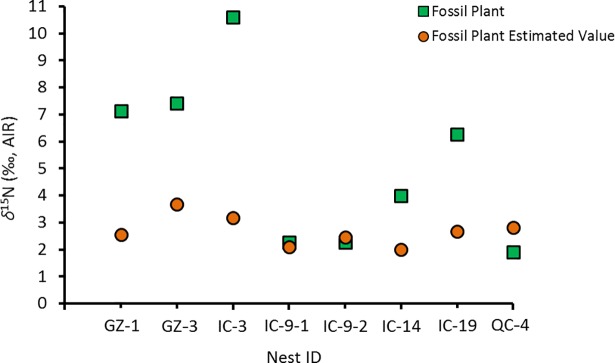
For δ13C, the match is good, except for one sample (GZ-3) (Fig 13). For δ15N, only two nests (IC-9 and QC-4) have measured δ15N close to predicted values (Fig 14).
Fig 13. Measured δ13C vs. predicted δ13C for fossil plants using fossil bone δ13C and modern Δ13CCol-Bulk plant = 4.7 ‰.
Fig 14. Measured δ15N vs. predicted δ15N for fossil plants using fossil bone δ15N and modern Δ15NCol-Bulk plant = 1.9 ‰.
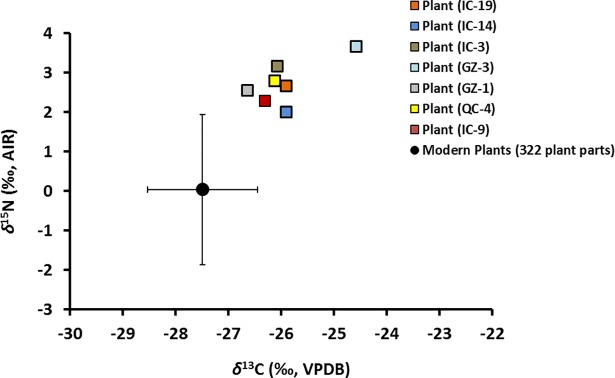
The fossil plant isotopic compositions were corrected for the effects of decomposition using the isotopic discrimination factors measured for modern bone collagen and plants (Δ13CCol-bulk plant and Δ15NCol-bulk plant). These discrimination factors were applied to the C- and N-isotope compositions of fossil bones collected from the same nests. Following this correction, the calculated average δ13C of the fossil plants is still higher than that of the modern plants (~1.5 ‰) (Fig 15), which can be explained for the most part by the Suess effect. The calculated average δ15N of the fossil plants is ~2.8 ‰ higher than modern plants from the region (Fig 15). This difference, we suggest, indicates that the food web δ15N baseline was higher in the Late Pleistocene than at present, which is consistent with a more open N cycle.
Fig 15. Values of δ15N vs. δ13C of plant macrofossils after correction for the isotopic effects of decomposition (squares).
The mean (filled circle) and range (whiskers) of δ15N and δ13C for modern plants from the region [9] are shown in black.
While plant tissues and bone collagen of the Late Pleistocene samples have higher δ15N than their modern equivalents, a similar pattern is not observed for loess. The average δ15N (~+4.1 ± 1.2 ‰; n = 8) of the Late Pleistocene loess is similar to that of modern equivalents (~+4.9 ± 1.6 ‰; n = 14) sampled from various depths at Kluane Lake [9]. Our data are insufficient to explain this similarity. Perhaps bulk sediment δ15N is not representative of bioavailable N [31]. Also, it is unknown if the ancient loess samples analyzed in this study had experienced weak pedogenesis. Position within a soil profile can exert a strong control on soil δ15N (e.g. [31, 33, 113]).
Another intriguing consideration is the role of biological soil crusts (BSC) in the N cycle in such grassland ecosystems [114, 115]. The abundance of lichen-dominated BSC in the Kluane Lake area, for example, has been suggested as the most likely source of new N addition to the soil [114]. BSE likely plays a very significant role in regulating the productivity of these grasslands at present. At Kluane Lake, for example, the N content of BSC is ~8-times higher than the underlying mineral soil [114]. As also reported by Marsh et al. [114], the BSC δ15N in the Kluane Lake area is significantly lower than the underlying mineral soil: +3.1±1.5 ‰ for the mineral soil versus +2.2±1.7 ‰ for bulk BSC in one set measurements, and –0.2±0.6 ‰ for upper BSC and +1.6±0.8 ‰ for lower BSC in a second set of measurements. The lower BSC δ15N signals atmospheric N fixation as the prevailing process responsible for this N. What remains to be learned in future research, however, is whether BSC was important during Beringian times.
The significant and continuous environmental changes that accompanied disappearance of large mammals at the terminal Pleistocene throughout the Holocene, together with rising atmospheric pCO2 that followed, could have led to a gradual shift in N dynamics in eastern Beringia. More isotopic data from fossil samples with a continuous chronology spanning Late Pleistocene to modern time in this region is required to further verify the results and interpretations presented here, and clarify the main triggers of the proposed N-isotope shift.
5 Conclusions
Comparison of δ15N and δ13C of fossil terrestrial plants and rodent bone collagen from Late Pleistocene, eastern Beringian localities in Yukon Territory with modern equivalents indicate a change in the C- and N-isotope food web baseline. The plant δ13C change is explained mostly by the Suess effect on modern samples. Higher δ15N of the plant macrofossils relative to modern equivalents reflect: (i) microbially mediated decomposition of fossil plants, and (ii) a different N dynamic in the Late Pleistocene than at present time in these parts of Yukon Territory.
Eastern Beringia was an important end-member of the now-vanished Mammoth Steppe. Increasingly, changes in the size, position and extent of overlap among the isotopic niches of the assemblage of Mammoth Steppe megaherbivores, as defined by δ13CCol and δ15NCol, are the tools of choice for inferring ecological changes over time in this now vanished megacontinental biome. Such analyses are then used to infer the climatic, anthropogenic or other processes that led to the Mammoth Steppe’s fragmentation and ultimate collapse–with attendant lessons for ecosystem destabilization during the current period of climate warming. Recognizing and then defining food web baseline shifts in δ15N and δ13C are a fundamental prerequisite to any such explanations of collagen stable isotopic data for Late Pleistocene megaherbivores from this region.
Supporting information
(DOCX)
(DOCX)
(DOCX)
Asimplified model for the “openness” of the N cycle in ecosystems with high (a) and low (b) N availability (from Tahmasebi et al. [9]).
(a): (a) N mineralization: Conversion of organic N to NH4+ (ε = 0–5 ‰); (b) Microbial assimilation: incorporation of NH4+ into microbial biomass (ε = 14–20 ‰); (c) NH3 volatilization: conversion of NH4+(aq) to NH3(g) (ε = 40–60 ‰); (d) Nitrification: conversion of NH4+ to NO3- (ε = 15–35 ‰); (e) Plant uptake and assimilation of NH4+ (ε = 9–18 ‰); (f) Plant uptake and assimilation of NO3- (ε = 0–19 ‰); (g) NO3- leaching (ε = 0–1 ‰); (h) Denitrification: conversion of NO3- to N2O, N2 and NO2 (ε = 28–33 ‰).(b): (a) N mineralization: Conversion of organic N to NH4+ (ε = 0–5 ‰); (b) Microbial assimilation: incorporation of NH4+ into microbial biomass (ε = 14–20 ‰); (c) Nitrification: conversion of NH4+ to NO3- (ε = 15–35 ‰); (d) Plant uptake and assimilation of NH4+ (ε = 9–18 ‰); (e) Plant uptake and assimilation of NO3- (ε = 0–19 ‰). Values of ε are from Robinson [29] and Houlton and Bai [105]).
(TIF)
Table A: Loess characteristics.
Table B: Loess mineralogy based on XRD.
(DOCX)
Table A: δ13C and δ15N for replicate analyses from the decomposition experiment.
Table B: C and N contents for replicate analyses from the decomposition experiment.
Table C: Atomic C/N of plant detritus during decomposition.
(DOCX)
Table A: Benferroni post hoc test for differences in average δ13Clitter between Day 1 and Days 164, 253 and 317 for samples showing significant time effect.
Table B: Benferroni post hoc test for differences in average δ15Nlitter between Day 1 and Days 164, 253 and 317 for samples showing significant time effect.
(DOCX)
Acknowledgments
We thank Kim Law, Li Huang and Tessa Plint of Laboratory for Stable Isotope Science at University of Western Ontario for technical assistance and Tessa Plint, Rachel Schwartz-Narbonne and Matthew Longstaffe for assistance with sampling. Modern bone samples were provided by Meghan Larivee from Animal Health Laboratory, Environment Yukon. Fossil nests were collected with the permission of the Yukon government paleontology program and Yukon First Nations (License No. 13-52S&E). Greg Hodgins and staff at the NSF Arizona AMS Laboratory performed the radiocarbon dating. Funding was provided by a Natural Sciences and Engineering Research Council of Canada (NSERC) Discovery Grant (FJL), an Ontario Graduate Scholarship (FT), the Canada Foundation for Innovation (FJL) and the Ontario Research Fund (FJL). Additional research time was provided through the Canada Research Chairs program (FJL). We also thank Paul Sanborn and Marina Suarez, and the PLOS ONE editorial team, for thoughtful suggestions for improvement of an earlier version of this manuscript. This is Laboratory for Stable Isotope Science Contribution # 343.
Data Availability
All relevant data are within the paper and its Supporting Information files.
Funding Statement
Funding was provided by a Natural Sciences and Engineering Research Council of Canada (NSERC) Discovery Grant (FJL), an Ontario Graduate Scholarship (FT), the Canada Foundation for Innovation (FJL) and the Ontario Research Fund (FJL). Additional research time was provided through the Canada Research Chairs program (FJL).
References
- 1.Koch PL, Barnosky AD. Late Quaternary extinctions: State of the debate. Annu Rev Ecol Evol S. 2006;37: 215–50. [Google Scholar]
- 2.Fritz M, Herzschuh U, Wetterich S, Lantuit H, De Pascale GP, Pollard WH, et al. Late glacial and Holocene sedimentation, vegetation, and climate history from easternmost Beringia (northern Yukon Territory, Canada). Quatern Res. 2012;78: 549–60. [Google Scholar]
- 3.Stuart AJ. Mammalian extinction in the late Pleistocene of Northern Eurasia and North America. Biol Rev. 1991;66: 453–562. [DOI] [PubMed] [Google Scholar]
- 4.Gill JL, Williams JW, Jackson ST, Lininger KB, Robinson GS. Pleistocene megafaunal collapse, novel plant communities, and enhanced fire regimes in North America. Science. 2009;326: 1100–3. doi: 10.1126/science.1179504 [DOI] [PubMed] [Google Scholar]
- 5.Petit JR, Jouzel J, Raynaud D, Barkov NI, Barnola J-M, Basile I, et al. Climate and atmospheric history of the past 420,000 years from the Vostok ice core, Antarctica. Nature. 1999;399: 429–36. [Google Scholar]
- 6.Pastor J, Cohen Y, Hobbs NT. The roles of large herbivores in ecosystem nutrient cycles In: Kjell D, Bergström R, Duncan P, Pastor J, editors. Large herbivore ecology, ecosystem dynamics and conservation editors. Cambridge University Press, Cambridge; 2006. pp. 298–324. [Google Scholar]
- 7.Faith JT. Late Pleistocene climate change, nutrient cycling, and the megafaunal extinctions in North America. Quat Sci Rev. 2011;30: 1675–80. [Google Scholar]
- 8.McLauchlan KK, Williams JJ, Craine JM, Jeffers ES. Changes in global nitrogen cycling during the Holocene epoch. Nature. 2013;495: 352–5. doi: 10.1038/nature11916 [DOI] [PubMed] [Google Scholar]
- 9.Tahmasebi F, Longstaffe FJ, Zazula G, Bennett B. Nitrogen and carbon isotopic dynamics of subarctic soils and plants in southern Yukon Territory and its implications for paleoecological and paleodietary studies. PLoS ONE. 2017;12: e0183016 doi: 10.1371/journal.pone.0183016 [DOI] [PMC free article] [PubMed] [Google Scholar]
- 10.Hietz P, Turner BL, Wanek W, Richter A, Nock CA, Wright SJ. Long-term change in the nitrogen cycle of tropical forests. Science. 2011;334: 664–6. doi: 10.1126/science.1211979 [DOI] [PubMed] [Google Scholar]
- 11.DeNiro M, Epstein S. Influence of diet on the distribution of nitrogen isotopes in animals. Geochim Cosmochim Acta. 1981;45: 341–51. [Google Scholar]
- 12.Fox-Dobbs K, Leonard JA, Koch PL. Pleistocene megafauna from eastern Beringia: Paleoecological and paleoenvironmental interpretations of stable carbon and nitrogen isotope and radiocarbon records. Palaeogeogr, Palaeoclimatol, Palaeoecol. 2008;261: 30–46. [Google Scholar]
- 13.Drucker DG, Bocherens H, Billiou D. Evidence for shifting environmental conditions in Southwestern France from 33 000 to 15 000 years ago derived from carbon-13 and nitrogen-15 natural abundances in collagen of large herbivores. Earth Planet Sci Lett. 2003;216: 163–73. [Google Scholar]
- 14.Drucker DG, Bridault A, Iacumin P, Bocherens H. Bone stable isotopic signatures (15N,18O) as tracers of temperature variation during the Late-glacial and early Holocene: case study on red deer Cervus elaphus from Rochedane (Jura, France). Geol J. 2009;44: 593–604. [Google Scholar]
- 15.Iacumin P, Nikolaev V, Ramigni M. C and N stable isotope measurements on Eurasian fossil mammals, 40 000 to 10 000 years BP: Herbivore physiologies and palaeoenvironmental reconstruction. Palaeogeogr, Palaeoclimatol, Palaeoecol. 2000;163: 33–47. [Google Scholar]
- 16.Richards MP, Hedges REM. Variations in bone collagen δ13C and δ15N values of fauna from Northwest Europe over the last 40 000 years. Palaeogeogr, Palaeoclimatol, Palaeoecol. 2003;193: 261–7. [Google Scholar]
- 17.Stevens RE, Hedges REM. Carbon and nitrogen stable isotope analysis of northwest European horse bone and tooth collagen, 40,000BP–present: Palaeoclimatic interpretations. Quat Sci Rev. 2004;23: 977–91. [Google Scholar]
- 18.Stevens RE, Jacobi R, Street M, Germonpré M, Conard NJ, Münzel SC, et al. Nitrogen isotope analyses of reindeer (Rangifer tarandus), 45,000 BP to 9,000 BP: Palaeoenvironmental reconstructions. Palaeogeogr, Palaeoclimatol, Palaeoecol. 2008;262: 32–45. [Google Scholar]
- 19.Billings SA, Schaeffer SM, Evans RD. Soil microbial activity and N availability with elevated CO2 in Mojave Desert soils. Global Biogeochem Cycles. 2004;18: GB1011. [Google Scholar]
- 20.Craine JM, Elmore AJ, Aidar MPM, Bustamante M, Dawson TE, Hobbie EA, et al. Global patterns of foliar nitrogen isotopes and their relationships with climate, mycorrhizal fungi, foliar nutrient concentrations, and nitrogen availability. New Phytol. 2009;183: 980–92. doi: 10.1111/j.1469-8137.2009.02917.x [DOI] [PubMed] [Google Scholar]
- 21.Wolf B, Zheng X, Brüggemann N, Chen W, Dannenmann M, Han X, et al. Grazing-induced reduction of natural nitrous oxide release from continental steppe. Nature. 2010;464: 881–4. doi: 10.1038/nature08931 [DOI] [PubMed] [Google Scholar]
- 22.Szpak P, White CD, Longstaffe FJ, Millaire J-F, Sanchez VFV. Carbon and nitrogen isotopic survey of Northern Peruvian plants: Baselines for paleodietary and paleoecological studies. PLoS ONE. 2013;8: e53763 doi: 10.1371/journal.pone.0053763 [DOI] [PMC free article] [PubMed] [Google Scholar]
- 23.Guthrie RD. Mammals of the Mammoth Steppe as plaeoenvironmental indicator In: Hopkins DM, Matthews JV, Schweger CE, editors. Paleoecology of Beringia. Academic Press; A Subsidiary of Harcourt Brace Jovanovich, Publishers; 1982. pp. 307–26. [Google Scholar]
- 24.Hoffecker JF, Elias SA, O'Rourke DH. Out of Beringia? Science. 2014;343: 979–80. doi: 10.1126/science.1250768 [DOI] [PubMed] [Google Scholar]
- 25.Guthrie RD. Fozen fauna of the Mammoth Steppe, The story of Blue Babe The University of Chicago Press; 1990. [Google Scholar]
- 26.Höfle C, Edwards ME, Hopkins DM, Mann DH, Ping C-L. The full-glacial environment of the Northern Seward Peninsula, Alaska, reconstructed from the 21,500-Year-Old Kitluk Paleosol. Quatern Res. 2000;53: 143–53. [Google Scholar]
- 27.Williams JW, Shuman BN, Webb T. Dissimilarity analyses of late-Quaternary vegetation and climate in eastern North America. Ecology. 2001;82: 3346–62. [Google Scholar]
- 28.MacDonald GM, Beilman DW, Kuzmin YV, Orlova LA, Kremenetski KV, Shapiro B, et al. Pattern of extinction of the woolly mammoth in Beringia. Nature Communications. 2012;3: 893 doi: 10.1038/ncomms1881 [DOI] [PMC free article] [PubMed] [Google Scholar]
- 29.Robinson D. δ15N as an integrator of the nitrogen cycle. TRENDS Ecol Evol. 2001;16: 153–62. [DOI] [PubMed] [Google Scholar]
- 30.Reichmann LG, Sala OE, Peters DPC. Water controls on nitrogen transformations and stocks in an arid ecosystem. Ecosphere. 2013;4: UNSP11. [Google Scholar]
- 31.Högberg P. 15N natural abundance in soil-plant systems. New Phytol. 1997;137: 179–203. [DOI] [PubMed] [Google Scholar]
- 32.Amundson R. Global patterns of the isotopic composition of soil and plant nitrogen. Global Biogeochem Cycles. 2003;17: 1031. [Google Scholar]
- 33.Makarov MI, Malysheva TI, Cornelissen JHC, van Logtestijn RSP, Glasser B. Consistent patterns of 15N distribution through soil profiles in diverse alpine and tundra ecosystems. Soil Biol Biochem. 2008;40: 1082–9. [Google Scholar]
- 34.Tieszen LL. Natural variations in the carbon isotope values of plants: Implications for archeology, ecology, and paleoecology. J Archaeol Sci. 1991;18: 227–48. [Google Scholar]
- 35.Kohn MJ. Carbon isotope compositions of terrestrial C3 plants as indicators of (paleo)ecology and (paleo)climate. P Natl Acad Sci USA. 2010;107: 19691–5. [DOI] [PMC free article] [PubMed] [Google Scholar]
- 36.Farquhar GD, Ehleringer JR, Hubick KT. Carbon isotope discrimination and photosysnthesis. Annu Rev Plant Physiol Plant Mol Biol. 1989;40: 503–37. [Google Scholar]
- 37.Wooller MJ, Zazula GD, Edwards M, Froese DG, Boone RD, Parker C, et al. Stable carbon isotope compositions of eastern Beringian grasses and sedges: Investigating their potential as paleoenvironmental indicators. AAAR. 2007;39: 318–31. [Google Scholar]
- 38.Van de Water PK, Leavitt SW, Betancourt JL. Trends in stomatal density and 13C/12C ratios of Pinus flexilis needles during Last Glacial-Interglacial cycle. Science. 1994;264: 239–43. doi: 10.1126/science.264.5156.239 [DOI] [PubMed] [Google Scholar]
- 39.Keeling CD. The Suess effect: 13Carbon-14Carbon interrelations. Environ Int. 1979;2: 229–300. [Google Scholar]
- 40.White JWC, Vaughn BH, Michel S. Stable isotopic composition of atmospheric carbon dioxide (13C and 18O) from the NOAA ESRL Carbon Cycle Cooperative Global Air Sampling Network, 1990–2012, Version: 2013-04-05 University of Colorado, Institute of Arctic and Alpine Research (INSTAAR) ftp cmdl noaa gov/ccg/co2c13/flask/event/, (last access 21 September 2012). 2011. [Google Scholar]
- 41.Andreeva DB, Zech M, Glaser B, Erbajeva MA, Chimitdorgieva GD, Ermakova OD, et al. Stable isotope (δ13C, δ15N, δ18O) record of soils in Buryatia, southern Siberia: Implications for biogeochemical and paleoclimatic interpretations. Quat Int. 2013;290–291: 82–94. [Google Scholar]
- 42.Freitas HAd, Pessenda LCR, Aravena R, Gouveia SEM, Ribeiro AdS, Boulet R. Late Quaternary vegetation dynamics in the Southern Amazon basin inferred from carbon isotopes in soil organic matter. Quatern Res. 2001;55: 39–46. [Google Scholar]
- 43.Francisquini MI, Lima CM, Pessenda LCR, Rossetti DF, França MC, Cohen MCL. Relation between carbon isotopes of plants and soils on Marajó Island, a large tropical island: Implications for interpretation of modern and past vegetation dynamics in the Amazon region. Palaeogeogr, Palaeoclimatol, Palaeoecol. 2014;415: 91–104. [Google Scholar]
- 44.Van Der Merwe NJ. Carbon isotopes, photosynthesis, and archaeology: Different pathways of photosynthesis cause characteristic changes in carbon isotope ratios that make possible the study of prehistoric human diets. Am Sci. 1982;70: 596–606. [Google Scholar]
- 45.Lee-Thorp JA, Scaly JC, MerweaJb NJvd. Stable carbon isotope ratio differences between bone collagen and bone apatite, and their relationship to diet. J Archaeol Sci. 1989;16: 585–99. [Google Scholar]
- 46.Koch PL, Fogel ML, Tuross N. Tracing the diet of fossil animals using stable isotopes. In: Michener RH, Lajtha K, editors. Stable Isotopes in Ecology and Environmental Science. 1994. pp. 63–92. [Google Scholar]
- 47.Ambrose SH. Controlled diet and climate experiments on nitrogen isotope ratios of rats In: Ambrose SH, Katzenberg MA, editors. Biogeochemical approaches to paleodietary analysis. Springer, Boston, MA; 2002. pp. 243–59. [Google Scholar]
- 48.Bocherens H, Drucker D. Trophic level isotopic enrichment of carbon and nitrogen in bone collagen: Case studies from recent and ancient terrestrial ecosystems. Int J Osteoarchaeol. 2003;13: 46–53. [Google Scholar]
- 49.Ambrose SH, Norr L. Experimental evidence for the relationship of the carbon isotope ratios of whole diet and dietary protein to those of bone collagen and carbonate In: Lambert JB, Grupe G, editors. Prehistoric human bone, archaeology at the molecular level. Springer-Verlag Berlin Heidelberg; 1993. pp. 1–37. [Google Scholar]
- 50.Jim S, Ambrose SH, Evershed RP. Stable carbon isotopic evidence for differences in the dietary origin of bone cholesterol, collagen and apatite: Implications for their use in palaeodietary reconstruction. Geochim Cosmochim Acta. 2004;68: 61–72. [Google Scholar]
- 51.Krueger HW, Sullivan CH. Models for carbon isotope fractionation between diet and bone In: Turnlund JR, Jhonson PE, editors. Stable isotopes in nutrition. Cambridge: American Chemical Society; 1984. pp. 205–20. [Google Scholar]
- 52.Hedges REM. On bone collagen-apatite-carbonate isotopic relationships. Int J Osteoarchaeol. 2003;13: 66–79. [Google Scholar]
- 53.Krull ES, Bestland EA, Gates WP. Soil organic matter decomposition and turnover in a tropical Ultisol: Evidence from δ13C, δ15N and Ggeochemistry. Radiocarbon. 2002;44: 93–112. [Google Scholar]
- 54.Kramer MG, Sollins P, Sletten RS, Swart PK. N Isotope fractionation and measures of organic matter alteration during decomposition. Ecology. 2003;84: 2021–5. [Google Scholar]
- 55.Wynn JG, Harden JW, Fries TL. Stable carbon isotope depth profiles and soil organic carbon dynamics in the lower Mississippi Basin. Geoderma. 2006;131: 89–109. [Google Scholar]
- 56.Wang G, Feng X, Han J, Zhou L, Tan W, Su F. Paleovegetation reconstruction using δ13C of soil organic matter. Biogeosciences. 2008;5: 1325–37. [Google Scholar]
- 57.Schweizer M, Fear J, Cadisch G. Isotopic (13C) fractionation during plant residue decomposition and its implications for soil organic matter studies. Rapid Commun Mass Spectrom. 1999;13: 1284–90. doi: 10.1002/(SICI)1097-0231(19990715)13:13<1284::AID-RCM578>3.0.CO;2-0 [DOI] [PubMed] [Google Scholar]
- 58.Dijkstra P, Ishizu A, Doucett R, Hart SC, Schwartz E, Menyailo OV, et al. 13C and 15N natural abundance of the soil microbial biomass. Soil Biol Biochem. 2006;38: 3257–66. [Google Scholar]
- 59.Fernandez I, Cadisch G. Discrimination against13C during degradation of simple and complex substrates by two white rot fungi. Rapid Commun Mass Spectrom. 2003;17: 2614–20. doi: 10.1002/rcm.1234 [DOI] [PubMed] [Google Scholar]
- 60.Gleixner C, Danier H-J, Werner RA, Schmid H-L. Correlations between the 13C content of primary and secondary plant products in different cell compartments and that in decomposing basidiomycetes. Plant Physiol. 1993;102: 1287–90. [DOI] [PMC free article] [PubMed] [Google Scholar]
- 61.Lerch TZ, Nunan N, Dignac MF, Chenu C, Mariotti A. Variations in microbial isotopic fractionation during soil organic matter decomposition. Biogeochemistry. 2010;106: 5–21. [Google Scholar]
- 62.Wallander H, Nilsson LO, Hagerberg D, Rosengren U. Direct estimates of C:N ratios of ectomycorrhizal mycelia collected from Norway spruce forest soils. Soil Biol Biochem. 2003;35: 997–9. [Google Scholar]
- 63.Huang Y, Bol R, Harkness DD, Ineson P, Eglinton G. Post-glacial variations in distributions, 13C and 14C contents of aliphatic hydrocarbons and bulk organic matter in three types of British acid upland soils. Org Geochem. 1996;24: 273–87. [Google Scholar]
- 64.Benner R, Hatcher PG, Hedges JI. Early diagenesis of mangrove leaves in a tropical estuary: Bulk chemical characterization using solid-state 13C NMR and elemental analyses. Geochim Cosmochim Acta. 1990;54: 2003–13. [Google Scholar]
- 65.Boström B, Comstedt D, Ekblad A. Isotope fractionation and 13C enrichment in soil profiles during the decomposition of soil organic matter. Oecologia. 2007;153: 89–98. doi: 10.1007/s00442-007-0700-8 [DOI] [PubMed] [Google Scholar]
- 66.Connina SL, Fengb X, Virginiac RA. Isotopic discrimination during long-term decomposition in an arid land ecosystem. Soil Biol Biochem. 2001;33: 41–51. [Google Scholar]
- 67.Salazar S, Sánchez L-E, Galindo P, Santa-Regina I. Long-term decomposition process of the leaf litter, carbon and nitrogen dynamics under different forest management in the Sierra de Francia, Salamanca, Spain. J Agr Sci Technol. 2012;2: 312–28. [Google Scholar]
- 68.Zazula GD, Froese DG, Elias SA, Kuzmina S, Mathewes RW. Arctic ground squirrels of the mammoth-steppe: Paleoecology of late Pleistocene middens (24000–29450 14C yr BP), Yukon Territory, Canada. Quat Sci Rev. 2007;26: 979–1003. [Google Scholar]
- 69.Dearing MD. The manipulation of plant toxins by a food-hoarding herbivore, Ochotona princeps. Ecological Society of America. 1997;78: 774–81. [Google Scholar]
- 70.Price PB, Sowers T. Temperature dependence of metabolic rates for microbial growth, maintenance, and survival. P Natl Acad Sci USA. 2004;101: 4631–6. [DOI] [PMC free article] [PubMed] [Google Scholar]
- 71.Froese DG, Zazula GD, Westgate JA, Preece SJ, Sanborn PT, Reyes AV, et al. The Klondike goldfields and Pleistocene environments of Beringia. GSA Today. 2009;19: 4. [Google Scholar]
- 72.Harington CR. Pleistocene vertebrates of the Yukon Territory. Quat Sci Rev. 2011;30: 2341–54. [Google Scholar]
- 73.Fraser TA, Burn CR. On the nature and origin of "muck" deposits in the Klondike areas Yukon Territory. Can J Earth Sci. 1997;34: 1333–44. [Google Scholar]
- 74.Sanborn PT, Smith CAS, Froese DG, Zazula GD, Westgate JA. Full-glacial paleosols in perennially frozen loess sequences, Klondike goldfields, Yukon Territory, Canada. Quatern Res. 2006;66: 147–57. [Google Scholar]
- 75.Zazula GD, Froese DG, Westgate JA, La Farge C, Mathewes RW. Paleoecology of Beringian “packrat” middens from central Yukon Territory, Canada. Quatern Res. 2005;63: 189–98. [Google Scholar]
- 76.Zazula GD, Froese DG, Elias SA, Kuzmina S, Mathewes RW. Early Wisconsinan (MIS 4) Arctic ground squirrel middens and a squirrel-eye-view of the mammoth-steppe. Quat Sci Rev. 2011;30: 2220–37. [Google Scholar]
- 77.Kotler E, Burn CR. Cryostratigraphy of the Klondike “muck” deposits, west-central Yukon Territory. Can J Earth Sci. 2000;37: 849–61. [Google Scholar]
- 78.Froese DG, Zazula GD, Reyes AV. Seasonality of the late Pleistocene Dawson tephra and exceptional preservation of a buried riparian surface in central Yukon Territory, Canada. Quat Sci Rev. 2006;25: 1542–51. [Google Scholar]
- 79.Westgate JA, Preece SJ, Froese DG, Pearce NJG, Roberts RG, Demuro M, et al. Changing ideas on the identity and stratigraphic significance of the Sheep Creek tephra beds in Alaska and the Yukon Territory, northwestern North America. Quat Int. 2008;178: 183–209. [Google Scholar]
- 80.Zazula GD, Froese DG, Schweger CE, Mathewes RW, Beaudoin AB, Telka AM, et al. Ice-age steppe vegetation in east Beringia. Nature. 2003;423: 603 doi: 10.1038/423603a [DOI] [PubMed] [Google Scholar]
- 81.Laxton NF, Burn CR, Smith CAS. Productivity of loessal grasslands in the Kluane Lake region, Yukon Territory, and the Beringian “Production Paradox”. Arctic. 1996;49: 129–40. [Google Scholar]
- 82.Vetter MA. Grasslands of the Aishihik-Sekulmun Lakes Area, Yukon Territory, Canada. Aerctic. 2000;165–73. [Google Scholar]
- 83.Zazula GD, Schweger CE, Beaudoin AB, McCourt GH. Macrofossil and pollen evidence for full-glacial steppe within an ecological mosaic along the Bluefish River, eastern Beringia. Quat Int. 2006;142–143: 2–19. [Google Scholar]
- 84.Zazula GD, Froese DG, Elias SA, Kuzmina S, La Farge C, Reyes AV, et al. Vegetation buried under Dawson tephra (25,300 14C years BP) and locally diverse late Pleistocene paleoenvironments of Goldbottom Creek, Yukon, Canada. Palaeogeogr, Palaeoclimatol, Palaeoecol. 2006;242: 253–86. [Google Scholar]
- 85.Metcalfe JZ, Longstaffe FJ, Zazula GD. Nursing, weaning, and tooth development in woolly mammoths from Old Crow, Yukon, Canada: Implications for Pleistocene extinctions. Palaeogeogr, Palaeoclimatol, Palaeoecol. 2010;298: 257–70. [Google Scholar]
- 86.Webb EC, White CD, Longstaffe FJ. Investigating inherent differences in isotopic composition between human bone and enamel bioapatite: implications for reconstructing residential histories. J Archaeol Sci. 2014;50: 97–107. [Google Scholar]
- 87.Metcalfe JZ, Longstaffe FJ, White CD. Method-dependent variations in stable isotope results for structural carbonate in bone bioapatite. J Archaeol Sci. 2009;36: 110–21. [Google Scholar]
- 88.Harris D, Horwath WR, Kessel Cv. Acid fumigation of soils to remove carbonates prior to total organic carbon or carbon-13 isotopic analysis. Soil Sci Soc Am J. 2001;65: 1853–6. [Google Scholar]
- 89.Coplen TB. Guidelines and recommended terms for expression of stable isotope-ratio and gas-ratio measurement results. Rapid Commun Mass Spectrom. 2011;25: 2538–60. [DOI] [PubMed] [Google Scholar]
- 90.Qi H, Coplen TB, Geilmann H, Brand WA, Bohlke JK. Two new organic reference materials for δ13C and δ15N measurements and a new value for the δ13C of NBS 22 oil. Rapid Commun Mass Spectrom. 2003;17: 2483–7. doi: 10.1002/rcm.1219 [DOI] [PubMed] [Google Scholar]
- 91.Coplen TB, Brand WA, Gehre M, Groning M, Meijer HAJ, Toman B, et al. New guidelines for δ13C measurements. Anal Chem. 2006;78: 2439–41. doi: 10.1021/ac052027c [DOI] [PubMed] [Google Scholar]
- 92.Wooller MJ, Zazula GD, Blinnikov M, Gaglioti BV, Bigelow NH, Sanborn P, et al. The detailed palaeoecology of a mid-Wisconsinan interstadial (ca. 32,000 14C a BP) vegetation surface from interior Alaska. J Quat Sci. 2011;26: 746–56. [Google Scholar]
- 93.DeNiro MD. Postmortem preservation and alteration of in vivo bone collagen isotpe ratios in relation to paleodietary reconstruction. Nature. 1985;317: 806–9. [Google Scholar]
- 94.Shemesh A. Crystallinity and diagenesis of sedimentary apatites. Geochim Cosmochim Acta. 1990;54: 2433–8. [Google Scholar]
- 95.Wright LE, Schwarcz HP. Infrared and isotopic evidence for diagenesis of bone apatite at Dos Pilas, Guatemala: Palaeodietary implications. J Archaeol Sci. 1996;23: 933–44. [Google Scholar]
- 96.Herman WA, McGill WB, Dormaar JF. Effects of initial chemical composition on decomposition of roots of three grass species. Can J Soil Sci. 1976;57: 205–15. [Google Scholar]
- 97.Singh JS, Gupta SR. Plant decomposition and soil respiration in terrestrial ecosystems. Bot Rev. 1977;43: 449–528. [Google Scholar]
- 98.Spiers GA, Gagnon D, Nason GE, Packee EC, Lousier JD. Effects and importance of indigenous earthworms on decomposition and nutrient cycling in coastal forest ecosystems Can J For Res. 1986;16: 983–9. [Google Scholar]
- 99.Wardle DA, Bonner KI, Barker GM. Linkages between plant litter decomposition, litter quality, and vegetation responses to herbivores. Funct Ecol. 2002;16: 585–95. [Google Scholar]
- 100.Fahey TJ, Yavitt JB, Sherman RE, Maerz JC, Groffman PM, Fisk MC, et al. Earthworm effects on the incorporation of litter C and N into soil organic matter in a sugar maple forest. Ecol Appl. 2013;23: 1185–201. [DOI] [PubMed] [Google Scholar]
- 101.Wardle DA, Nilsson M-C, Zackrisson O, Gallet C. Determinants of litter mixing effects in a Swedish boreal forest. Soil Biol Biochem. 2003;35: 827–35. [Google Scholar]
- 102.Lopes-Lutz D, Alviano DS, Alviano CS, Kolodziejczyk PP. Screening of chemical composition, antimicrobial and antioxidant activities of Artemisia essential oils. Phytochemistry. 2008;69: 1732–8. doi: 10.1016/j.phytochem.2008.02.014 [DOI] [PubMed] [Google Scholar]
- 103.Talley SM, Coley PD, Kursar TA. Antifungal leaf-surface metabolites correlate with fungal abundance in sagebrush populations. J Chem Ecol. 2002;28: 2141–68. [DOI] [PubMed] [Google Scholar]
- 104.Pardo F, Gil L, Pardos JA. Field study of beech (Fagus sylvatica L.) and melojo oak (Quercus pyrenaica Willd) leaf litter decomposition in the centre of the Iberian Peninsula. Plant Soil. 1997;191: 89–100. [Google Scholar]
- 105.Houlton BZ, Bai E. Imprint of denitrifying bacteria on the global terrestrial biosphere. P Nat Aca Sci USA. 2009;106: 21713–6. [DOI] [PMC free article] [PubMed] [Google Scholar]
- 106.Dijkstra P, LaViolette CM, Coyle JS, Doucett RR, Schwartz E, Hart SC, et al. 15N enrichment as an integrator of the effects of C and N on microbial metabolism and ecosystem function. Ecol Lett. 2008;11: 389–97. doi: 10.1111/j.1461-0248.2008.01154.x [DOI] [PubMed] [Google Scholar]
- 107.Muhs DR III EAB. Quaternary loess-paleosol sequences as examples of climate-driven sedimentary extremes In: Chan MA, Archer AW, editors. Extreme Depositional Environments: Mega End Members in Geologic Time. Boulder, Colorado: Geological Sociaty of America Special; Paper 370; 2003. pp. 53–74. [Google Scholar]
- 108.Gaglioti BV, Barnes BM, Zazula GD, Beaudoin AB, Wooller MJ. Late Pleistocene paleoecology of arctic ground squirrel (Urocitellus parryii) caches and nests from Interior Alaska's mammoth steppe ecosystem, USA. Quatern Res. 2011;76: 373–82. [Google Scholar]
- 109.Bocherens H, Drucker DG, Bonjean D, Bridault A, Conard NJ, Cupillard C, et al. Isotopic evidence for dietary ecology of cave lion (Panthera spelaea) in North-Western Europe: Prey choice, competition and implications for extinction. Quat Int. 2011;245: 249–61. [Google Scholar]
- 110.DeNiro MJ, Epstein S. Influence of diet on the distribution of carbon isotopes in animals. Geochim Cosmochim Acta. 1978;42: 495–506. [Google Scholar]
- 111.Welsh SL. Anderson's flora of Alaska and adjacent parts of Canada Provo: Brigham Young University Press; xvi, 724p. Illustrations, portrait, map. 1974. [Google Scholar]
- 112.Dittberner P, Olson MR. The plant information network (PIN) data base: Colorado, Montana, North Dakota, Utah, and Wyoming Washington, DC: U.S. Department of the Interior, Fish and Wildlife Service, 786 1983. [Google Scholar]
- 113.Martinelli LA, Piccolo MC, Townsend AR, Vitousek PM, Cuevas E, McDowell W, et al. Nitrogen stable isotopic composition of leaves and soil: Tropical versus temperate forests. Biogeochemistry. 1999;46: 45–65. [Google Scholar]
- 114.Marsh J, Nouvet S, Sanborn P, Coxson D. Composition and function of biological soil crust communities along topographic gradients in grasslands of central interior British Columbia (Chilcotin) and southwestern Yukon (Kluane). Can J Bot. 2006;84: 717–36. [Google Scholar]
- 115.Caputa K, Coxson D, Sanborn P. Seasonal patterns of nitrogen fixation in biological soil crusts from British Columbia’s Chilcotin grasslands. Botany. 2013;91: 631–41. [Google Scholar]
Associated Data
This section collects any data citations, data availability statements, or supplementary materials included in this article.
Supplementary Materials
(DOCX)
(DOCX)
(DOCX)
Asimplified model for the “openness” of the N cycle in ecosystems with high (a) and low (b) N availability (from Tahmasebi et al. [9]).
(a): (a) N mineralization: Conversion of organic N to NH4+ (ε = 0–5 ‰); (b) Microbial assimilation: incorporation of NH4+ into microbial biomass (ε = 14–20 ‰); (c) NH3 volatilization: conversion of NH4+(aq) to NH3(g) (ε = 40–60 ‰); (d) Nitrification: conversion of NH4+ to NO3- (ε = 15–35 ‰); (e) Plant uptake and assimilation of NH4+ (ε = 9–18 ‰); (f) Plant uptake and assimilation of NO3- (ε = 0–19 ‰); (g) NO3- leaching (ε = 0–1 ‰); (h) Denitrification: conversion of NO3- to N2O, N2 and NO2 (ε = 28–33 ‰).(b): (a) N mineralization: Conversion of organic N to NH4+ (ε = 0–5 ‰); (b) Microbial assimilation: incorporation of NH4+ into microbial biomass (ε = 14–20 ‰); (c) Nitrification: conversion of NH4+ to NO3- (ε = 15–35 ‰); (d) Plant uptake and assimilation of NH4+ (ε = 9–18 ‰); (e) Plant uptake and assimilation of NO3- (ε = 0–19 ‰). Values of ε are from Robinson [29] and Houlton and Bai [105]).
(TIF)
Table A: Loess characteristics.
Table B: Loess mineralogy based on XRD.
(DOCX)
Table A: δ13C and δ15N for replicate analyses from the decomposition experiment.
Table B: C and N contents for replicate analyses from the decomposition experiment.
Table C: Atomic C/N of plant detritus during decomposition.
(DOCX)
Table A: Benferroni post hoc test for differences in average δ13Clitter between Day 1 and Days 164, 253 and 317 for samples showing significant time effect.
Table B: Benferroni post hoc test for differences in average δ15Nlitter between Day 1 and Days 164, 253 and 317 for samples showing significant time effect.
(DOCX)
Data Availability Statement
All relevant data are within the paper and its Supporting Information files.


