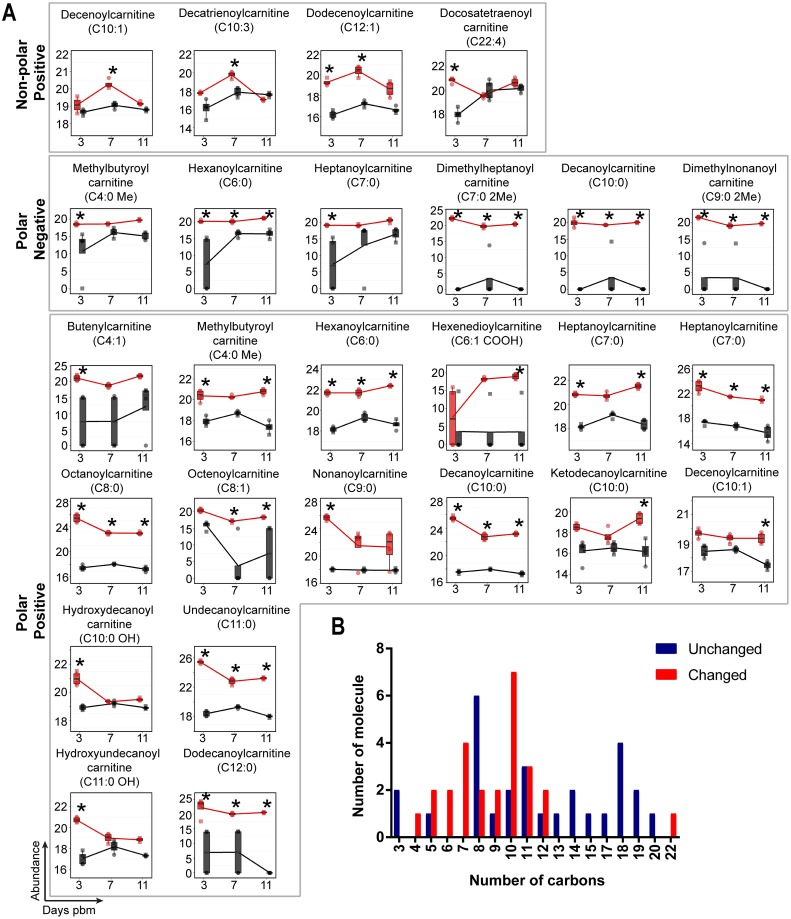
Fig 8. Acyl-carnitines accumulate in mosquito midguts during DENV infection.
(A) Molecules showing differential abundance after DENV infection. Numbers of carbons in the fatty acyl chains are indicated in parentheses. The abundance of metabolites detected in DENV-infected samples is shown in red and uninfected samples in black. Individual sample pools are represented by circles and squares and technical replicates are dots with the same symbol. Asterisks (*) indicates significantly different abundance between DENV-infected and uninfected samples (|log2 fold change| ≥ 1, p < 0.05). (B) Bar graph showing numbers of detected acyl-carnitine molecules corresponding to the numbers of carbons in the acyl-chains. Red bars indicate molecules with significantly altered abundances while blue bars indicate molecules that remained unaltered during DENV infection.

