Abstract
The rapid and accurate quantification of peptides is a critical element of modern proteomics that has become increasingly challenging as proteomic data sets grow in size and complexity. We present here FlashLFQ, a computer program for high-speed label-free quantification of peptides following a search of bottom-up mass spectrometry data. FlashLFQ is approximately an order of magnitude faster than established label-free quantification methods. The increased speed makes it practical to base quantification upon all of the charge states for a given peptide rather than solely upon the charge state that was selected for MS2 fragmentation. This increases the number of quantified peptides, improves replicate-to-replicate reproducibility, and increases quantitative accuracy. We integrated FlashLFQ into the graphical user interface of the MetaMorpheus search software, allowing it to work together with the global post-translational modification discovery (G-PTM-D) engine to accurately quantify modified peptides. FlashLFQ is also available as a NuGet package, facilitating its integration into other software, and as a standalone command line software program for the quantification of search results from other programs (e.g., MaxQuant).
Keywords: label-free quantification, post-translational modifications, quantitative proteomics, software
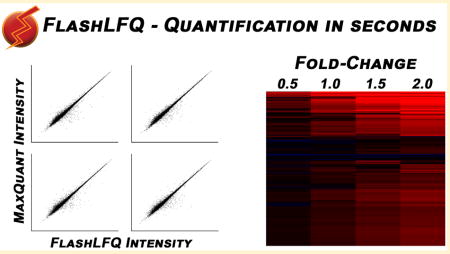
Graphical abstract
INTRODUCTION
The goal of quantitative proteomics is to identify and quantify all proteins present in any given sample.1 In a typical bottom-up proteomics experiment, a complex mixture of proteins is digested by a protease into peptides that are separated by liquid chromatography (LC) and analyzed by a mass spectrometer. The resulting mass spectrum (MS1) contain mass-to-charge (m/z) values and ion intensities for all eluting ionized species within the mass spectrometer’s measurable range; some of these ions are selected for fragmentation and are identified by their fragmentation (MS2) spectra. In these experiments, MS1 ion intensity is commonly used as a proxy for peptide quantity; this is in contrast with label-based quantification methods, in which peptides are chemically derivatized prior to LC–MS/MS analysis and reporter ions resulting from fragmentation are used for quantification. Regardless of the quantification method, peptides’ intensities are normalized across runs and combined2,3 according to the rules of parsimony4,5 to estimate protein abundance. MS1 intensity-based label-free quantification (LFQ) methods are convenient, inexpensive, and accurate,6 with both free and commercial software packages such as MaxQuant,7 moFF,8 and others9 available. However, analysis in MaxQuant and other programs often takes several minutes or even hours per file. Large data sets, often numbering in the hundreds of files, can be excessively computationally intensive and time-consuming to analyze.
Indexing, which categorizes information into lookup-tables according to its properties, has been shown10 to increase the speed of such analyses. The Nesvizhskii group recently reported the use of indexing11 to dramatically increase the speed of peptide-spectral matching (peptide identification) in searches with large allowed precursor mass tolerances (“open-mass” search12) by generating a list of theoretical peptide fragment ions from an in-silico-digested protein database input and searching each experimental MS2 ion against all indexed fragment ions simultaneously. We report here a similar strategy for peptide quantification, in which an index of m/z values is calculated from identified peptides’ monoisotopic masses across a range of charge states. Each MS1 mass spectral peak in the raw data file is stored in the lookup-table according to its m/z if it matches an identification’s m/z.
This approach yields extremely rapid mass spectral peak assignments, the speed being effectively determined by the number of peaks in a raw data file (i.e., the number of lookups to be performed). The algorithm is enabled by delaying chromatographic peak detection and quantification until MS2 spectra have already been matched to peptide identifications. We present FlashLFQ as an open-source implementation of this strategy (code available at https://github.com/smith-chem-wisc/FlashLFQ).
FlashLFQ detects and quantifies chromatographic peaks and reports either apex or integrated intensity of each peak. Its modular nature and speed allow it to easily integrate new developments in peptide identification (e.g., data-independent acquisition13 or Global Post-Translational Modification Discovery (G-PTM-D)14). Its open-source indexing engine can also be readily adapted to improve the speed of other quantification software (e.g., MaxQuant, or other search software that peak-finds using m/z values selected for fragmentation prior to peptide-spectral matching). FlashLFQ is available as either a standalone utility (to provide a quantification engine to peptide search programs that lack one) or integrated into the MetaMorpheus software suite (https://github.com/smith-chem-wisc/MetaMorpheus), which allows the rapid and reliable identification of PTM-containing peptides and proteins using a built-in G-PTM-D search function. Both programs make extensive use of mzLib (https://github.com/smith-chem-wisc/mzLib), an open-source library of useful tools for mass-spectrometry proteomics, such as raw data file and protein database reading.
EXPERIMENTAL PROCEDURES
All searches were performed on a Dell Precision Tower 5810 desktop computer with a six-core, 12-thread Xeon 3.60 GHz processor and 31.9 GB of RAM.
The benchmark data set of human Panc-1 mixed with DH5α E. coli was obtained from ProteomeXchange (data set identifier PXD005590).15 The data set contains 20 files of four replicates each of five different amounts (2, 3, 4, 5, or 6% by weight, representing a 1-, 1.5-, 2-, 2.5-, or 3-fold addition) of E. coli digest added to a constant amount of human digest.
Parameters used for each software package were:
FlashLFQ
Version 0.1.61 was used for all analyses. Either the precursor charge state for each peptide-spectrum match was used for peak-finding or a charge-state range of 1 to 6 for each peptide was used, where indicated; mass tolerance was set to 5 ppm.
MaxQuant
Version 1.6.0.1 was used for all searches; label-free quantification was enabled; “Skip Normalization” was checked; oxidation of methionine was set as a variable modification; carbamidomethylation of cysteine was set as fixed modification; two missed cleavages were allowed; precursor tolerance was set to 4.5 ppm; fragment tolerance was set to 0.01 Da; and number of threads was set to 1 (see Results and Discussion). All other parameters were left as default.
Perseus
Version 1.6.0.2 was used for all analyses. Normalized intensities of each peptide across all 20 files (either from FlashLFQ or MaxQuant) were imported into Perseus as a tab-delimited text file for statistical analysis. Peptides that were not quantified in all replicates of at least one condition were removed. Intensities were log2-transformed, and missing values were imputed from a normal distribution of the total matrix (width 0.5, down shift 1.5); 12% of all intensity values were imputed in both FlashLFQ and MaxQuant analyses. A two-tailed, two-sample t test (n = 4) using a 5% Benjamini–Hochberg FDR cutoff was performed for each condition in comparison with the 1-fold E. coli addition condition to determine statistical significance of quantitatively changing peptides.
MetaMorpheus
Version 0.0.132 was used for all searches. Parameters were set as follows: G-PTM-D: 2 ppm precursor mass tolerance; 0.01 Da product mass tolerance. Search: two missed cleavages were allowed; precursor tolerance of 5 ppm; product mass tolerance of 0.01 Da.; quantification tolerance of 5 ppm. Reported quantified G-PTM-D-discovered peptides are target (noncontaminant, nondecoy) peptides below 1% FDR.
RESULTS AND DISCUSSION
Comparison of MaxQuant and FlashLFQ Intensities
FlashLFQ’s peptide intensity results were compared with MaxQuant’s to assess FlashLFQ’s performance. A high-quality benchmark data set consisting of 20 files acquired by the Qu group15 was used for this analysis. In this data set, small amounts of E. coli peptides were added at varying quantities (four replicates each of 1-, 1.5-, 2-, 2.5-, or 3-fold E. coli digest) to a large, constant background of human peptides, simulating a fold-change experiment. The Andromeda search engine (integrated into MaxQuant) was used to identify peptide-spectral matches, and the results of quantification using either MaxQuant or FlashLFQ were compared (Figures 1–4 and all figures in the supplement). FlashLFQ’s peptide intensities are well-correlated to MaxQuant’s across all files, with Pearson correlation coefficients ranging from 0.991 to 0.993. Plots of log-transformed peptide intensities for four runs are displayed in Figure 1a; plots for 16 additional files are shown in Supplementary Figure S1.
Figure 1.
(a) Scatter plots of FlashLFQ peptide intensity versus MaxQuant peptide intensity. Only peptides that were quantified by both programs were plotted. FlashLFQ’s intensities correlate well to MaxQuant’s, with Pearson correlation coefficients ranging from 0.991 to 0.993. (b) FlashLFQ and MaxQuant quantification time per file, in minutes. MaxQuant’s peak-finding running time alone was plotted rather than its entire runtime. FlashLFQ quantification time is approximately an order of magnitude faster than MaxQuant’s.
Figure 4.
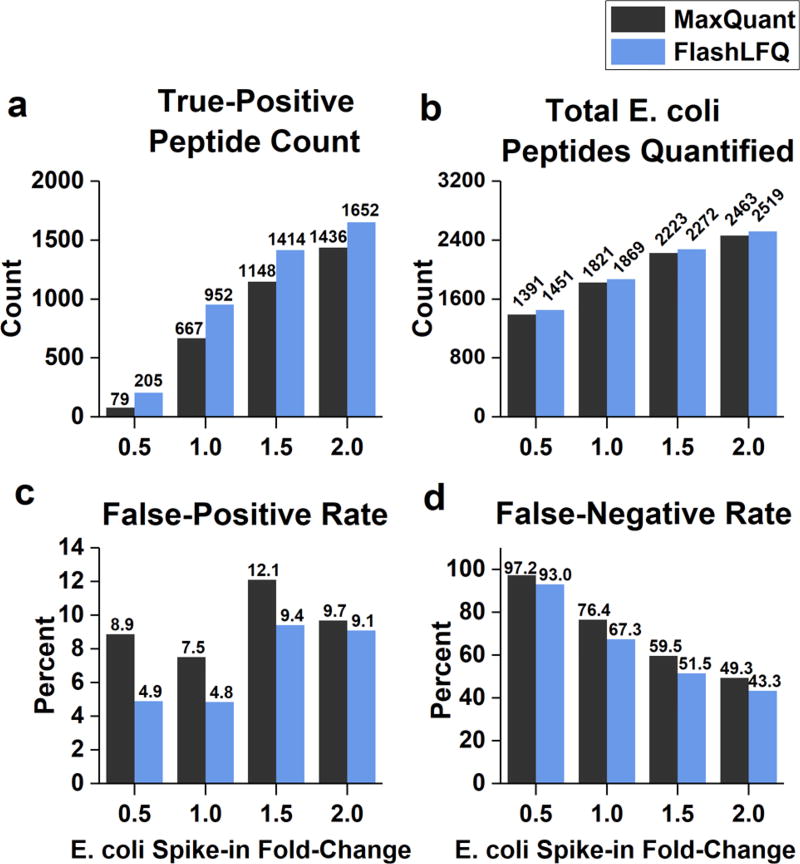
Analysis of E. coli peptide fold-changes, grouped by known fold-change. Only peptides quantified in all replicates of at least one “condition” were used in these analyses. (a) Count of significantly changing E. coli peptides. FlashLFQ detected more true-positive changing peptides than MaxQuant under all conditions, and the difference is especially pronounced for smaller fold-changes. (b) Total E. coli peptides quantified, significantly changing or not. (c) False-positive rate of significantly changing peptides. Human peptides determined to be significantly changing were counted as false-positives. (d) False-negative rate of significantly changing peptides; E. coli peptides that were determined to be not significantly changing were counted as false-negatives.
Whereas Figure 1a demonstrates a linear relationship between MaxQuant and FlashLFQ intensities, a number of data points deviate from this relationship. Manual inspection of the data suggested that differences in peak-picking algorithms were largely responsible for this deviation. (51 extracted ion chromatograms of peptides identified in file A1 were visualized with Skyline [v 3.7.0.10940] and are shown in Supplementary Figure S2.) In addition, FlashLFQ was able to quantify more MS2-identified peptides than MaxQuant; on average, FlashLFQ quantified 99.4% identified peptides per file, while MaxQuant quantified 96.0%. As others have recently described,16 using peptide identifications as a starting point for quantification (“targeted quantification”) results in fewer missing values than the de novo (using the ion selected for MS2) approach that MaxQuant and others use. Our results support this conclusion.
Comparison of MaxQuant’s and FlashLFQ’s Quantification Time
FlashLFQ’s increased speed relative to established quantification methods was evaluated by comparing MaxQuant’s peak-finding (“feature-finding”) runtime to FlashLFQ’s runtime (Figure 1b). The entire MaxQuant workflow includes nonlinear mass calibration, MS2 spectral matching, peak-finding and quantification, and intensity normalization between runs; such a complex workflow precludes direct comparison to FlashLFQ’s analysis time, as FlashLFQ only does peak-finding and quantification. Thus we chose to compare MaxQuant’s peak-finding and quantification time to FlashLFQ’s total runtime. We also observed that using multiple threads in MaxQuant slowed feature-finding time considerably (almost three times, perhaps due to hard drive speed limitations); therefore, only one thread was used in our MaxQuant analyses. FlashLFQ’s indexing-based peak assignments cuts quantification time per file by approximately an order of magnitude; quantifying the entire 20 file data set took ~18 min (32 min using one thread) compared with MaxQuant’s 4.5 h.
Precursor Charge-State Effects on Replicate Reproducibility
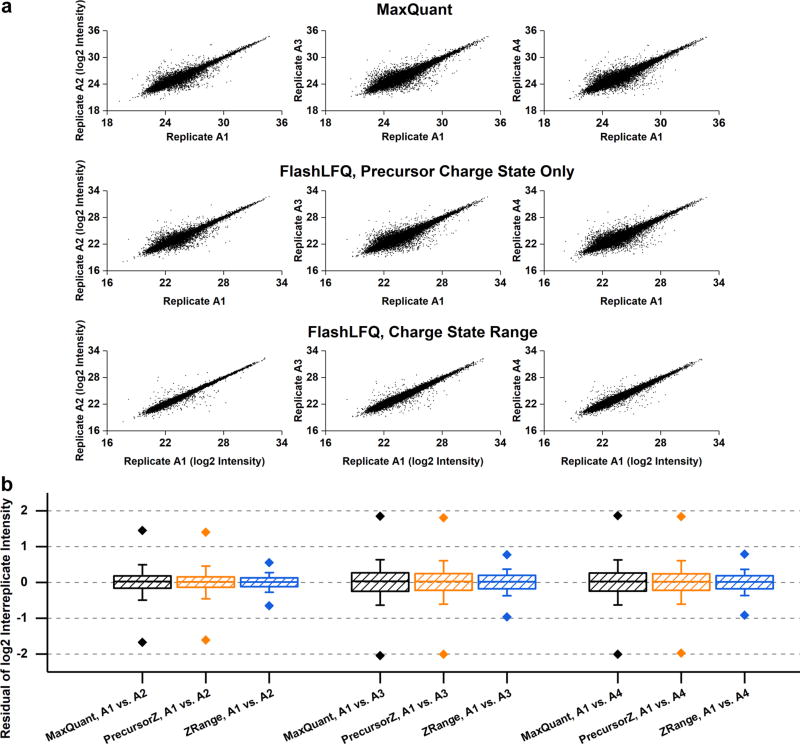
Indexing allows the use of charge states other than the one belonging to the precursor ion selected for MS2 fragmentation to quantify the peptide(s) resulting from that MS2 fragmentation spectrum. Traditional quantification algorithms could do this, but search time would generally scale linearly with the number of ions to quantify (e.g., six times the search time to extract ion chromatograms for six charge states). Indexing all mass spectral peaks according to m/z before peak-finding allows the rapid quantification of each peptide across many charge states. Additionally, targeted (rather than de novo) peak-finding allows the quantification of cofragmented peptides, although we did not investigate this thoroughly here. The plots in Figure 2a demonstrate that using a charge-state range for quantification increases replicate-to-replicate reproducibility in comparison with only using the precursor charge. Reasons for this may include (1) when using only a single charge state, the precursor ion selected for fragmentation may not be representative of that peptide’s quantity, whereas an ion with another charge state may be more representative and/or (2) separate peaks for the same peptide but with different charge states can be multiply counted rather than being combined into a single, correct peak. The boxplots in Figure 2b show that using a charge-state range (1 to 6 in this case) decreases the standard deviation of the replicate-to-replicate residuals of the log-transformed intensities by approximately half; additionally, ca. 92% of peptides fall within 1.5 times the interquartile range compared with 87% when only using the precursor’s charge state. Interestingly, ~3.7% of quantified peptides had a different most-intense charge state between replicates A1 and A2; however, normalizing by charge state (i.e., dividing intensity by charge) did not appreciably improve reproducibility as manifested in the magnitudes of the replicate-to-replicate residuals; residuals for charge-state normalized “A” replicates are shown in Supplementary Figure S3.
Figure 2.
(a) Plots of replicate-to-replicate log2-transformed intensity per peptide. Only peptides quantified in both files were plotted. Replicate A1 is compared with A2, A3, and A4 with either MaxQuant (top) or FlashLFQ using only the precursor’s charge state (middle) or across a charge state range (bottom). (b) Boxplots of replicate-to-replicate residuals of log2 intensities. Replicate A1 is compared with A2, A3, and A4 with either MaxQuant (black) or FlashLFQ using only the precursor’s charge state (orange) or across a charge-state range (blue). Box boundaries indicate 25th and 75th percentiles; whiskers indicate one standard deviation; diamonds indicate 1st and 99th percentiles.
Precursor Charge-State Effects on Quantitative Fold-Change Accuracy
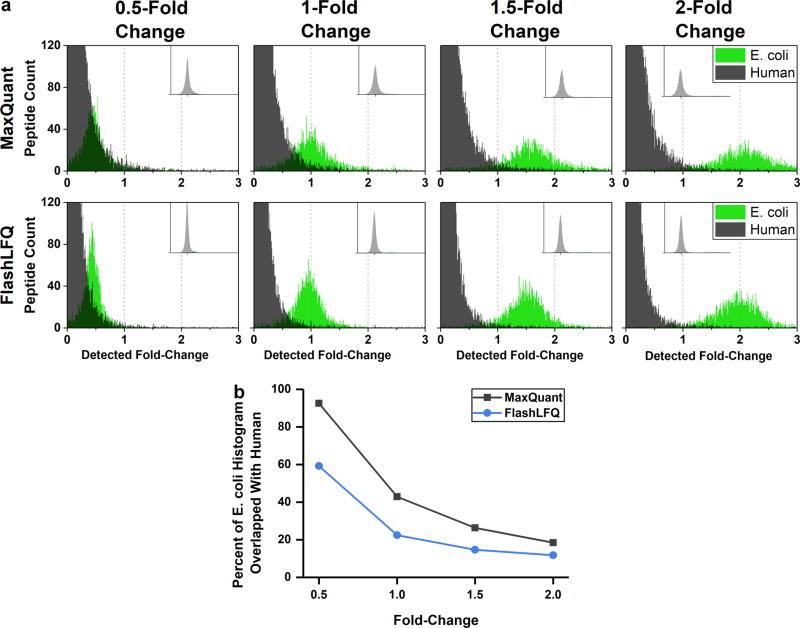
Searching for multiple charge states for each peptide results in greater quantitative precision; we wanted to know if it also resulted in greater accuracy. E. coli peptides that were determined to be changing condition-to-condition (i.e., with E. coli addition amount) were known true-positives, whereas human peptides found to be changing were known false-positives. Histograms of peptide fold-changes across all conditions (average peptide intensity in either the 1.5-, 2-, 2.5-, or 3-fold addition divided by the average peptide intensity of the 1-fold addition) are shown in Figure 3. Methionine-containing peptides are often excluded from quantification because of variable oxidation levels resulting from sample handling; to investigate this for the data set employed here, fold-change histograms were constructed for methionine-containing and non-methionine-containing peptides. No obvious difference was detected in fold-changes for the methionine-containing and non-methionine-containing peptides (results shown in Supplementary Figure S4). Thus in this particular data set it appears that methionine-containing peptides can reasonably be included in quantification; however, this may not be the case for all studies. Perseus17 was used to determine which peptides were significantly changing between each condition compared with the 1-fold addition. Using a charge-state range, FlashLFQ’s false-positive rate and false-negative rate were lower across all conditions than MaxQuant, while quantifying more total E. coli peptides and determining more E. coli peptides to be significantly changing (results summarized in Figure 4). The difference between the two quantification algorithms was especially conspicuous at the smallest (0.5) fold-change; FlashLFQ more than doubled the number of true-positively changing peptides compared with MaxQuant.
Figure 3.
(a) Histograms of peptide fold-changes across all conditions (average peptide intensity in either the 1.5-, 2-, 2.5-, or 3-fold E. coli addition compared with the average peptide intensity of the 1-fold addition), quantified by either MaxQuant (top) or FlashLFQ using a charge-state range (bottom). The green distributions represent E. coli peptide count, whereas the black distributions represent human peptides. The median fold-change for each comparison was set to 0. (b) Percent area of E. coli peptide fold-change histogram overlapping with human background peptides by known fold-change. Using a charge-state range to quantify peptides results in less overlap between true-positives (E. coli) and false-positives (human).
FlashLFQ Enables Quantification of PTM-Modified Peptides Discovered Using G-PTM-D
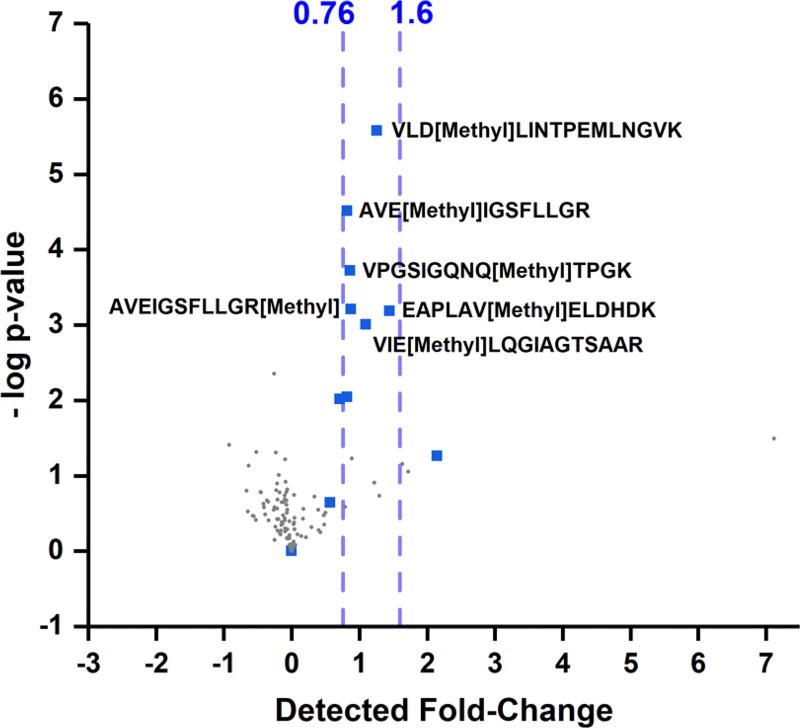
FlashLFQ was then used to quantify post-translationally modified peptides identified by MetaMorpheus using its Global PTM Discovery (G-PTM-D) engine. As described previously,14 G-PTM-D uses precursor mass differences corresponding to known PTM masses to perform a second-pass search to identify PTM-containing peptides. This strategy results in a dramatic increase in modified peptide identifications in unenriched samples with low FDR. As expected, the vast majority (e.g., 95% of methylated peptides, 230 of 242 in the “D1” file) of these identified modified peptides were quantifiable using FlashLFQ. Methylated peptide fold-changes from the 2-fold E. coli addition in comparison with the 1-fold addition (i.e., a 1-fold change) are shown in Figure 5. These results show that FlashLFQ can quantify modified peptides just as well as unmodified peptides, with statistically significant and accurate detected fold-changes. FlashLFQ can be paired with G-PTM-D to support proteoform18 identification and quantification.
Figure 5.
Methylated peptides discovered with G-PTM-D and quantified by FlashLFQ in the 2-fold E. coli digest addition (1-fold change relative to the 1-fold E. coli addition). Blue squares indicate methylated E. coli peptides; gray circles indicate methylated human peptides. Significantly changing peptides are annotated with amino acid sequence and localized methylation. Blue dashed lines indicate 5th and 95th percentile fold-change of unmodified, significantly changing E. coli peptides. FlashLFQ is able to accurately quantify modified peptides in unenriched samples, supporting top-down and intact proteoform identification and quantification results.
CONCLUSIONS
As the amount of raw shotgun proteomics data increases, both in terms of file size and number of files per experiment, software that can rapidly analyze large data sets is becoming increasingly important. We demonstrate that indexing-based quantification is a simple, powerful tool that can dramatically decrease the analysis time required for peptide quantification. The hardware requirements for such an analysis are also dramatically decreased; even on an inexpensive laptop computer with low amounts of RAM and a single-core CPU, hundreds of files may be quantified in a reasonable time frame (e.g., a minute each). By delaying quantification until after peptides in the sample have already been identified, those peptides can be rapidly quantified because (1) each peak in the raw file only needs to be checked once to see if it could belong to an identified peptide and (2) the peaks are categorized in lookup-tables according to m/z, enabling each identification to check a handful of mass spectral peaks rather than repeatedly sampling the same obviously extraneous peaks. Additionally, the time savings resulting from indexing-based quantification can be used for computationally expensive tasks, such as looking for multiple charge states for each peptide, resulting in a more accurate analysis while maintaining a practical analysis time.
Supplementary Material
Acknowledgments
We thank the entire proteomics software development team of the Smith lab (Leah V. Schaffer, Anthony J. Cesnik, Lei Lu), who contributed daily input and guidance to the improvement of FlashLFQ, mzLib, and MetaMorpheus. This work was supported by grant U24CA1993347 from the National Institutes of Health. R.J.M. was supported by an NHGRI training grant to the Genomic Sciences Training Program 5T32HG002760.
ABBREVIATIONS
- PTM
post-translational modification
- LC
liquid chromatography
- MS
mass spectrometry
- G-PTM-D
Global Post-Translational Modification Discovery
- LFQ
label-free quantification
Footnotes
ASSOCIATED CONTENT
- Supplementary Figure S1. FlashLFQ versus MaxQuant intensity comparisons for all 20 files in the data set. Supplementary Figure S2. Extracted ion chromatograms of peptides with highly diverging MaxQuant and FlashLFQ intensities, visualized with Skyline. Supplementary Figure S3. Replicate reproducibility of charge-state-normalized versus non-normalized intensities. Supplementary Figure S4. Fold-changes of methionine-containing versus nonmethionine-containing peptides. (PDF)
Author Contributions
R.J.M. wrote the FlashLFQ software, performed all searches and data analysis and wrote the manuscript. S.K.S. wrote mzLib, a toolset based on Derek J. Bailey’s C# Mass Spectrometry Library (CSMSL), which FlashLFQ uses extensively. M.R.S. conceived the concept of using indexing for rapid quantification and edited the manuscript. L.M.S. edited the manuscript and directed the project.
The authors declare no competing financial interest.
References
- 1.Aebersold R, Mann M. Mass Spectrometry-Based Proteomics. Nature. 2003;422(6928):198–207. doi: 10.1038/nature01511. [DOI] [PubMed] [Google Scholar]
- 2.Silva JC, Gorenstein MV, Li G-Z, Vissers JPC, Geromanos SJ. Absolute Quantification of Proteins by LCMSE. Mol. Cell. Proteomics. 2006;5(1):144–156. doi: 10.1074/mcp.M500230-MCP200. [DOI] [PubMed] [Google Scholar]
- 3.Zhang B, Pirmoradian M, Zubarev R, Käll L. Covariation of Peptide Abundances Accurately Reflects Protein Concentration Differences. Mol. Cell. Proteomics. 2017;16(5):936–948. doi: 10.1074/mcp.O117.067728. [DOI] [PMC free article] [PubMed] [Google Scholar]
- 4.Nesvizhskii AI, Keller A, Kolker E, Aebersold R. A Statistical Model for Identifying Proteins by Tandem Mass Spectrometry. Anal. Chem. 2003;75(17):4646–4658. doi: 10.1021/ac0341261. [DOI] [PubMed] [Google Scholar]
- 5.Yang X, Dondeti V, Dezube R, Maynard DM, Geer LY, Epstein J, Chen X, Markey SP, Kowalak JA. DBParser: Web-Based Software for Shotgun Proteomic Data Analyses. J. Proteome Res. 2004;3(5):1002–1008. doi: 10.1021/pr049920x. [DOI] [PubMed] [Google Scholar]
- 6.Liu NQ, Dekker LJM, Stingl C, Güzel C, De Marchi T, Martens JWM, Foekens JA, Luider TM, Umar A. Quantitative Proteomic Analysis of Microdissected Breast Cancer Tissues: Comparison of Label-Free and SILAC-Based Quantification with Shotgun, Directed, and Targeted MS Approaches. J. Proteome Res. 2013;12(10):4627–4641. doi: 10.1021/pr4005794. [DOI] [PubMed] [Google Scholar]
- 7.Cox J, Mann M. MaxQuant Enables High Peptide Identification Rates, Individualized P.p.b.-Range Mass Accuracies and Proteome-Wide Protein Quantification. Nat. Biotechnol. 2008;26(12):1367–1372. doi: 10.1038/nbt.1511. [DOI] [PubMed] [Google Scholar]
- 8.Argentini A, Goeminne LJE, Verheggen K, Hulstaert N, Staes A, Clement L, Martens L. moFF: A Robust and Automated Approach to Extract Peptide Ion Intensities. Nat. Methods. 2016;13(12):964–966. doi: 10.1038/nmeth.4075. [DOI] [PubMed] [Google Scholar]
- 9.Nahnsen S, Bielow C, Reinert K, Kohlbacher O. Tools for Label-Free Peptide Quantification. Mol. Cell. Proteomics. 2013;12(3):549–556. doi: 10.1074/mcp.R112.025163. [DOI] [PMC free article] [PubMed] [Google Scholar]
- 10.Tang WH, Halpern BR, Shilov IV, Seymour SL, Keating SP, Loboda A, Patel AA, Schaeffer DA, Nuwaysir LM. Discovering Known and Unanticipated Protein Modifications Using MS/MS Database Searching. Anal. Chem. 2005;77(13):3931–3946. doi: 10.1021/ac0481046. [DOI] [PubMed] [Google Scholar]
- 11.Kong AT, Leprevost FV, Avtonomov DM, Mellacheruvu D, Nesvizhskii AI. MSFragger: Ultrafast and Comprehensive Peptide Identification in Mass Spectrometry–based Proteomics. Nat. Methods. 2017;14(5):513–520. doi: 10.1038/nmeth.4256. [DOI] [PMC free article] [PubMed] [Google Scholar]
- 12.Chick JM, Kolippakkam D, Nusinow DP, Zhai B, Rad R, Huttlin EL, Gygi SP. An Ultra-Tolerant Database Search Reveals That a Myriad of Modified Peptides Contributes to Unassigned Spectra in Shotgun Proteomics. Nat. Biotechnol. 2015;33(7):743–749. doi: 10.1038/nbt.3267. [DOI] [PMC free article] [PubMed] [Google Scholar]
- 13.Gillet LC, Navarro P, Tate S, Rost H, Selevsek N, Reiter L, Bonner R, Aebersold R. Targeted Data Extraction of the MS/MS Spectra Generated by Data-Independent Acquisition: A New Concept for Consistent and Accurate Proteome Analysis. Mol. Cell. Proteomics. 2012;11(6):O111.016717. doi: 10.1074/mcp.O111.016717. [DOI] [PMC free article] [PubMed] [Google Scholar]
- 14.Li Q, Shortreed M, Wenger C, Frey B, Schaffer L, Scalf M, Smith L. Global Post-Translational Modification Discovery. J. Proteome Res. 2017;16(4):1383–1390. doi: 10.1021/acs.jproteome.6b00034. [DOI] [PMC free article] [PubMed] [Google Scholar]
- 15.Shen X, Shen S, Li J, Hu Q, Nie L, Tu C, Wang X, Orsburn B, Wang J, Qu J. An IonStar Experimental Strategy for MS1 Ion Current-Based Quantification Using Ultra-High-Field Orbitrap: Reproducible, in-Depth and Accurate Protein Measurement in Larger Cohorts. J. Proteome Res. 2017;16:2445. doi: 10.1021/acs.jproteome.7b00061. [DOI] [PMC free article] [PubMed] [Google Scholar]
- 16.Weisser H, Choudhary JS. Targeted Feature Detection for Data-Dependent Shotgun Proteomics. J. Proteome Res. 2017;16:2964. doi: 10.1021/acs.jproteome.7b00248. [DOI] [PMC free article] [PubMed] [Google Scholar]
- 17.Tyanova S, Temu T, Sinitcyn P, Carlson A, Hein MY, Geiger T, Mann M, Cox J. The Perseus Computational Platform for Comprehensive Analysis of (Prote)omics Data. Nat. Methods. 2016;13(9):731–740. doi: 10.1038/nmeth.3901. [DOI] [PubMed] [Google Scholar]
- 18.Smith LM, Kelleher NL, et al. Proteoform: A Single Term Describing Protein Complexity Lloyd. Nat. Methods. 2013;10(3):186–187. doi: 10.1038/nmeth.2369. [DOI] [PMC free article] [PubMed] [Google Scholar]
Associated Data
This section collects any data citations, data availability statements, or supplementary materials included in this article.


