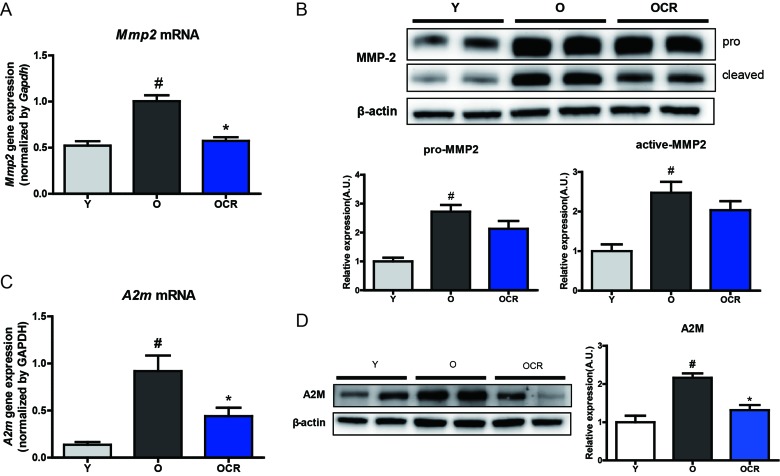
Figure 2. Alteration of MMP2 and A2M expression during aging and CR.
(A) Gene expression on MMP2 was detected by qPCR. The mRNA levels were normalized to the Gapdh level. #P < 0.05 vs young. *P < 0.05 vs old. (B) Western blotting was conducted to detect protein expression of MMP2. β-actin was used as loading control. The blots were quantified by densitometry (n = 8). Data are expressed as the mean ± SEM. #P < 0.05 vs young. (C) Gene expression of A2m is detected by qPCR. mRNA levels were normalized to the Gapdh level. #P < 0.05 vs young. *P < 0.05 vs old. (D) Protein level of A2M is identified by Western blotting. The blots were quantified by densitometry (n = 8). Data are expressed as the mean ± SEM. #P < 0.05 vs young. *P < 0.05 vs old.

