Abstract
Objectives
Factors affecting access to healthcare is an expanding area of research. This study seeks to identify factors associated with no-show rates in an academic Otolaryngology practice in order to improve clinical efficiency and patient access to care.
Study Design
Retrospective review.
Methods
A retrospective review of scheduled clinical appointments from February 1, 2015, to January 30, 2016, at a single academic Otolaryngology department was performed. Statistical analysis was completed to examine the association of no-show rates with the following: Otolaryngology subspecialty, clinic location (e.g. main campus vs. satellite), patient demographic factors, attending seniority, temporal factors, insurance types, rurality, and visit type.
Results
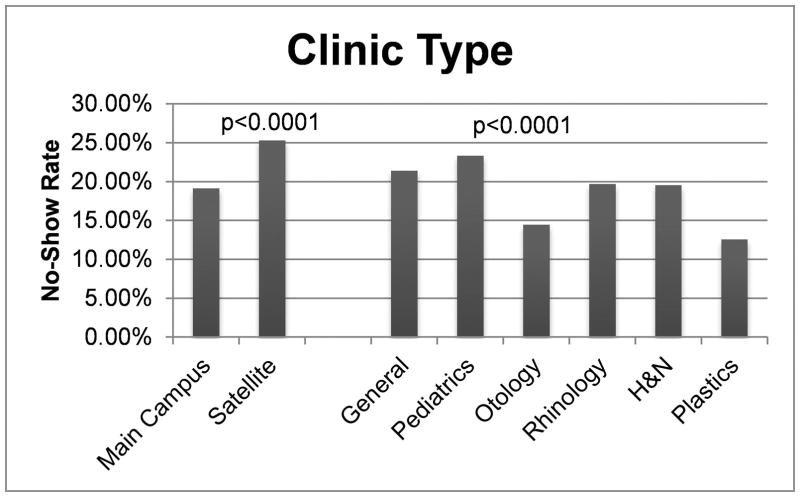
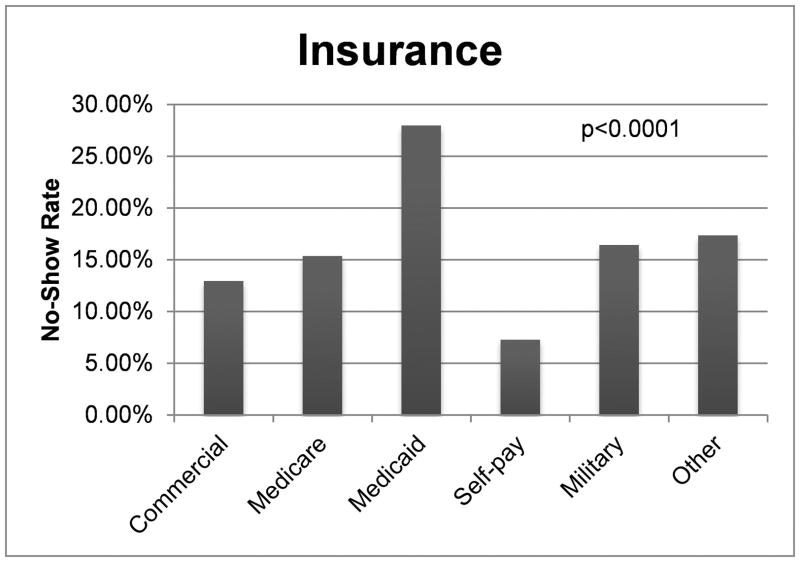
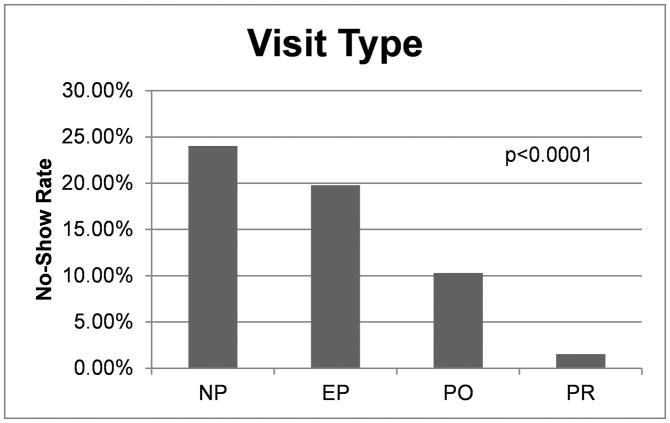
There was an overall no-show rate of 20% for 22,759 scheduled clinic visits. Satellite clinics had the highest no-show rates at 25% (p<0.001). New patient visits had the highest no-show rate at 24% (p<0.001). Among subspecialties, Facial Plastic surgery had the lowest no-show rate (12.6%) while Pediatrics had the highest (23%) (p<0.001). No significant association between gender and no-show rates was observed (p=0.29), but patients over 60 years old had the lowest no-show rate (12.7%, p<0.0001). Patients with Medicaid (28%), Medicare (15.3%), and commercial insurance (12.9%) had significantly different overall no-show rates (p<0.0001).
Conclusions
Increased clinic no-show rates are associated with satellite clinics, new patient visits, younger age and insurance type. No-show rates varied among subspecialties. Further investigation is warranted to assess barriers to appointment compliance and to develop interventions to improve access to care.
Keywords: No-show, Appointment non-adherence, Insurance status, Academic Otolaryngology
INTRODUCTION
Non-adherence, or “No-show,” appointments are defined as missed clinic appointments where a patient does not notify the provider ahead of time that he or she will not be attending the appointment. Patient no-show rates vary by specialty and other factors but have been reported to range from 7–33%. 1–8 Non-adherence to attend scheduled clinic appointments may detrimentally impact delivery of care to patients on multiple levels. No-shows can negatively affect the individual’s health by leading to worse health-related outcomes and increased use of emergency departments for care.9 Failure of a patient to keep their appointment can negatively affect not only that individual’s care but also the care of other patients who are unable to get timely appointments. This leads to longer waiting times for clinic appointments and a decrease in patient satisfaction. With a looming shortage of Otolaryngologists in the future,10 appointment non-adherence and the factors associated with no-shows is an important area of research.
In addition to patient care delivery, no-show appointments can have a substantial financial impact on healthcare systems through reduced clinical efficiency resource utilization. The University of California at San Francisco (UCSF) estimates approximately 67,000 no-show patients a year within the UCSF system, with a financial impact estimated at $7 million for the health care system.11 Academic medical centers, in particular, are at risk for no-show appointments due to a patient population with complex health conditions, significant patient travel distances, and a high volume of indigent care. Previous studies have shown multiple factors affecting no-show rates. These factors include distance from clinic,1 insurance carrier,12 timing of clinic visit,6,8 and gender.8 However, these studies primarily examined factors that affect no-show rates in the primary care setting with little attention to comparing surgical subspecialty clinics, in particular Otolaryngology clinics. The objective of this study was to examine factors associated with no-show rates in a multi-subspecialty Otolaryngology department at a single academic institution over a one-year period of time. Furthermore, by examining clinic no-show variables we may be able to identify potentially modifiable factors associated with increased no-show rates in order to facilitate better access to care and improve patient outcomes in the future.
MATERIALS AND METHODS
The Institutional Review Board at the University of Kentucky approved this study (IRB Number 15-0864-P3H). A retrospective chart review was conducted on all patients with a scheduled appointment with a physician in the University of Kentucky (UKY) Otolaryngology Clinics, an academic tertiary care center, between February 1, 2015 and January 30, 2016. Patients scheduled to see a mid-level provider (nurse practitioner or physician’s assistant) or resident only were excluded. Audiology and allergy-only appointments were excluded. A query of the outpatient electronic medical records system, Allscripts Electronic Health Record (AEHR) (Sandy Springs, GA), and the billing system, Allscripts Practice Management (APM), was performed. Patients were identified as either showing or no-showing for their scheduled clinic appointment. No-Show appointments included all patients that did not keep their appointment. At our institution, all patients receive an automated telephone reminder 2–3 days prior to their appointment. Patients that notified the clinic to cancel or reschedule within 24 hours of their appointment were not included in the no-show group. Review of APM further provided demographic data, including age, gender, race, county of residence, insurance type, and visit type (new patient, established patient, procedure or post-op) for each patient. Chart review in AEHR was conducted for any missing data on patients. Data was compiled in Microsoft Excel 2013 (Redmond, Washington). Ethnicity was recorded only for December 2015 and January 2016. Clinic sites included two hospital-based and three outreach (“satellite”) ambulatory clinics. Providers included four Head and Neck Oncology Surgeons, two Neurotologists, one Rhinologist, two Pediatric Otolaryngologists, one Facial Plastic and Reconstructive Surgeon and two General Otolaryngologists. Attending physician academic rank was classified as junior faculty (assistant or associate professor < 5 years) versus senior faculty (associate professor > 5 years or full professor). Insurance types were categorized into Medicare, Medicaid, Commercial, Self-pay, Military, Other and Unknown. The weekday and season of scheduled visits were also recorded. Gross estimates of distance travelled for each patient were determined by the number of counties traversed by a patient to reach the clinic. Rural-Urban Continuum Codes, also known as Beale Codes, were used to classify county of residence into rural or urban based on their population and proximity to metropolitan areas.13 The coding system ranges from 1 to 9 with 1 representing the most metropolitan areas of Kentucky and 9 representing the most rural areas with the smallest population. The codes were then grouped such that 1 to 3 represented urban areas, 4 to 6 represented suburban or rural areas adjacent to metropolitan areas and 7 to 9 represented very rural areas.
Statistical Analysis
Descriptive statistics are presented as frequencies (%). Multiple observations were observed for many subjects, and therefore all analyses accounted for the statistical correlation among no show observations from the same subject. Specifically, bivariate and multivariate analyses were conducted by fitting marginal regression models using cluster-weighted generalized estimating equations14 with robust standard errors to ensure the validity of inference. A final multivariate logistic regression model was fit using predictors that showed the greatest clinical impact in bivariate analysis results. All tests were two-sided at the 0.05 significance level. Analyses were conducted in SAS version 9.4 (SAS Institute, Cary, NC).
RESULTS
In the one-year time period, there was a total of 22,759 scheduled patient visits for all UKY Otolaryngology clinics that met inclusion criteria. The overall no-show rate for all clinics was 20%. Satellite clinics accounted for 14% of total visits. These clinics had no-show rates of 25% compared to 19% at the main medical campus (p<0.0001). No-show rates between Otolaryngology sub-specialties on univariate analysis are shown in FIGURE 1. On post-test pairwise comparison analysis, the differences between Plastics and Otology versus all other sub-specialty clinics were statistically significant. There was no statistically significant difference between the no-show rates in the Plastics and Otology clinics. Additionally, the difference between the General-Main Campus clinic versus the General-Satellite clinic was statistically significant. When comparing attending rank status, overall no-show rates for senior faculty were lower than for junior faculty (18.7% versus 21.1%, p=0.0001). However, senior faculty had a statistically significant lower no-show rate only within the general clinic when controlling for sub-specialty (FIGURE 2).
FIGURE 1.
Overall no-show rates for satellite versus main campus clinics and Otolaryngology subspecialty clinics.
FIGURE 2.
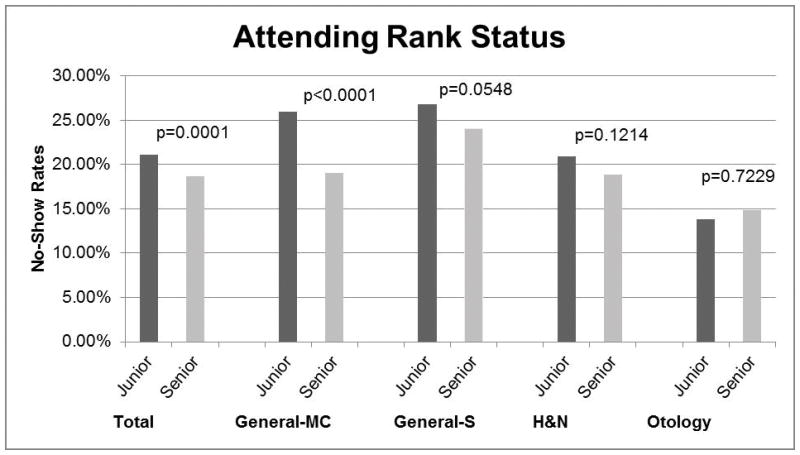
Association of no-show rates with attending rank status by specialty
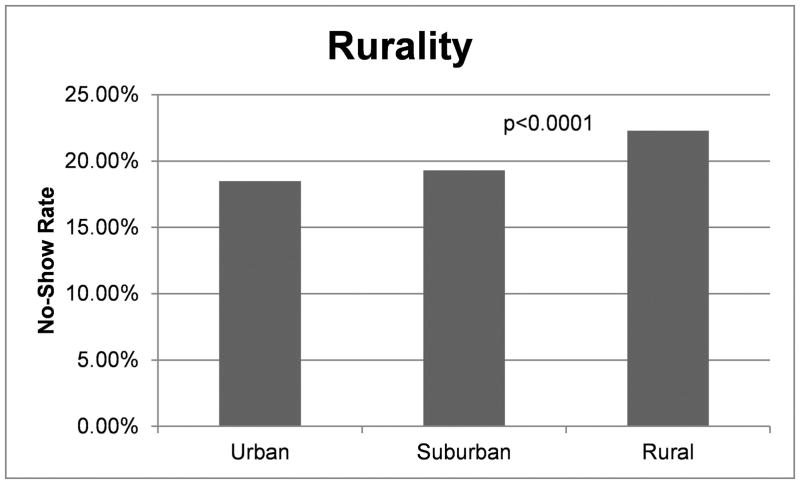
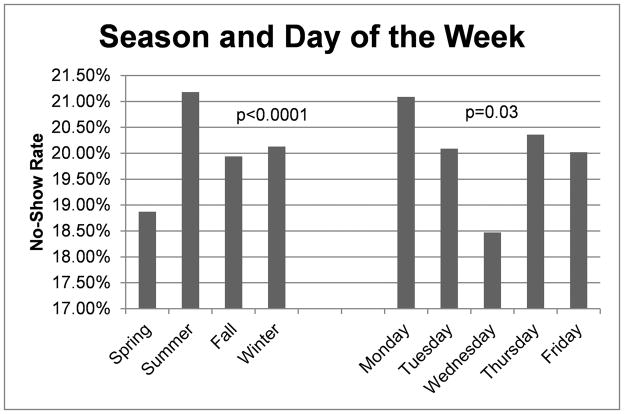
The patient demographics are listed in TABLE 1. On univariate analysis no statistically significant difference was seen between genders in terms of no-show rates (Males=20.3%, Females=19.7%, p=0.6707). There was positive association between increasing age and attendance at clinic visit among adult patients (TABLE 1), with patients 18–40 years old having the highest no-show rate at 25.3% and those 61 years and older with the lowest no-show rate at 12.7% (p<0.0001). On pairwise comparison, all comparisons were significant within the age categories. There was a statistically significant difference in no-show rates between Asian (13%), White/Caucasian (19%) and African American patients (27%) (p<0.0001). On pairwise comparison analysis, all differences between races were statistically significant except for the no-show rates between White/Caucasian and Asian patients. Additionally, Hispanic patients had a 49.5% no-show rate compared to non-Hispanics who no-showed 19.2% (p<0.0001) for the two-month period examined. Within our patient population, 35% of patients had commercial insurance, 37% had Medicaid and 24% had Medicare. No-show rates for these insurances were 13%, 28%, and 15.4%, respectively (P<0.0001), on univariate analysis (FIGURE 3). Patients who were self-payers had the lowest no-show rate at 7.3%. On post-univariate analysis pairwise comparison testing, all comparisons were statistically significant except for Medicare versus Military and Commercial versus Military insurance. New patients had the highest rate of no-show appointments (FIGURE 4). On univariate analysis, patients living in rural areas had a higher rate of no-show visits compared to patients in metropolitan areas (p<0.0001) (FIGURE 5). No-show rates were found to vary significantly with day of the week for clinic appointment and season. Spring season (p<0.0001) and Wednesday clinics (p=0.031) were found to have significantly less no-show appointments (FIGURE 6). On pairwise comparison analysis for the seasons, all findings between each season were significant except when comparing Spring to Fall. For days of the week, the differences between Wednesday and Friday and Wednesday and Monday were statistically significant (p=0.0069 and p=0.0044, respectively).
Table 1.
Patient Demographics
| Variable | Incidence (%) | No-Show Rate | P-value |
|---|---|---|---|
| Gender | |||
| Male | 11121 (48.9) | 19.7% | p=0.6707 |
| Female | 11638 (51.1) | 20.3% | |
| Age (yr) | |||
| <18 | 5904 (26.0) | 23.41% | p<0.0001 |
| 18–40 | 4445 (19.5) | 25.3% | |
| 41–60 | 6738 (29.6) | 19.7% | |
| 61+ | 5672 (24.9) | 12.7% | |
| Race | |||
| White/Caucasian | 20513 (90.1) | 19.2% | p<0.0001 |
| African American | 1528 (6.7) | 27.0% | |
| Asian | 259 (1.1) | 12.9% | |
| Unknown/Other | 446 (2.0) | 38.1% | |
| American Indian | 13 (0.1) | 7.7% | |
| Ethnicity* | |||
| Non-Hispanic | 3637 (94.6) | 19.2% | p<0.0001 |
| Hispanic | 208 (5.4) | 49.5% | |
Represents data from December 2015–January 2016.
FIGURE 3.
Association of no-show rates with insurance type.
FIGURE 4.
Association of no-show rates with visit type.
FIGURE 5.
Association of no-show rates with rurality.
FIGURE 6.
Association of no-show rates with time.
Multivariate analysis results are show in TABLE 2. In brief, compared to the General clinic-Main Campus, the Otology clinics were less likely to have no-show appointments (OR=0.60, p=0.001). Additionally, the no-show rate for the Pediatric Otolaryngology clinic was not significantly different from the general clinic. Furthermore, there was no statistical difference in no-show rates associated with race. Finally, commercially insured patients were less likely to no-show to appointments compared to Medicaid patients (OR=0.42, p<0.0001).
Table 2.
Multivariate Analysis
| Predictor | OR Estimate (95% CI) | P-value |
|---|---|---|
|
| ||
| Sub-specialty | ||
| General (Main Campus) | reference | |
| General (Satellite) | 1.04 (0.77 – 1.40) | 0.802 |
| H&N | 0.84 (0.63 – 1.14) | 0.270 |
| Otology | 0.60 (0.44 – 0.81) | 0.001 |
| Pediatrics | 0.70 (0.48 – 1.01) | 0.057 |
| Plastics | 0.52 (0.26 – 1.04) | 0.064 |
| Rhinology | 0.92 (0.62 – 1.37) | 0.696 |
|
| ||
| Age | ||
| 17 years and younger | reference | |
| 18 to 40 years | 0.95 (0.69 – 1.31) | 0.775 |
| 41 to 60 years | 0.73 (0.53 – 1.01) | 0.056 |
| 61 years and older | 0.32 (0.21 – 0.49) | <.0001 |
|
| ||
| Race | ||
| White/Caucasian | Reference | |
| African American/Black | 1.13 (0.80 – 1.58) | 0.496 |
| Other | 0.38 (0.12 – 1.21) | 0.101 |
| Unknown | 2.07 (1.14 – 3.77) | 0.017 |
|
| ||
| Insurance | ||
| Medicaid | Reference | |
| Medicare | 0.84 (0.60 – 1.18) | 0.306 |
| Military | 0.54 (0.21 – 1.37) | 0.196 |
| Commercial | 0.42 (0.34 – 0.52) | <.0001 |
| Self | 1.24 (0.30 – 5.08) | 0.763 |
| Other | 3.26 (1.61 – 6.60) | 0.001 |
| Unknown | 4.36 (2.39 – 7.96) | <.0001 |
DISCUSSION
No-show appointments may hinder patient care, but investigating the factors associated with this non-adherence can provide an opportunity to improve clinic efficiency. Many factors including insurance type, age, ethnicity, diagnosis, clinical setting, visit type and time, day and season of clinic visit have been associated with increased no-show rates. However, most of these studies have been performed in the pediatric1,3 or medicine specialties, or outside of the United States5–8 making them less applicable to the current US system. This review demonstrates that new patient visits, satellite clinics, younger age and Medicaid insurance are associated with reduced attendance at scheduled appointments within an academic otolaryngology setting. By identifying these targets for improvement, these study results can inform the development of initiatives to expedite and improve access to healthcare for patients.
Access to healthcare has become a critical issue in the United States, and this issue was especially brought to the forefront with the passage of the Patient Protection and Affordable Care Act (ACA) on March 23, 2010. One of the goals of the ACA is to provide better access for Americans to health insurance and health service15 by expanding coverage for the uninsured through expanding Medicaid in addition to establishing health insurance marketplaces.16 Total enrollment in Medicaid as of May 2016 was over 72 million.17 These changes are especially pertinent to academic medical centers that have traditionally taken on a large volume of indigent care. Indeed in this review, Medicaid patients accounted for almost 40% of all patient visits and 28% of all missed appointments. There have been previous studies showing insurance type to be associated with increased no-show rate. Rosenthal et al found that in patients undergoing primary total knee arthroplasty, Medicaid patients had not only a higher number of cancelled and missed appointments but also increased complications. Additionally, in a procedure that requires extensive post-operative rehab, Medicaid patients had a shorter average follow up period compared to commercially-insured patients.12 Another study that was recently performed within an academic pediatric Otolaryngology practice showed that almost 80% of their no-show patients had public insurance. Interestingly, our pediatric practice had the highest rate of no-show visits overall on univariate analysis, but this was not statistically significant on multivariate analysis when accounting for insurance status. Contrary to our study, however, they found that the no-show rate among new patients was lower than other visits types within their statistical model.18 Reasons for these missed appointments are unknown but could be related to long wait times to be seen in clinic, lack of transportation, or financial barriers.
Some have suggested that Medicaid-insured patients have to travel farther to find a physician that accepts their insurance.19 Our satellite clinics in rural areas are meant to provide health services closer to patients and improve their access to Otolaryngology subspecialty care. Patients seen at satellite clinics are typically similar in level of care as our general main campus clinics. Patients are only sent to the main campus for surgery or if they require multi-disciplinary oncology treatment. In fact, many patients are initially referred and seen in our main campus clinic then scheduled to follow up at the satellite clinics for patient convenience. However, the general Otolaryngology clinics, both at the main campus and satellites, likely have less acuity of care overall compared to subspecialty clinics, which may affect the appointment attendance at satellite clinics. Each satellite clinic is in a traditionally more rural area than the main medical campus. Patients residing in the surrounding rural area are closer geographically to these clinics, which could potentially mitigate fewer travel obstacles to clinic attendance. However, we demonstrate that patients attending satellite clinics overall have a higher no-show rate than those travelling to the main medical campus. Satellite clinics accounted for 14% of total patient visits but had a no-show rate much higher than clinics at the main campus. These findings present an interesting paradox between clinic attendance at the main campus of the academic medical system and attendance at outlying clinics. Our data further suggests a disparity in no-show rates based on residence rurality with patients from more rural areas having an increased no-show rate. Another recent study also showed that proximity to clinic location was associated with a higher no-show rate; however, this was performed in a large metropolitan area, suggesting that location of clinic is only one of multiple factors that influence attendance rates.20 Barriers such as education and socioeconomic factors that are known to affect patient care especially in rural areas21 may be an important consideration in no-show visits. These findings may influence the placement of resources for healthcare access in the future.
Timing of clinic visits is a potential target for improving no-show rates. Our study supports previous findings that summer appointments3 are associated with an increase in no-show rates. However, contrary to other studies,8 we found a significantly lower rate of no-show appointments on Wednesdays. The small difference in no-show rates between seasons and day of the week in the setting of such a large sample size make the actual clinical significance of these findings unknown. Length of time from making appointment to actual appointment visit has also been shown to affect no-show rates as well. Perez et al determined that 65% of no-show appointments were made 4 weeks or more prior to the visit.3 Similarly, Cohen et al showed that no-show rates also decreased when the actual appointments were within 1–7 days compared to 7–15 days of being scheduled.6 We did not evaluate the time from when an appointment was made to the actual appointment date; however, this could be a significant factor affecting patient attendance to their clinic visits and a target for further study and possible improvement in our system. Finally, we also examined the association of attending rank status to no-show rates. Overall, junior faculty had a higher no-show rate, but within the subspecialties examined, there was no statistical difference except when looking at the General clinic-main campus. The overall difference may be associated with a more established practice and referral base in more senior faculty.
Patient’s scheduling conflicts and forgetting about the appointment have been shown to be the most common reasons for not keeping appointments.1 In our study new patient visits comprise over one-third of patient visits, yet a quarter of these patients did not keep their appointment. This may be due to multiple factors including forgetfulness, scheduling conflicts, resolution of symptoms, or transportation barriers. Multiple interventions aimed at adjusting patient behaviors, such as letters, text messages and phone call reminders have been studied with mixed results.22–24 All modes of reminders are better than none, and one systematic review found that text messaging was the most effective and also a cost-effective method of reminding patients of appointment dates and times.24 Patient communication is not without limitations, though, as many patients in rural areas may not have access to or utilize text messaging. Our current system provides automated telephone calls for patient reminders. The UK Healthcare system has also implemented an online patient portal system recently in an attempt to allow patients more involvement in their appointment scheduling, records, prescriptions, etc. The effectiveness of these initiatives to positively influence appointment attendance is unknown, and there are certainly economic factors that could limit the effectiveness of the patient portal (e.g. lack of computer or smart phone access).
In addition to prompting patient behaviors, provider-controlled interventions have been tested. Generic overbooking can cause issues with increased wait times and overtime for clinic staff. To combat this, some have created models to predict no-show patients to guide selective overbooking.25,26 Izard created virtual physician booking that double-booked frequent no-show patients, decreasing the no-show rate by 20% and increasing total visits by 30%.27 DuMontier established a patient cohort that was responsible for ~17% of their no-shows. By intervening with just this group the no-show rate improved from 33.3% to 17.7% and resulted in an overall improvement from 10% to 7% for total no-shows rate.28 Perhaps the addition of mid-level providers might improve time between scheduling to appointment leading to improvement of no-show rates in addition to increasing access to care and improving overall patient satisfaction.29
There are limitations to this study. It was performed at a single academic center and may not be applicable to other academic centers or private practices. With a population of ~90% white/Caucasian, the study sample may not be reflective of other areas. There also are socioeconomic factors such as education level and income status that were not captured in our data but may affect clinic attendance. It is also possible that our results may actually be an underestimate of how clinics can be affected by no-show visits. Not included were cancellations made within 24 hours, which can lead to openings in a clinic that can be hard to fill on such short notice. These lead to gaps in scheduling and are lost opportunities to see another patient that has been waiting for an appointment. However, this study provides important information for targeted improvement in clinical efficiency and patient care. Further prospective research is needed to identify the knowledge, attitudes, and behaviors of patients that influence adherence to appointment attendance.
CONCLUSION
Satellite clinics, new patient visits, younger age, and Medicaid insurance were observed to be associated with reduced attendance at scheduled appointments. Certain subspecialties in Otolaryngology may face greater no-show rates. Additional investigation into rural barriers to care is warranted. Careful evaluation of scheduling and patient communication is needed to maximize patient outcomes and healthcare resource utilization. Further research is needed to identify key modifiable patient-level and system-level factors that influence clinic appointment adherence.
Acknowledgments
Source of Funding: This work was supported by the National Institute of Deafness and Other Communication Disorders (1K23DC014074)(MLB). MLB is a member of the Surgical Advisory Board of Med El Corporation.
Footnotes
Conflicts of Interest: The authors have no other financial relationships or conflicts of interest to disclose pertaining to the manuscript.
This research was presented at the Triological Society Combined Sections Meeting, New Orleans, LA, USA, January 19–21, 2017.
Level of Evidence: 4
BIBLIOGRAPHY
- 1.Guzek LM, Fadel WF, Golomb MR. A Pilot Study of Reasons and Risk Factors for “No-Shows” in a Pediatric Neurology Clinic. Journal of child neurology. 2015;30:1295–1299. doi: 10.1177/0883073814559098. [DOI] [PubMed] [Google Scholar]
- 2.Guzek LM, Gentry SD, Golomb MR. The estimated cost of “no-shows” in an academic pediatric neurology clinic. Pediatric neurology. 2015;52:198–201. doi: 10.1016/j.pediatrneurol.2014.10.020. [DOI] [PubMed] [Google Scholar]
- 3.Perez FD, Xie J, Sin A, et al. Characteristics and direct costs of academic pediatric subspecialty outpatient no-show events. Journal for healthcare quality : official publication of the National Association for Healthcare Quality. 2014;36:32–42. doi: 10.1111/jhq.12007. [DOI] [PubMed] [Google Scholar]
- 4.Satiani B, Miller S, Patel D. No-show rates in the vascular laboratory: analysis and possible solutions. Journal of vascular and interventional radiology : JVIR. 2009;20:87–91. doi: 10.1016/j.jvir.2008.09.027. [DOI] [PubMed] [Google Scholar]
- 5.Goldbart AD, Dreiher J, Vardy DA, Alkrinawi S, Cohen AD. Nonattendance in pediatric pulmonary clinics: an ambulatory survey. BMC pulmonary medicine. 2009;9:12. doi: 10.1186/1471-2466-9-12. [DOI] [PMC free article] [PubMed] [Google Scholar]
- 6.Cohen AD, Kaplan DM, Shapiro J, Levi I, Vardy DA. Health provider determinants of nonattendance in pediatric otolaryngology patients. The Laryngoscope. 2005;115:1804–1808. doi: 10.1097/01.mlg.0000175202.50499.63. [DOI] [PubMed] [Google Scholar]
- 7.Cohen AD, Kaplan DM, Kraus M, Rubinshtein E, Vardy DA. Nonattendance of adult otolaryngology patients for scheduled appointments. The Journal of laryngology and otology. 2007;121:258–261. doi: 10.1017/S0022215106003653. [DOI] [PubMed] [Google Scholar]
- 8.Zirkle MS, McNelles LR. Nonattendance at a hospital-based otolaryngology clinic: a preliminary analysis within a universal healthcare system. Ear Nose Throat J. 2011;90:E32–34. [PubMed] [Google Scholar]
- 9.Hwang AS, Atlas SJ, Cronin P, et al. Appointment “no-shows” are an independent predictor of subsequent quality of care and resource utilization outcomes. Journal of general internal medicine. 2015;30:1426–1433. doi: 10.1007/s11606-015-3252-3. [DOI] [PMC free article] [PubMed] [Google Scholar]
- 10.Hughes CA, McMenamin P, Mehta V, Pillsbury H, Kennedy D. Otolaryngology workforce analysis. The Laryngoscope. 2016 doi: 10.1002/lary.26238. [DOI] [PubMed] [Google Scholar]
- 11.Quinn K. It’s no-show time! How leaders at one practice tackled the no-show problem--and how you can, too. MGMA Connex. 2007;7:44–49. 41. [PubMed] [Google Scholar]
- 12.Rosenthal BD, Hulst JB, Moric M, Levine BR, Sporer SM. The effect of payer type on clinical outcomes in total knee arthroplasty. The Journal of arthroplasty. 2014;29:295–298. doi: 10.1016/j.arth.2013.06.010. [DOI] [PubMed] [Google Scholar]
- 13. [Accessed November 15, 2016];Rural-Urban Continuum Codes. 2016 Oct 12; Available at: http://www.ers.usda.gov/data-products/rural-urban-continuum-codes/
- 14.Williamson JM, Datta S, Satten GA. Marginal analyses of clustered data when cluster size is informative. Biometrics. 2003;59:36–42. doi: 10.1111/1541-0420.00005. [DOI] [PubMed] [Google Scholar]
- 15.Shaw FE, Asomugha CN, Conway PH, Rein AS. The Patient Protection and Affordable Care Act: opportunities for prevention and public health. Lancet (London, England) 2014;384:75–82. doi: 10.1016/S0140-6736(14)60259-2. [DOI] [PubMed] [Google Scholar]
- 16.Chen JT, Israel JS, Poore SO, Rao VK. The Affordable Care Act: a primer for plastic surgeons. Plastic and reconstructive surgery. 2014;134:830e–837e. doi: 10.1097/PRS.0000000000000635. [DOI] [PubMed] [Google Scholar]
- 17.Services DoHaH. [Accessed August 31, 2016];Medicaid & CHIP: June 2016 Monthly Applications, Eligibility Determinations and Enrollment Report. 2016 Aug 25;2016 [Google Scholar]
- 18.Huang Z, Ashraf M, Gordish-Dressman H, Mudd P. The financial impact of clinic no-show rates in an academic pediatric Otolaryngology practice. Am J Otolaryngo. 2017;38:127–129. doi: 10.1016/j.amjoto.2016.11.004. [DOI] [PubMed] [Google Scholar]
- 19.Weiner BK, Black KP, Gish J. Access to spine care for the poor and near poor. Spine J. 2009;9:221–224. doi: 10.1016/j.spinee.2008.03.002. [DOI] [PubMed] [Google Scholar]
- 20.Miller AJ, Chae E, Peterson E, Ko AB. Predictors of repeated “no-showing” to clinic appointments. Am J Otolaryngol. 2015 May-Jun;36:411–414. doi: 10.1016/j.amjoto.2015.01.017. [DOI] [PubMed] [Google Scholar]
- 21.Bush ML, Hardin B, Rayle C, Lester C, Studts CR, Shinn JB. Rural barriers to early diagnosis and treatment of infant hearing loss in Appalachia. Otol Neurotol. 2015;36:93–98. doi: 10.1097/MAO.0000000000000636. [DOI] [PMC free article] [PubMed] [Google Scholar]
- 22.Parikh A, Gupta K, Wilson AC, Fields K, Cosgrove NM, Kostis JB. The effectiveness of outpatient appointment reminder systems in reducing no-show rates. Am J Med. 2010;123:542–548. doi: 10.1016/j.amjmed.2009.11.022. [DOI] [PubMed] [Google Scholar]
- 23.Phillips L, Hendren S, Humiston S, Winters P, Fiscella K. Improving breast and colon cancer screening rates: a comparison of letters, automated phone calls, or both. Journal of the American Board of Family Medicine : JABFM. 2015;28:46–54. doi: 10.3122/jabfm.2015.01.140174. [DOI] [PubMed] [Google Scholar]
- 24.Stubbs ND, Geraci SA, Stephenson PL, Jones DB, Sanders S. Methods to reduce outpatient non-attendance. The American journal of the medical sciences. 2012;344:211–219. doi: 10.1097/MAJ.0b013e31824997c6. [DOI] [PubMed] [Google Scholar]
- 25.Huang Y, Hanauer DA. Patient no-show predictive model development using multiple data sources for an effective overbooking approach. Applied clinical informatics. 2014;5:836–860. doi: 10.4338/ACI-2014-04-RA-0026. [DOI] [PMC free article] [PubMed] [Google Scholar]
- 26.Daggy J, Lawley M, Willis D, et al. Using no-show modeling to improve clinic performance. Health informatics journal. 2010;16:246–259. doi: 10.1177/1460458210380521. [DOI] [PubMed] [Google Scholar]
- 27.Izard T. Managing the habitual no-show patient. Fam Pract Manag. 2005;12:65–66. [PubMed] [Google Scholar]
- 28.DuMontier C, Rindfleisch K, Pruszynski J, Frey JJ., 3rd A multi-method intervention to reduce no-shows in an urban residency clinic. Family medicine. 2013;45:634–641. [PubMed] [Google Scholar]
- 29.Paydarfar JA, Gosselin BJ, Tietz AM. Improving Access to Head and Neck Cancer Surgical Services through the Incorporation of Associate Providers. Otolaryngol Head Neck Surg. 2016;155:723–728. doi: 10.1177/0194599816647945. [DOI] [PubMed] [Google Scholar]


